You are not logged in.
This means you
CAN ONLY VIEW reports that were published prior to Sunday, April 20, 2025.
You
MUST UPGRADE YOUR MEMBERSHIP if you want to see any current reports.
AFTER MARKET UPDATE - MONDAY, OCTOBER 16TH, 2023
Previous After Market Report Next After Market Report >>>
|
|
|
|
DOW |
+323.31 |
33,993.60 |
+0.96% |
|
Volume |
251,766,522 |
-71% |
|
Volume |
2,296,197,550 |
-46% |
|
NASDAQ |
+129.07 |
13,536.31 |
+0.96% |
|
Advancers |
2,139 |
76% |
|
Advancers |
2,919 |
71% |
|
S&P 500 |
+42.86 |
4,370.64 |
+0.99% |
|
Decliners |
682 |
24% |
|
Decliners |
1,215 |
29% |
|
Russell 2000 |
+25.07 |
1,744.78 |
+1.46% |
|
52 Wk Highs |
29 |
|
|
52 Wk Highs |
36 |
|
|
S&P 600 |
+19.18 |
1,131.94 |
+1.72% |
|
52 Wk Lows |
81 |
|
|
52 Wk Lows |
179 |
|
|
 |
Major Indices Posted Solid Gains With Thin Leadership
Kenneth J. Gruneisen - Passed the CAN SLIM® Master's Exam
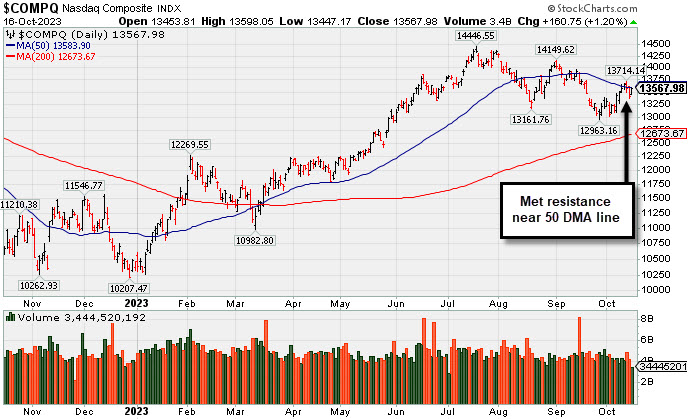
The Dow Jones Indistrial Average, S&P 500 and Nasdaq Composite posted solid gains ranging from +0.9% to +1.6% but closed off their best levels of the session. The volume totals were lighter than the prior session on the NYSE and on the Nasdaq exchange. Breadth was positive as advancers led decliners by a 3-1 margin on the NYSE and by a 5-2 margin on the Nasdaq exchange. There were 14 high-ranked companies from the Leaders List that hit a new 52-week high and were listed on the BreakOuts Page, versus the total of 19 on the prior session. New 52-week lows totals contracted yet still solidly outnumbered new 52-week highs on the NYSE and on the Nasdaq exchange. The market averages are in an uptrend (M criteria). New buying efforts should be made only in stocks meeting all key criteria of the fact-based investment system.
PICTURED: The Nasdaq Composite Index met resistance near its 50-day moving average (DMA) line.
Apple (AAPL -0.07%) was a notable laggard after Bloomberg reported that the iPhone 15 had a disappointing start to sales in China. All 11 S&P 500 sectors closed in the green. Eight sectors jumped at least +1.0%, led by consumer discretionary (+1.7%) and communication services (+1.5%). The energy sector (+0.7%) saw the slimmest gain amid falling oil prices ($86.62/bbl, -1.18, -1.3%). A Washington Post report suggested that the U.S. is aiming to ease sanctions on oil from Venezuela.
The 2-yr note yield rose four basis points to 5.09% and the 10-yr note yield rose eight basis points to 4.71%.
|
 Kenneth J. Gruneisen started out as a licensed stockbroker in August 1987, a couple of months prior to the historic stock market crash that took the Dow Jones Industrial Average down -22.6% in a single day. He has published daily fact-based fundamental and technical analysis on high-ranked stocks online for two decades. Through FACTBASEDINVESTING.COM, Kenneth provides educational articles, news, market commentary, and other information regarding proven investment systems that work in good times and bad.
Comments contained in the body of this report are technical opinions only and are not necessarily those of Gruneisen Growth Corp. The material herein has been obtained from sources believed to be reliable and accurate, however, its accuracy and completeness cannot be guaranteed. Our firm, employees, and customers may effect transactions, including transactions contrary to any recommendation herein, or have positions in the securities mentioned herein or options with respect thereto. Any recommendation contained in this report may not be suitable for all investors and it is not to be deemed an offer or solicitation on our part with respect to the purchase or sale of any securities. |
|
 |
Retail, Financial, and Tech Indexes Led Group Gainers
Kenneth J. Gruneisen - Passed the CAN SLIM® Master's Exam
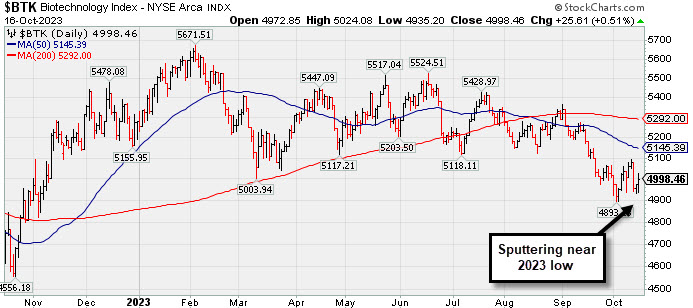
The Gold & Silver Index ($XAU +0.34%) and the Integrated Oil Index ($XOI +0.83%) rose while the Oil Services Index ($OSX -0.09%) ended slightly in the red. The Retail Index ($RLX +2.01%) outpaced both the Bank Index ($BKX +1.52%) and Broker/Dealer Index ($XBD +1.39%) while all posted influential gains that helped boost the major averages. The tech sector was led by the Networking Index ($NWX +2.75%) while the Semiconductor Index ($SOX +1.43%) also rose and the Biotech Index ($BTK +0.51%) posted a smaller gain.
PICTURED: The Semiconductor Index ($SOX -2.70%) has been sputtering near its 2023 low.
| Oil Services |
$OSX |
94.97 |
+0.14 |
+0.14% |
+13.25% |
| Integrated Oil |
$XOI |
1,952.96 |
+12.82 |
+0.66% |
+9.27% |
| Semiconductor |
$SOX |
3,489.68 |
+36.71 |
+1.06% |
+37.82% |
| Networking |
$NWX |
719.85 |
+15.99 |
+2.27% |
-8.10% |
| Broker/Dealer |
$XBD |
484.02 |
+8.81 |
+1.85% |
+7.77% |
| Retail |
$RLX |
3,420.85 |
+52.14 |
+1.55% |
+24.21% |
| Gold & Silver |
$XAU |
114.96 |
+0.61 |
+0.53% |
-4.88% |
| Bank |
$BKX |
77.23 |
+1.04 |
+1.37% |
-23.42% |
| Biotech |
$BTK |
4,999.11 |
+26.26 |
+0.53% |
-5.34% |
|
|
|
 |
Featured Stocks
Kenneth J. Gruneisen - Passed the CAN SLIM® Master's Exam
|
|
|
Color Codes Explained :
Y - Better candidates highlighted by our
staff of experts.
G - Previously featured
in past reports as yellow but may no longer be buyable under the
guidelines.
***Last / Change / Volume data in this table is the closing quote data***
|
|
|
THESE ARE NOT BUY RECOMMENDATIONS!
Comments contained in the body of this report are technical
opinions only. The material herein has been obtained
from sources believed to be reliable and accurate, however,
its accuracy and completeness cannot be guaranteed.
This site is not an investment advisor, hence it does
not endorse or recommend any securities or other investments.
Any recommendation contained in this report may not
be suitable for all investors and it is not to be deemed
an offer or solicitation on our part with respect to
the purchase or sale of any securities. All trademarks,
service marks and trade names appearing in this report
are the property of their respective owners, and are
likewise used for identification purposes only.
This report is a service available
only to active Paid Premium Members.
You may opt-out of receiving report notifications
at any time. Questions or comments may be submitted
by writing to Premium Membership Services 665 S.E. 10 Street, Suite 201 Deerfield Beach, FL 33441-5634 or by calling 1-800-965-8307
or 954-785-1121.
|
|
|