You are not logged in.
This means you
CAN ONLY VIEW reports that were published prior to Sunday, April 20, 2025.
You
MUST UPGRADE YOUR MEMBERSHIP if you want to see any current reports.
AFTER MARKET UPDATE - FRIDAY, OCTOBER 13TH, 2023
Previous After Market Report Next After Market Report >>>
|
|
|
|
DOW |
+39.15 |
33,670.29 |
+0.12% |
|
Volume |
855,453,853 |
+3% |
|
Volume |
4,270,535,100 |
-13% |
|
NASDAQ |
-166.98 |
13,407.23 |
-1.23% |
|
Advancers |
1,063 |
38% |
|
Advancers |
1,555 |
37% |
|
S&P 500 |
-21.83 |
4,327.78 |
-0.50% |
|
Decliners |
1,724 |
62% |
|
Decliners |
2,682 |
63% |
|
Russell 2000 |
-14.54 |
1,719.71 |
-0.84% |
|
52 Wk Highs |
20 |
|
|
52 Wk Highs |
32 |
|
|
S&P 600 |
-13.06 |
1,112.76 |
-1.16% |
|
52 Wk Lows |
155 |
|
|
52 Wk Lows |
347 |
|
|
 |
Major Indices Ended Mixed With Less Leadership
Kenneth J. Gruneisen - Passed the CAN SLIM® Master's Exam
The major indices finished Friday mixed. The volume totals were higher than the prior session on the NYSE and lighter on the Nasdaq exchange. Breadth was negative as decliners led advancers by a 3-2 margin on the NYSE and by a 5-3 margin on the Nasdaq exchange. There were 19 high-ranked companies from the Leaders List that hit a new 52-week high and were listed on the BreakOuts Page, versus the total of 27 on the prior session. New 52-week lows totals expanded and solidly outnumbered shrinking new 52-week highs on the NYSE and on the Nasdaq exchange. The market averages are in an uptrend (M criteria). New buying efforts should be made only in stocks meeting all key criteria of the fact-based investment system.
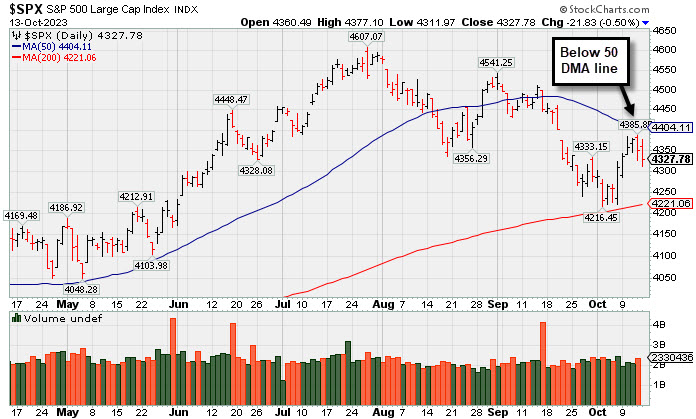
PICTURED: The S&P 500 Index pulled back for a 2nd consecutive session, meeting resistance near its 50-day moving average (DMA) line.
Five of the 11 S&P 500 sectors closed with gains. Energy (+2.3%) was the top performer by a wide margin thanks to a jump in oil prices ($87.80/bbl, +4.73, +5.7%), which was another manifestation of the geopolitical angst. The financials sector (+0.2%) also logged a gain. Weakness in the mega cap space had a disproportionate impact on the S&P 500 and Nasdaq Composite.
Good news on the earnings front from Dow components UnitedHealth (UNH +2.64%) and JPMorgan Chase (JPM +1.50%) made them standout winners along with Wells Fargo (WFC +3.07%), following their better-than-expected earnings and/or guidance.
Geopolitical uncertainty weighed on sentiment ahead of the weekend following the news that Israel warned 1.1 million residents in the northern Gaza Strip to evacuate within 24 hours. At the same time, Iran's foreign minister has noted that Israel's continued siege of Gaza "will face reactions in other areas."
Rates moved off their lows after the preliminary University of Michigan Consumer Sentiment Survey showed a pickup in year ahead inflation expectations to 3.8% from 3.2% and long run inflation expectations to 3.0% from 2.8%. The 2-yr note yield fell one basis point to 5.05%. The 10-yr note yield declined eight basis points to 4.63%.
|
 Kenneth J. Gruneisen started out as a licensed stockbroker in August 1987, a couple of months prior to the historic stock market crash that took the Dow Jones Industrial Average down -22.6% in a single day. He has published daily fact-based fundamental and technical analysis on high-ranked stocks online for two decades. Through FACTBASEDINVESTING.COM, Kenneth provides educational articles, news, market commentary, and other information regarding proven investment systems that work in good times and bad.
Comments contained in the body of this report are technical opinions only and are not necessarily those of Gruneisen Growth Corp. The material herein has been obtained from sources believed to be reliable and accurate, however, its accuracy and completeness cannot be guaranteed. Our firm, employees, and customers may effect transactions, including transactions contrary to any recommendation herein, or have positions in the securities mentioned herein or options with respect thereto. Any recommendation contained in this report may not be suitable for all investors and it is not to be deemed an offer or solicitation on our part with respect to the purchase or sale of any securities. |
|
 |
Commodity-Linked Groups Rose While Retail and Tech Indexes Fell
Kenneth J. Gruneisen - Passed the CAN SLIM® Master's Exam
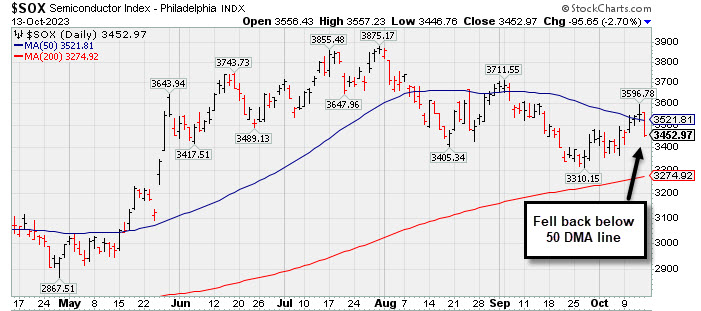
The Gold & Silver Index ($XAU +4.43%) was a standout gainer while the Oil Services Index ($OSX +1.76%) and the Integrated Oil Index ($XOI +2.067%) also posted solid gains. The Retail Index ($RLX -1.31%) outpaced both the Bank Index ($BKX -0.39%) and Broker/Dealer Index ($XBD -0.82%) to the downside. The tech sector was led by the Biotech Index ($BTK +0.38%) with a small gain, meanwhile the Semiconductor Index ($SOX -2.70%) and the Networking Index ($NWX -1.81%) suffered larger losses.
PICTURED: The Semiconductor Index ($SOX -2.70%) fell back below its 50-day moving average line.
| Oil Services |
$OSX |
94.83 |
+1.64 |
+1.76% |
+13.09% |
| Integrated Oil |
$XOI |
1,940.14 |
+39.14 |
+2.06% |
+8.55% |
| Semiconductor |
$SOX |
3,452.97 |
-95.65 |
-2.70% |
+36.37% |
| Networking |
$NWX |
703.86 |
-13.00 |
-1.81% |
-10.14% |
| Broker/Dealer |
$XBD |
475.21 |
-3.95 |
-0.82% |
+5.81% |
| Retail |
$RLX |
3,368.71 |
-44.68 |
-1.31% |
+22.32% |
| Gold & Silver |
$XAU |
114.35 |
+4.75 |
+4.34% |
-5.39% |
| Bank |
$BKX |
76.18 |
-0.30 |
-0.39% |
-24.46% |
| Biotech |
$BTK |
4,972.85 |
+18.79 |
+0.38% |
-5.84% |
|
|
|
 |
Featured Stocks
Kenneth J. Gruneisen - Passed the CAN SLIM® Master's Exam
|
|
|
Color Codes Explained :
Y - Better candidates highlighted by our
staff of experts.
G - Previously featured
in past reports as yellow but may no longer be buyable under the
guidelines.
***Last / Change / Volume data in this table is the closing quote data***
|
|
|
THESE ARE NOT BUY RECOMMENDATIONS!
Comments contained in the body of this report are technical
opinions only. The material herein has been obtained
from sources believed to be reliable and accurate, however,
its accuracy and completeness cannot be guaranteed.
This site is not an investment advisor, hence it does
not endorse or recommend any securities or other investments.
Any recommendation contained in this report may not
be suitable for all investors and it is not to be deemed
an offer or solicitation on our part with respect to
the purchase or sale of any securities. All trademarks,
service marks and trade names appearing in this report
are the property of their respective owners, and are
likewise used for identification purposes only.
This report is a service available
only to active Paid Premium Members.
You may opt-out of receiving report notifications
at any time. Questions or comments may be submitted
by writing to Premium Membership Services 665 S.E. 10 Street, Suite 201 Deerfield Beach, FL 33441-5634 or by calling 1-800-965-8307
or 954-785-1121.
|
|
|