Symbol/Exchange
Company Name
Industry Group |
PRICE |
CHANGE
(%Change) |
Day High |
Volume
(% DAV)
(% 50 day avg vol) |
52 Wk Hi
% From Hi |
Featured
Date |
Price
Featured |
Pivot Featured |
|
Max Buy |
ALXN
-
NASDAQ
Alexion Pharmaceuticals
DRUGS - Drug Manufacturers - Other
|
$112.16
|
+0.75
0.67% |
$113.33
|
829,329
83.87% of 50 DAV
50 DAV is 988,800
|
$119.54
-6.17%
|
8/23/2012
|
$103.70
|
PP = $110.06
|
|
MB = $115.56
|
Most Recent Note - 10/9/2012 1:47:51 PM
Y - Color code is changed to yellow after retreating below its "max buy" level. The prior highs in the $110 area define chart support along with its 50 DMA line where violations would raise concerns and trigger technical sell signals..
>>> The latest Featured Stock Update with an annotated graph appeared on 9/26/2012. Click here.
View all notes |
Alert me of new notes |
CANSLIM.net Company Profile |
SEC |
Zacks Reports |
StockTalk |
News |
Chart |
Request a new note
C
A N
S L
I M


|
ASPS
-
NASDAQ
Altisource Ptf Sltns Sa
REAL ESTATE - Property Management/Developmen
|
$111.08
|
+2.69
2.48% |
$112.59
|
151,282
87.95% of 50 DAV
50 DAV is 172,000
|
$115.73
-4.02%
|
9/24/2012
|
$87.24
|
PP = $92.39
|
|
MB = $97.01
|
 Most Recent Note - 10/11/2012 5:39:58 PM
G - Small gap up gain today was backed by below average volume. Consolidating after getting very extended from its prior base with 2 big volume-driven gains last week. Prior highs in the $92 area define initial support to watch on pullbacks.
>>> The latest Featured Stock Update with an annotated graph appeared on 9/11/2012. Click here.
View all notes |
Alert me of new notes |
CANSLIM.net Company Profile |
SEC |
Zacks Reports |
StockTalk |
News |
Chart |
Request a new note
C
A N
S L
I M
|
BRLI
-
NASDAQ
Bio Reference Labs Inc
HEALTH SERVICES - Medical Laboratories and Researc
|
$32.30
|
+0.79
2.51% |
$32.77
|
318,280
112.35% of 50 DAV
50 DAV is 283,300
|
$32.86
-1.70%
|
10/3/2012
|
$30.90
|
PP = $30.25
|
|
MB = $31.76
|
Most Recent Note - 10/11/2012 5:37:55 PM
G - Gapped up today and finished at its second-best close after consolidating under its "max buy" level following its 10/03/12 technical buy signal. Prior highs in the $30 area define initial chart support above its 50 DMA line.
>>> The latest Featured Stock Update with an annotated graph appeared on 10/8/2012. Click here.
View all notes |
Alert me of new notes |
CANSLIM.net Company Profile |
SEC |
Zacks Reports |
StockTalk |
News |
Chart |
Request a new note
C
A N
S L
I M
|
CFNL
-
NASDAQ
Cardinal Financial Corp
BANKING - Regional - Southeast Banks
|
$14.24
|
+0.06
0.42% |
$14.30
|
86,535
108.03% of 50 DAV
50 DAV is 80,100
|
$14.79
-3.72%
|
8/17/2012
|
$12.84
|
PP = $13.31
|
|
MB = $13.98
|
Most Recent Note - 10/11/2012 12:09:05 PM
G - Traded above average volume in recent weeks without making meaningful price progress. This distributional action has raised concerns, yet it has not suffered worrisome technical damage. Its recent low ($13.80 on 10/03/12) defines near-term support above its 50 DMA line where violations would trigger technical sell signals.
>>> The latest Featured Stock Update with an annotated graph appeared on 9/25/2012. Click here.
View all notes |
Alert me of new notes |
CANSLIM.net Company Profile |
SEC |
Zacks Reports |
StockTalk |
News |
Chart |
Request a new note
C
A N
S L
I M
|
CMCSA
-
NASDAQ
Comcast Corp Cl A
MEDIA - CATV Systems
|
$35.13
|
-0.03
-0.09% |
$35.56
|
14,016,325
112.69% of 50 DAV
50 DAV is 12,437,700
|
$36.98
-5.00%
|
6/11/2012
|
$29.94
|
PP = $30.98
|
|
MB = $32.53
|
Most Recent Note - 10/9/2012 1:56:21 PM
G - Consolidating quietly after wedging to a new 52-week high with gains in the past week lacking great volume conviction. Prior highs in the $35 area define support to watch above its 50 DMA line where violations would trigger technical sell signals. Fundamental concerns have been repeatedly noted - "Due to sub par sales and earnings growth in the Jun '12 quarter."
>>> The latest Featured Stock Update with an annotated graph appeared on 9/21/2012. Click here.
View all notes |
Alert me of new notes |
CANSLIM.net Company Profile |
SEC |
Zacks Reports |
StockTalk |
News |
Chart |
Request a new note
C
A N
S L
I M
|
Symbol/Exchange
Company Name
Industry Group |
PRICE |
CHANGE
(%Change) |
Day High |
Volume
(% DAV)
(% 50 day avg vol) |
52 Wk Hi
% From Hi |
Featured
Date |
Price
Featured |
Pivot Featured |
|
Max Buy |
DVA
-
NYSE
Davita Inc
HEALTH SERVICES - Specialized Health Services
|
$109.47
|
-0.09
-0.08% |
$111.30
|
797,546
105.51% of 50 DAV
50 DAV is 755,900
|
$110.38
-0.82%
|
9/5/2012
|
$102.92
|
PP = $100.62
|
|
MB = $105.65
|
Most Recent Note - 10/10/2012 7:54:36 PM
G - Hit another new 52-week high today with another volume-driven gain, getting even more extended from its latest sound base. Prior highs near $100 and its 50 DMA line define near term support to watch on pullbacks where violations may trigger technical sell signals. See the latest FSU analysis for more details and a new annotated graph.
>>> The latest Featured Stock Update with an annotated graph appeared on 10/10/2012. Click here.
View all notes |
Alert me of new notes |
CANSLIM.net Company Profile |
SEC |
Zacks Reports |
StockTalk |
News |
Chart |
Request a new note
C
A N
S L
I M
|
EXPE
-
NASDAQ
Expedia Inc
INTERNET - Internet Information Providers
|
$54.25
|
-1.03
-1.86% |
$55.75
|
4,186,429
155.30% of 50 DAV
50 DAV is 2,695,700
|
$60.29
-10.02%
|
4/27/2012
|
$41.80
|
PP = $35.57
|
|
MB = $37.35
|
Most Recent Note - 10/10/2012 1:46:10 PM
G - It is currently -8.0% off its 52-week high and just above important support at its 50 DMA line where a violation may raise more serious concerns and trigger a technical sell signal. Noted repeatedly in recent weeks - "No overhead supply remains to hinder its progress, however weak industry group action and iffy fundamentals were noted as causes for concern." See more details and an annotated graph in the latest FSU analysis under the headline "Online Travel Firm Resilient Despite Unfavorable Signs - Wednesday, September 19, 2012"
>>> The latest Featured Stock Update with an annotated graph appeared on 9/19/2012. Click here.
View all notes |
Alert me of new notes |
CANSLIM.net Company Profile |
SEC |
Zacks Reports |
StockTalk |
News |
Chart |
Request a new note
C
A N
S L
I M
|
GPX
-
NYSE
G P Strategies Corp
DIVERSIFIED SERVICES - Education and Training Services
|
$19.01
|
-0.49
-2.51% |
$19.81
|
51,143
67.29% of 50 DAV
50 DAV is 76,000
|
$20.67
-8.03%
|
10/8/2012
|
$20.00
|
PP = $20.77
|
|
MB = $21.81
|
Most Recent Note - 10/11/2012 5:47:54 PM
G - Slumped below its 50 DMA line today ending near the session low and its color code is changed to green. Volume driven gains above the pivot point have not triggered a new (or add-on) technical buy signal. Losses exceeding last week's low $18.82 would raise more serious concerns and trigger technical sell signals.
>>> The latest Featured Stock Update with an annotated graph appeared on 9/13/2012. Click here.
View all notes |
Alert me of new notes |
CANSLIM.net Company Profile |
SEC |
Zacks Reports |
StockTalk |
News |
Chart |
Request a new note
C
A N
S L
I M
|
LKQ
-
NASDAQ
L K Q Corp
WHOLESALE - Auto Parts
|
$19.69
|
+0.44
2.29% |
$19.82
|
1,526,840
110.62% of 50 DAV
50 DAV is 1,380,200
|
$20.02
-1.62%
|
8/9/2012
|
$18.97
|
PP = $18.72
|
|
MB = $19.66
|
Most Recent Note - 10/11/2012 5:43:48 PM
Y - Rallied with above average volume today for its second-best close, finishing only -1.6% off its 52-week and all-time highs and near its "max buy" level with no resistance remaining due to overhead supply. Do not be confused by a 2:1 share split effective 9/19/12 (Featured Price, Pivot Point and Max Buy were adjusted).
>>> The latest Featured Stock Update with an annotated graph appeared on 9/17/2012. Click here.
View all notes |
Alert me of new notes |
CANSLIM.net Company Profile |
SEC |
Zacks Reports |
StockTalk |
News |
Chart |
Request a new note
C
A N
S L
I M
|
LNKD
-
NYSE
Linkedin Corp Class A
INTERNET - Internet Information Providers
|
$113.77
|
+1.79
1.60% |
$116.71
|
3,120,991
129.52% of 50 DAV
50 DAV is 2,409,700
|
$125.50
-9.35%
|
9/5/2012
|
$113.25
|
PP = $113.10
|
|
MB = $118.76
|
Most Recent Note - 10/11/2012 5:45:16 PM
Y - Color code is changed to yellow after making a stand and tallying a gain with above average volume near its prior highs in the $113 area and its 50 DMA line. Disciplined investors always limit losses if ever any stock falls more than -7% from where it was purchased. See the latest FSU analysis for more details and a new annotated graph.
>>> The latest Featured Stock Update with an annotated graph appeared on 10/9/2012. Click here.
View all notes |
Alert me of new notes |
CANSLIM.net Company Profile |
SEC |
Zacks Reports |
StockTalk |
News |
Chart |
Request a new note
C
A N
S L
I M
|
Symbol/Exchange
Company Name
Industry Group |
PRICE |
CHANGE
(%Change) |
Day High |
Volume
(% DAV)
(% 50 day avg vol) |
52 Wk Hi
% From Hi |
Featured
Date |
Price
Featured |
Pivot Featured |
|
Max Buy |
LULU
-
NASDAQ
Lululemon Athletica
MANUFACTURING - Textile Manufacturing
|
$72.70
|
-0.28
-0.38% |
$74.24
|
840,183
33.40% of 50 DAV
50 DAV is 2,515,700
|
$81.09
-10.35%
|
10/2/2012
|
$74.89
|
PP = $78.97
|
|
MB = $82.92
|
Most Recent Note - 10/8/2012 4:11:58 PM
Y - Following its cup-with-handle base pattern there have not yet been the volume-driven gains above its pivot point needed to confirm a technical buy signal. Fundamentals remain strong (good C and A criteria) and very little resistance from overhead supply is there to hinder its progress.
>>> The latest Featured Stock Update with an annotated graph appeared on 10/2/2012. Click here.
View all notes |
Alert me of new notes |
CANSLIM.net Company Profile |
SEC |
Zacks Reports |
StockTalk |
News |
Chart |
Request a new note
C
A N
S L
I M
|
MIDD
-
NASDAQ
Middleby Corp
MANUFACTURING - Diversified Machinery
|
$118.45
|
-0.55
-0.46% |
$120.49
|
57,575
56.12% of 50 DAV
50 DAV is 102,600
|
$122.57
-3.36%
|
10/8/2012
|
$118.46
|
PP = $122.67
|
|
MB = $128.80
|
Most Recent Note - 10/8/2012 3:54:32 PM
Y - Perched -3.4% off its 52-week high today with volume totals cooling in recent weeks while holding its ground. Color code is changed to yellow with new pivot point cited based on its 9/06/12 high plus 10 cents. Subsequent volume-driven gains above the pivot point may trigger a new (or add-on) technical buy signal. Its 50 DMA line and recent lows define near-term chart support to watch.
>>> The latest Featured Stock Update with an annotated graph appeared on 9/18/2012. Click here.
View all notes |
Alert me of new notes |
CANSLIM.net Company Profile |
SEC |
Zacks Reports |
StockTalk |
News |
Chart |
Request a new note
C
A N
S L
I M
|
N
-
NYSE
Netsuite Inc
DIVERSIFIED SERVICES - Business/Management Services
|
$60.00
|
+0.06
0.10% |
$60.90
|
438,251
72.75% of 50 DAV
50 DAV is 602,400
|
$64.70
-7.26%
|
8/20/2012
|
$55.88
|
PP = $59.32
|
|
MB = $62.29
|
Most Recent Note - 10/9/2012 2:01:26 PM
Y - Color code is changed to yellow while quietly consolidating back below its "max buy" level. Prior highs near $59 closely coincide with its 50 DMA line defining important chart support where subsequent violations would trigger technical sell signals.
>>> The latest Featured Stock Update with an annotated graph appeared on 9/24/2012. Click here.
View all notes |
Alert me of new notes |
CANSLIM.net Company Profile |
SEC |
Zacks Reports |
StockTalk |
News |
Chart |
Request a new note
C
A N
S L
I M
|
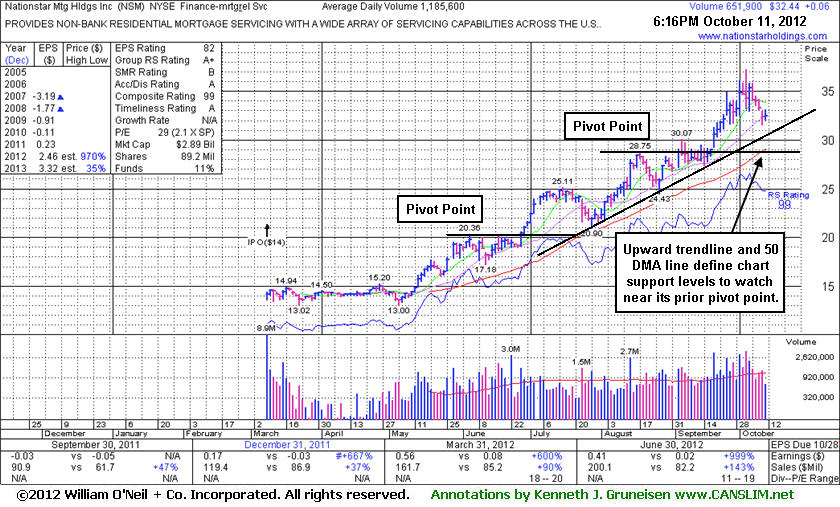
NSM
-
NYSE
Nationstar Mtg Hldgs Inc
FINANCIAL SERVICES - Credit Services
|
$32.44
|
+0.06
0.19% |
$33.10
|
657,008
55.42% of 50 DAV
50 DAV is 1,185,600
|
$37.20
-12.80%
|
8/29/2012
|
$27.96
|
PP = $28.85
|
|
MB = $30.29
|
Most Recent Note - 10/11/2012 6:48:40 PM
G - Gain on light volume today halted a 4 session losing streak on higher volume. A steep upward trendline connecting July-September lows defines a near-term support level to watch above its 50 DMA line. See the latest FSU analysis for more details and a new annotated graph.
>>> The latest Featured Stock Update with an annotated graph appeared on 10/11/2012. Click here.
View all notes |
Alert me of new notes |
CANSLIM.net Company Profile |
SEC |
Zacks Reports |
StockTalk |
News |
Chart |
Request a new note
C
A N
S L
I M
|
OSIS
-
NASDAQ
O S I Systems Inc
ELECTRONICS - Semiconductor Equipment and Mate
|
$75.51
|
-0.30
-0.40% |
$77.18
|
39,857
30.04% of 50 DAV
50 DAV is 132,700
|
$78.93
-4.33%
|
9/5/2012
|
$74.39
|
PP = $75.10
|
|
MB = $78.86
|
Most Recent Note - 10/8/2012 4:13:40 PM
Y - Consolidating just -4% off its 52-week high today. It remains below its "max buy" level after bullish action recently confirmed a technical buy signal. Near term support is at its 50 DMA line.
>>> The latest Featured Stock Update with an annotated graph appeared on 9/14/2012. Click here.
View all notes |
Alert me of new notes |
CANSLIM.net Company Profile |
SEC |
Zacks Reports |
StockTalk |
News |
Chart |
Request a new note
C
A N
S L
I M
|
Symbol/Exchange
Company Name
Industry Group |
PRICE |
CHANGE
(%Change) |
Day High |
Volume
(% DAV)
(% 50 day avg vol) |
52 Wk Hi
% From Hi |
Featured
Date |
Price
Featured |
Pivot Featured |
|
Max Buy |
RNF
-
NYSE
Rentech Nitrogen Ptnr Lp
CHEMICALS - Agricultural Chemicals
|
$35.07
|
+0.13
0.37% |
$35.55
|
341,869
74.86% of 50 DAV
50 DAV is 456,700
|
$40.05
-12.43%
|
7/27/2012
|
$29.58
|
PP = $30.60
|
|
MB = $32.13
|
Most Recent Note - 10/9/2012 2:24:16 PM
G - Consolidating just above its 50 DMA line ($34.69) defining important near-term support after the previously noted upward trendline violation. Gains lacked volume conviction after it halted its slide.
>>> The latest Featured Stock Update with an annotated graph appeared on 10/4/2012. Click here.
View all notes |
Alert me of new notes |
CANSLIM.net Company Profile |
SEC |
Zacks Reports |
StockTalk |
News |
Chart |
Request a new note
C
A N
S L
I M
|
SWI
-
NYSE
Solarwinds Inc
COMPUTER SOFTWARE and SERVICES - Application Software
|
$53.31
|
-0.26
-0.49% |
$54.59
|
623,371
75.18% of 50 DAV
50 DAV is 829,200
|
$60.95
-12.53%
|
7/25/2012
|
$47.82
|
PP = $47.89
|
|
MB = $50.28
|
Most Recent Note - 10/10/2012 1:42:30 PM
G - Today's loss undercut the 9/26/12 low ($53.78) raising more serious concerns. A secondary buy point was explained in the latest FSU analysis along with a new annotated graph, but caution is advised unless strength returns and it rises back above its 50 DMA line promptly. Prior highs in the $48 area define the next chart support level.
>>> The latest Featured Stock Update with an annotated graph appeared on 10/3/2012. Click here.
View all notes |
Alert me of new notes |
CANSLIM.net Company Profile |
SEC |
Zacks Reports |
StockTalk |
News |
Chart |
Request a new note
C
A N
S L
I M
|
TDG
-
NYSE
Transdigm Group Inc
AEROSPACE/DEFENSE - Aerospace/Defense Products and; Services
|
$145.60
|
+0.54
0.37% |
$148.00
|
209,031
50.65% of 50 DAV
50 DAV is 412,700
|
$152.62
-4.60%
|
8/16/2012
|
$132.23
|
PP = $136.44
|
|
MB = $143.26
|
Most Recent Note - 10/10/2012 1:34:12 PM
G - Quietly consolidating still above its "max buy" level. Its 50 DMA line and prior lows define near-term support to watch in the $138 area where violations may trigger technical sell signals.
>>> The latest Featured Stock Update with an annotated graph appeared on 9/20/2012. Click here.
View all notes |
Alert me of new notes |
CANSLIM.net Company Profile |
SEC |
Zacks Reports |
StockTalk |
News |
Chart |
Request a new note
C
A N
S L
I M
|
ULTA
-
NASDAQ
Ulta Salon Cosm & Frag
SPECIALTY RETAIL - Specialty Retail, Other
|
$95.65
|
-0.69
-0.72% |
$97.54
|
419,303
56.34% of 50 DAV
50 DAV is 744,200
|
$103.52
-7.60%
|
9/4/2012
|
$93.17
|
PP = $98.52
|
|
MB = $103.45
|
Most Recent Note - 10/9/2012 2:20:54 PM
Y - Slumping near recent lows and its 50 DMA line defining important near-term chart support. Its Relative Strength Rating has slumped to 80, the minimum rank for ideal buy candidates under the fact-based investment system. The latest FSU analysis discussed its waning Relative Strength under the headline "Relative Strength Line Did Not Provide Confirmation - Friday, October 05, 2012".
>>> The latest Featured Stock Update with an annotated graph appeared on 10/5/2012. Click here.
View all notes |
Alert me of new notes |
CANSLIM.net Company Profile |
SEC |
Zacks Reports |
StockTalk |
News |
Chart |
Request a new note
C
A N
S L
I M
|
ULTI
-
NASDAQ
Ultimate Software Group
INTERNET - Internet Software and Services
|
$99.48
|
-0.41
-0.41% |
$101.19
|
84,284
52.16% of 50 DAV
50 DAV is 161,600
|
$106.40
-6.50%
|
8/27/2012
|
$98.36
|
PP = $99.19
|
|
MB = $104.15
|
Most Recent Note - 10/10/2012 1:35:39 PM
Y - Consolidating above its 50 DMA line and recent lows in the $96 area where violations would raise concerns and trigger technical sell signals.
>>> The latest Featured Stock Update with an annotated graph appeared on 9/27/2012. Click here.
View all notes |
Alert me of new notes |
CANSLIM.net Company Profile |
SEC |
Zacks Reports |
StockTalk |
News |
Chart |
Request a new note
C
A N
S L
I M
|
Symbol/Exchange
Company Name
Industry Group |
PRICE |
CHANGE
(%Change) |
Day High |
Volume
(% DAV)
(% 50 day avg vol) |
52 Wk Hi
% From Hi |
Featured
Date |
Price
Featured |
Pivot Featured |
|
Max Buy |
VSI
-
NYSE
Vitamin Shoppe Inc
SPECIALTY RETAIL - Specialty Retail, Other
|
$56.71
|
-0.85
-1.48% |
$58.08
|
74,177
21.40% of 50 DAV
50 DAV is 346,700
|
$61.83
-8.27%
|
6/29/2012
|
$54.93
|
PP = $55.03
|
|
MB = $57.78
|
Most Recent Note - 10/9/2012 2:10:09 PM
G - Volume totals have been below average in recent weeks while consolidating near its 50 DMA line. It faces some resistance due to overhead supply up through the $60 area after recently stalling. Recent lows near $55 define the next important chart support below its short-term average.
>>> The latest Featured Stock Update with an annotated graph appeared on 9/10/2012. Click here.
View all notes |
Alert me of new notes |
CANSLIM.net Company Profile |
SEC |
Zacks Reports |
StockTalk |
News |
Chart |
Request a new note
C
A N
S L
I M
|
WPI
-
NYSE
Watson Pharmaceuticals
DRUGS - Drugs - Generic
|
$86.89
|
-0.44
-0.50% |
$87.79
|
414,265
43.13% of 50 DAV
50 DAV is 960,600
|
$88.33
-1.63%
|
8/24/2012
|
$82.90
|
PP = $81.10
|
|
MB = $85.16
|
Most Recent Note - 10/9/2012 2:12:55 PM
G - Holding its ground this week with light volume totals after hitting new 52-week highs with gains on higher volume, It is extended from its prior base, and prior lows and its 50 DMA line in the $82 area define important support to watch on pullbacks.
>>> The latest Featured Stock Update with an annotated graph appeared on 9/28/2012. Click here.
View all notes |
Alert me of new notes |
CANSLIM.net Company Profile |
SEC |
Zacks Reports |
StockTalk |
News |
Chart |
Request a new note
C
A N
S L
I M
|