You are not logged in.
This means you
CAN ONLY VIEW reports that were published prior to Wednesday, April 9, 2025.
You
MUST UPGRADE YOUR MEMBERSHIP if you want to see any current reports.
AFTER MARKET UPDATE - MONDAY, OCTOBER 10TH, 2011
Previous After Market Report Next After Market Report >>>
|
|
|
|
DOW |
+330.06 |
11,433.18 |
+2.97% |
|
Volume |
888,123,590 |
-22% |
|
Volume |
1,544,138,740 |
-25% |
|
NASDAQ |
+86.70 |
2,566.05 |
+3.50% |
|
Advancers |
2,788 |
90% |
|
Advancers |
2,124 |
80% |
|
S&P 500 |
+39.43 |
1,194.89 |
+3.41% |
|
Decliners |
256 |
8% |
|
Decliners |
437 |
17% |
|
Russell 2000 |
+28.69 |
684.90 |
+4.37% |
|
52 Wk Highs |
22 |
|
|
52 Wk Highs |
14 |
|
|
S&P 600 |
+15.47 |
379.22 |
+4.25% |
|
52 Wk Lows |
9 |
|
|
52 Wk Lows |
66 |
|
|
 |
Breadth Positive With Indices' Big Gains; Holiday Session Volume Light
Kenneth J. Gruneisen - Passed the CAN SLIM® Master's Exam
Banks and the U.S. bond market were closed for the Columbus Day holiday, and Monday's trading volume totals were well below the average session. Breadth was very positive as advancing issues led declining issues by nearly 11-1 on the NYSE and by nearly 5-1 on the Nasdaq exchange. New 52-week lows still outnumbered new 52-week highs on the Nasdaq exchange, however, new 52-week highs outnumbered new lows on the NYSE. On Monday there were 10 high-ranked companies from the CANSLIM.net Leaders List that made new 52-week highs and appeared on the CANSLIM.net BreakOuts Page, up from 4 on the prior session. There were gains for 4 of the 5 high-ranked companies currently included on the Featured Stocks Page.
Stocks were sharply higher after government leaders in Germany and France said they would develop a plan to recapitalize banks by the end of the month. The euro strengthened against the dollar, boosting shares of U.S. companies with overseas operations. It was not the only sharp currency move. China's currency rallied the most against the dollar since 2005 as the two countries worked to avoid a trade war.
Energy stocks are among the leaders as the price of oil climbed to a two-week high. A merger also gave an extra boost to oilfield service companies. Complete Production Services Inc (CPX +39.45%) posted a big gain after Superior Energy Services Inc (SPN -13.79%) said it would buy the company for $2.6 billion. Apple Inc (AAPL +5.14%) jumped after receiving more than one million pre-orders for the new iPhone 4S in a single day. Netflix Inc (NFLX +4.77%) rose after retreating from a decision to split its mail-order DVD service from its Internet streaming.
A heavy wave of distributional action pushed the benchmark S&P 500 Index beyond the -20% Bear Market threshold at last week's lows. The market environment (M criteria) is still uncertain and disciplined investors are now watching for a follow-through day (FTD) of solid gains on higher volume from at least one of the major averages coupled with an expansion in the number of stocks hitting new highs. A convincing FTD could confirm a new rally and signal that odds have again turned more favorable for investors to begin making new buying efforts. Historic studies suggest that it is most ideal for a FTD to come between Day 4-7 of a new rally attempt. Tuesday's session will mark Day 6 of the current rally attempt.
The Q3 2011 Webcast (aired on September 28th) is now available "ON DEMAND" - (CLICK HERE) It provides an informative review of current market conditions, leading groups, and best buy candidates. All upgraded members are eligible to access the webcast presentation at no additional cost! Via the Premium Member Homepage links to all prior reports and webcasts are always available.
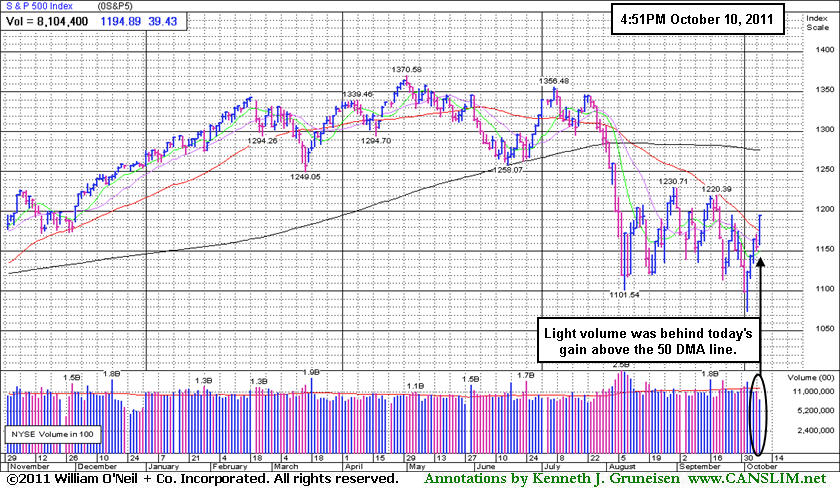
PICTURED: The S&P 500 Index hit a 13-month low last week. Since then, the index has rebounded +8.7%, and Monday's light volume gain helped it rise above its 50-day moving average (DMA) line for the first time since July.
|
 Kenneth J. Gruneisen started out as a licensed stockbroker in August 1987, a couple of months prior to the historic stock market crash that took the Dow Jones Industrial Average down -22.6% in a single day. He has published daily fact-based fundamental and technical analysis on high-ranked stocks online for two decades. Through FACTBASEDINVESTING.COM, Kenneth provides educational articles, news, market commentary, and other information regarding proven investment systems that work in good times and bad.
Comments contained in the body of this report are technical opinions only and are not necessarily those of Gruneisen Growth Corp. The material herein has been obtained from sources believed to be reliable and accurate, however, its accuracy and completeness cannot be guaranteed. Our firm, employees, and customers may effect transactions, including transactions contrary to any recommendation herein, or have positions in the securities mentioned herein or options with respect thereto. Any recommendation contained in this report may not be suitable for all investors and it is not to be deemed an offer or solicitation on our part with respect to the purchase or sale of any securities. |
|
 |
Financial, Energy, Tech, and Defensive Groups Rallied
Kenneth J. Gruneisen - Passed the CAN SLIM® Master's Exam
The Broker/Dealer Index ($XBD +4.77%) Bank Index ($BKX +5.31%) were standout gainers on Monday. Energy-related shares also posted big gains as the Integrated Oil Index ($XOI +4.46%) and Oil Services Index ($OSX +4.66%) spurted higher. The Retail Index ($RLX +2.86%) rose, and a positive bias in the tech sector helped the Biotechnology Index ($BTK +1.53%), Semiconductor Index ($SOX +2.82%), Internet Index ($IIX +3.07%), and Networking Index ($NWX +3.41%) tally unanimous gains. Defensive groups also were given a boost as the Gold & Silver Index ($XAU +3.39%) and Healthcare Index ($HMO +3.75%) climbed higher.
Charts courtesy www.stockcharts.com
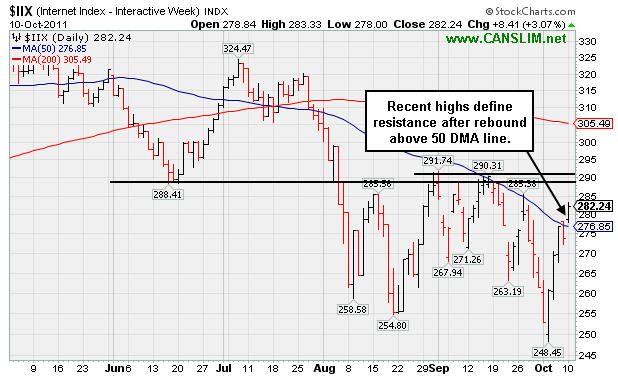
PICTURED: The Internet Index ($IIX +3.07%) climbed above its 50-day moving average (DMA) line today. Its recent highs define near-term chart resistance at a level that was an old support level back in June.
| Oil Services |
$OSX |
206.46 |
+9.20 |
+4.66% |
-15.77% |
| Healthcare |
$HMO |
1,924.72 |
+69.52 |
+3.75% |
+13.75% |
| Integrated Oil |
$XOI |
1,116.34 |
+47.70 |
+4.46% |
-7.98% |
| Semiconductor |
$SOX |
366.79 |
+10.06 |
+2.82% |
-10.93% |
| Networking |
$NWX |
231.20 |
+7.63 |
+3.41% |
-17.59% |
| Internet |
$IIX |
282.24 |
+8.41 |
+3.07% |
-8.28% |
| Broker/Dealer |
$XBD |
84.38 |
+3.84 |
+4.77% |
-30.56% |
| Retail |
$RLX |
526.60 |
+14.62 |
+2.86% |
+3.58% |
| Gold & Silver |
$XAU |
193.80 |
+6.36 |
+3.39% |
-14.47% |
| Bank |
$BKX |
37.45 |
+1.89 |
+5.31% |
-28.27% |
| Biotech |
$BTK |
1,133.78 |
+17.09 |
+1.53% |
-12.63% |
|
|
|
 |
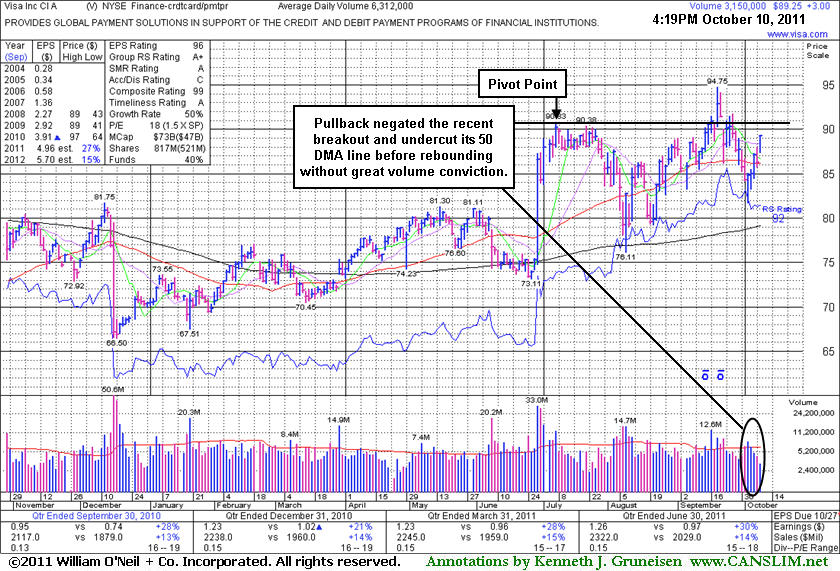
Volume Light Behind Rebound After Recently Failed Breakout
Kenneth J. Gruneisen - Passed the CAN SLIM® Master's Exam
Visa Inc (V +$3.00 or +3.48% to $89.25) has rebounded back above its 50-day moving average (DMA) line without great volume conviction behind its recent gains. The 50 DMA line recently began sloping downward after it stalled following its breakout to a new 52-week high. Its last appearance in this FSU section was on 9/21/11 with an annotated graph under the headline, "Leadership in Group Has Been a Reassuring Sign" as it pulled back with volume slightly above average. Damaging losses soon thereafter promptly negated the breakout as it sank back into its prior base and then violated its 50 DMA line triggering technical sell signals.
Visa was featured in yellow in the 9/20/11 mid-day report with a pivot point based on its 7/07/11 high plus 10 cents. That day's considerable closing gain for a new all-time high was ultimately backed by volume +54% above average. That technically triggered a buy signal by clearing an 11-week base during which it found impressive support near its longer-term 200 DMA line. Its quarterly and annual earnings history has been strong enough to satisfy the C and A criteria. The number of top-rated funds owning its shares rose from 1,878 in Dec '10 to 2,057 in Jun '11, a reassuring sign concerning the I criteria, however it is already well known by the institutional crowd. Leadership shown by at least one other well-known firm in the Finance - Credit Card Payment Processing firm (L criteria) has been a reassuring sign.
Disciplined investors always limit losses by selling if ever any stock falls -7% from their purchase price. Otherwise, if leaving the risk un-contained, the damage can become more severe and undisciplined investors must be prepared to suffer the painful consequences. Keep in mind that the M criteria tells us that typically 3 out of 4 stocks move in the same direction of the major averages, and until the new rally attempt produces a reassuring follow-through day of the outlook is questionable, hurting investors chances for landing great gains.
|
|
|
Color Codes Explained :
Y - Better candidates highlighted by our
staff of experts.
G - Previously featured
in past reports as yellow but may no longer be buyable under the
guidelines.
***Last / Change / Volume data in this table is the closing quote data***
Symbol/Exchange
Company Name
Industry Group |
PRICE |
CHANGE
(%Change) |
Day High |
Volume
(% DAV)
(% 50 day avg vol) |
52 Wk Hi
% From Hi |
Featured
Date |
Price
Featured |
Pivot Featured |
|
Max Buy |
AAPL
-
NASDAQ
Apple Inc
COMPUTER HARDWARE - Personal Computers
|
$388.81
|
+19.01
5.14% |
$388.81
|
15,732,406
67.17% of 50 DAV
50 DAV is 23,421,200
|
$422.86
-8.05%
|
9/16/2011
|
$399.14
|
PP = $404.60
|
|
MB = $424.83
|
 Most Recent Note - 10/10/2011 4:07:12 PM
G - Gain today with light volume helped it rebound above its 50 DMA line, helping its outlook. Damaging losses triggered a technical sell signal and it tested support at its longer-term 200 DMA line last week. See the latest FSU analysis for more details and a new annotated graph.
>>> The latest Featured Stock Update with an annotated graph appeared on 10/6/2011. Click here.
View all notes |
Alert me of new notes |
CANSLIM.net Company Profile |
SEC |
Zacks Reports |
StockTalk |
News |
Chart |
Request a new note
C
A N
S L
I M


|
ALXN
-
NASDAQ
Alexion Pharmaceuticals
DRUGS - Drug Manufacturers - Other
|
$67.88
|
+2.70
4.14% |
$68.16
|
966,659
57.24% of 50 DAV
50 DAV is 1,688,900
|
$68.50
-0.91%
|
9/15/2011
|
$63.20
|
PP = $60.81
|
|
MB = $63.85
|
Most Recent Note - 10/10/2011 4:08:33 PM
G - Gain today with light volume led to the best-ever close for this high-ranked Medical - Biomed/Biotech group leader. Support to watch includes prior resistance in the $59-60 area and its upwardly tilted 50 DMA line.
>>> The latest Featured Stock Update with an annotated graph appeared on 10/5/2011. Click here.
View all notes |
Alert me of new notes |
CANSLIM.net Company Profile |
SEC |
Zacks Reports |
StockTalk |
News |
Chart |
Request a new note
C
A N
S L
I M
|
CELG
-
NASDAQ
Celgene Corp
DRUGS - Drug Manufacturers - Major
|
$65.53
|
+2.58
4.10% |
$66.98
|
5,013,708
113.59% of 50 DAV
50 DAV is 4,414,000
|
$65.86
-0.50%
|
9/16/2011
|
$61.21
|
PP = $62.59
|
|
MB = $65.72
|
Most Recent Note - 10/10/2011 4:10:57 PM
G - Finished in the lower half of its intra-day range after a gap up and rally to a new 52-week high. Color code was changed to green after getting extended from its prior base.
>>> The latest Featured Stock Update with an annotated graph appeared on 10/4/2011. Click here.
View all notes |
Alert me of new notes |
CANSLIM.net Company Profile |
SEC |
Zacks Reports |
StockTalk |
News |
Chart |
Request a new note
C
A N
S L
I M
|
MG
-
NYSE
Mistras Group Inc
DIVERSIFIED SERVICES - Bulding and Faci;ity Management Services
|
$19.46
|
-0.14
-0.71% |
$20.69
|
441,417
200.28% of 50 DAV
50 DAV is 220,400
|
$21.18
-8.12%
|
8/10/2011
|
$17.89
|
PP = $17.58
|
|
MB = $18.46
|
Most Recent Note - 10/10/2011 4:13:04 PM
G - Gapped up today but late-afternoon pressure led to a negative reversal for a loss with volume nearly 2 times average. It recently tried to rise without great volume conviction from a 5-week consolidation that may be considered a "base-on-base" type pattern, however no new pivot point was cited. Additionally, the M criteria argues against new (or add-on) buying efforts in otherwise worthy buy candidates until the nascent new rally effort is confirmed by a solid follow-through day.
>>> The latest Featured Stock Update with an annotated graph appeared on 9/30/2011. Click here.
View all notes |
Alert me of new notes |
CANSLIM.net Company Profile |
SEC |
Zacks Reports |
StockTalk |
News |
Chart |
Request a new note
C
A N
S L
I M
|
V
-
NYSE
Visa Inc Cl A
DIVERSIFIED SERVICES - Business/Management Services
|
$89.25
|
+3.00
3.48% |
$89.29
|
3,330,494
52.76% of 50 DAV
50 DAV is 6,312,000
|
$94.75
-5.80%
|
9/20/2011
|
$93.91
|
PP = $90.93
|
|
MB = $95.48
|
Most Recent Note - 10/10/2011 4:38:46 PM
G - Rebounding above its 50 DMA line which recently began sloping downward. See the latest FSU analysis for more details and a new annotated graph.
>>> The latest Featured Stock Update with an annotated graph appeared on 10/10/2011. Click here.
View all notes |
Alert me of new notes |
CANSLIM.net Company Profile |
SEC |
Zacks Reports |
StockTalk |
News |
Chart |
Request a new note
C
A N
S L
I M
|
Symbol/Exchange
Company Name
Industry Group |
PRICE |
CHANGE
(%Change) |
Day High |
Volume
(% DAV)
(% 50 day avg vol) |
52 Wk Hi
% From Hi |
Featured
Date |
Price
Featured |
Pivot Featured |
|
Max Buy |
|
|
|
THESE ARE NOT BUY RECOMMENDATIONS!
Comments contained in the body of this report are technical
opinions only. The material herein has been obtained
from sources believed to be reliable and accurate, however,
its accuracy and completeness cannot be guaranteed.
This site is not an investment advisor, hence it does
not endorse or recommend any securities or other investments.
Any recommendation contained in this report may not
be suitable for all investors and it is not to be deemed
an offer or solicitation on our part with respect to
the purchase or sale of any securities. All trademarks,
service marks and trade names appearing in this report
are the property of their respective owners, and are
likewise used for identification purposes only.
This report is a service available
only to active Paid Premium Members.
You may opt-out of receiving report notifications
at any time. Questions or comments may be submitted
by writing to Premium Membership Services 665 S.E. 10 Street, Suite 201 Deerfield Beach, FL 33441-5634 or by calling 1-800-965-8307
or 954-785-1121.
|
|
|

