You are not logged in.
This means
you CAN ONLY VIEW reports that were published prior to Wednesday, April 9, 2025.
You
MUST UPGRADE YOUR MEMBERSHIP if you want to see any current reports.
 MIDDAY BREAKOUTS REPORT - TUESDAY, OCTOBER 11TH, 2011 MIDDAY BREAKOUTS REPORT - TUESDAY, OCTOBER 11TH, 2011
Previous Mid Day Report Next Mid Day Report >>>
|
|
DOW 11428.14 -5.04 (-0.04%) | NASDAQ 2583.09 17.04 (0.66%) | S&P 500 1196.5 1.61 (0.13%)
|
Time of Screening :
10/11/2011 12:09:29 PM Report Released :
10/11/2011 12:56:15 PM
Price is:
Above 52W High and Less Than 52W High
but within 15% of the 52 Week High
Volume Is:
At least 57.5% of 50 Day Average at
the time of the screening.
More details about this report...
At around
mid-way through each trading day we run
a screen against our database of
high-ranked stocks, searching for
possible buy candidates that are trading
at or near their 52-week high on above
average volume. The results of that
screen are split into the two sections
you see below. The first, titled
"TODAY's FEATURED STOCKS" shows stocks
that our experts have recently
identified as among the strongest candidates to
consider. Stocks highlighted in yellow
are the most timely and noteworthy, so
particular attention and prompt action
may be appropriate. The second section,
titled "TODAY's BREAKOUT SCREEN" shows
the remainder of stocks meeting today's
screen parameters. Our experts have
reviewed and included notes on these
stocks as well, but found that they may
not match up as favorably.
|
|
Y - Today's strongest
candidates
highlighted
by our staff
of experts.
|
|
G - Previously featured in
this report as yellow and
now may no longer be buyable
under the guidelines.
|
|
|
Symbol/Exchange
Company Name
Industry Group |
PRICE |
CHANGE
(%Change) |
Day High |
Volume
(% DAV)
(50 DAV) |
52 Wk Hi
% From Hi |
Date
Featured |
Price
Featured |
Pivot Point |
|
Max Buy |
MG
- NYSE
Mistras Group Inc
|
$19.93
|
+0.47
2.42%
|
$20.21
|
183,325
83.18% of 50 DAV
50 DAV is 220,400
|
$21.18
-5.90%
|
8/10/2011 |
$17.89
|
PP = $17.58
MB = $18.46 |
Most Recent Note - 10/11/2011 12:17:13 PM
G - Holding its ground after encountering distributional pressure. Recently tried to rise without great volume conviction from a 5-week consolidation that may be considered a "base-on-base" type pattern, however no new pivot point was cited. Additionally, the M criteria argues against new (or add-on) buying efforts in otherwise worthy buy candidates until the nascent new rally effort is confirmed by a solid follow-through day.
>>> The latest Featured Stock Update with an annotated graph appeared on 9/30/2011. Click here.
|
|
View all notes |
Alert me of new notes |
Company Profile |
SEC |
News |
Chart | C
A N
S L
I M
|
OPNT
-
|
$38.45
|
-2.06
-5.09%
|
$40.14
|
116,037
66.96% of 50 DAV
50 DAV is 173,300
|
$42.51
-9.55%
|
10/11/2011 |
$38.45
|
PP = $42.02
MB = $44.12 |
Most Recent Note - 10/11/2011
Y - Color code is changed to yellow with new pivot point cited based on its 6/30/11 high plus ten cents. Volume-driven gains above its pivot point may trigger a technical buy signal. It has rebounded after slumping below its 200 DMA line during its consolidation since dropped from the Featured Stocks list on 7/21/11.
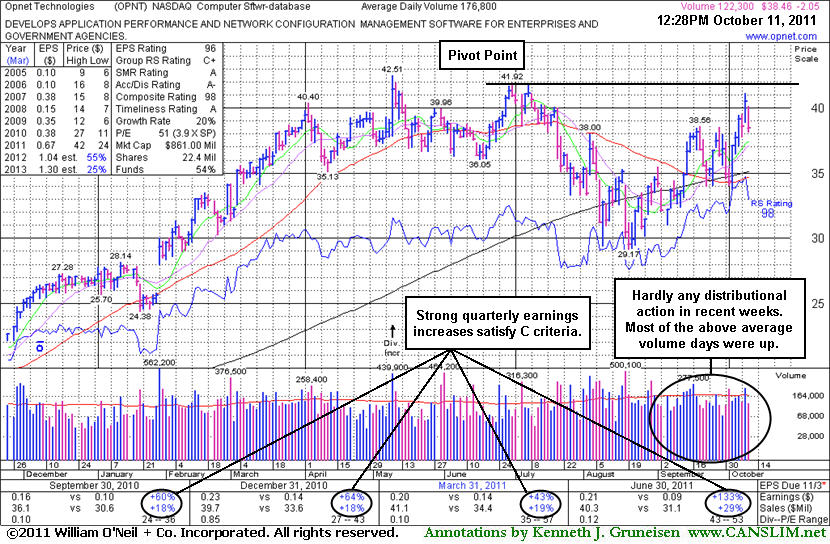
>>> The latest Featured Stock Update with an annotated graph appeared on 7/1/2011. Click here.
|
|
View all notes |
Alert me of new notes |
Company Profile |
SEC |
News |
Chart | C
A N
S L
I M
|
|
 |
Symbol - Exchange - Industry Group
Company Name |
Last |
Chg |
Day
High |
52 WK Hi |
% From Hi |
Volume
% DAV |
DAV |
FMX
- NYSE - FOOD & BEVERAGE - Beverages - Brewers
Fomento Econ Mex Sab Ads
|
$67.93 |
-0.38
-0.56%
|
$68.09
|
$73.84
|
-8.00% |
877,317
124.30%
|
705,800
|
Most Recent Note for FMX - 10/11/2011 12:14:39 PM
Hovering above its 50 DMA line today. Found support above 200 DMA line during consolidation since hitting its all-time high when noted in the 7/28/11 mid-day report - "Sales revenues and earnings growth has not been strong and steady. Its annual earnings history (A criteria) included a downturn in FY '08."
|
|
View all notes |
Alert me of new notes |
Company Profile |
SEC |
News |
Chart | C
A N
S L
I M
|
NUAN
- NASDAQ - COMPUTER SOFTWARE & SERVICES - Business Software & Services
Nuance Communications
|
$21.87 |
-0.25
-1.13%
|
$22.01
|
$22.93
|
-4.62% |
2,028,247
73.03%
|
2,777,200
|
Most Recent Note for NUAN - 10/11/2011 12:18:33 PM
Perched within striking distance of its 52-week high after recent volume-driven gains. Earnings history is below the guidelines of the fact-based system. It failed to make progress then badly slumped and violated its 50 and 200 DMA lines with damaging volume-driven losses since noted in the 5/17/11 mid-day report - "It survived but failed to impress since last noted when weak action prompted it to be dropped from the Featured Stocks list on 12/12/07."
|
|
View all notes |
Alert me of new notes |
Company Profile |
SEC |
News |
Chart | C
A N
S L
I M
|
SBH
- NYSE - SPECIALTY RETAIL - Specialty Retail, Other
Sally Beauty Holdings
|
$16.38 |
-1.17
-6.67%
|
$16.73
|
$18.62
|
-12.03% |
1,258,389
142.89%
|
880,700
|
Most Recent Note for SBH - 10/11/2011 12:42:53 PM
Gapped down today and slumped under its 50 DMA line toward recent lows and its 200 DMA line. Last noted in the 6/21/11 mid-day report - "Quarterly earnings growth has been strong but its sales revenues increases and annual earnings (A criteria) history in the past 3-5 years were not especially strong."
|
|
View all notes |
Alert me of new notes |
Company Profile |
SEC |
News |
Chart | C
A N
S L
I M
|
SIMO
- NASDAQ - ELECTRONICS - Semiconductor - Specialized
Silicon Motion Tech Ads
|
$14.19 |
+0.62
4.57%
|
$14.22
|
$14.45
|
-1.80% |
348,149
61.19%
|
569,000
|
Most Recent Note for SIMO - 10/11/2011 12:45:11 PM
Perched at its 52-week high after recent volume-driven gains. Reported earnings +233% on +59% sales revenues for the quarter ended June 30, 2011 versus the year ago period. It slumped near its 200 DMA line during a deep consolidation since noted in the 5/27/11 mid-day report - "Recent quarters showed much better sales and earnings increases versus the year earlier. Prior quarterly comparisons and annual earnings (A criteria) growth have not been strong and steady, so it is fundamentally below guidelines of the fact-based investment system. It survived but failed to impress since dropped from the Featured Stocks list on 7/26/07."
|
|
View all notes |
Alert me of new notes |
Company Profile |
SEC |
News |
Chart | C
A N
S L
I M
|
|
|
|
THESE ARE NOT BUY RECOMMENDATIONS!
Comments contained in the body of this report are technical
opinions only. The material herein has been obtained
from sources believed to be reliable and accurate, however,
its accuracy and completeness cannot be guaranteed.
We are not an investment advisor, hence it does
not endorse or recommend any securities or other investments.
Any recommendation contained in this report may not
be suitable for all investors and it is not to be deemed
an offer or solicitation on our part with respect to
the purchase or sale of any securities. All trademarks,
service marks and trade names appearing in this report
are the property of their respective owners, and are
likewise used for identification purposes only.
This report is a service available
only to active Paid Premium Members.
You may opt-out of receiving report notifications
at any time. Questions or comments may be submitted
by writing to FactBasedInvesting.com c/o Premium
Member Services 665 S.E. 10 Street, Suite 201
Deerfield Beach, FL 33441-5634 or by calling 954-785-1121.
We appreciate any feedback
members may wish to send via the inquiry form
here.
|
|
|


