You are not logged in.
This means you
CAN ONLY VIEW reports that were published prior to Wednesday, April 9, 2025.
You
MUST UPGRADE YOUR MEMBERSHIP if you want to see any current reports.
AFTER MARKET UPDATE - WEDNESDAY, OCTOBER 1ST, 2014
Previous After Market Report Next After Market Report >>>
|
|
|
|
DOW |
-238.19 |
16,804.71 |
-1.40% |
|
Volume |
845,787,480 |
-9% |
|
Volume |
2,137,833,330 |
+10% |
|
NASDAQ |
-71.30 |
4,422.09 |
-1.59% |
|
Advancers |
761 |
24% |
|
Advancers |
604 |
20% |
|
S&P 500 |
-26.13 |
1,946.16 |
-1.32% |
|
Decliners |
2,343 |
73% |
|
Decliners |
2,391 |
78% |
|
Russell 2000 |
-16.27 |
1,085.41 |
-1.48% |
|
52 Wk Highs |
21 |
|
|
52 Wk Highs |
15 |
|
|
S&P 600 |
-8.38 |
626.61 |
-1.32% |
|
52 Wk Lows |
257 |
|
|
52 Wk Lows |
248 |
|
|
 |
Damaging Losses Hurt Near-Term Market Outlook
Kenneth J. Gruneisen - Passed the CAN SLIM® Master's Exam
The major averages kicked off October by suffering damaging losses on Wednesday. The Dow Jones Industrial Average, S&P 500 Index, and Nasdaq Composite Index collectively slumped well below their respective 50-day moving average (DMA) lines. The volume totals were reported mixed, lighter than the prior session total on the NYSE, but higher on the Nasdaq exchange, a sign of more worrisome selling pressure coming from large institutional investors. Breadth was negative as decliners led advances by more than 3-1 on the NYSE and nearly 4-1 on the NASDAQ exchange. There were only 6 high-ranked companies from the CANSLIM.net Leaders List that made new 52-week highs and appeared on the CANSLIM.net BreakOuts Page, down from the prior session total of 17 stocks. The new 52-week lows list expanded again and solidly outnumbered new 52-week highs on the NYSE and on the Nasdaq exchange. There were losses for all 10 high-ranked companies currently included on the Featured Stocks Page. Distributional action raised concerns while leadership (stocks hitting new 52-week highs) waned and a deteriorating market (M criteria) environment was repeatedly noted in this commentary. Remember that the fact-based investment system prompts disciplined investors to reduce market exposure by selling any faltering stocks during rough market periods.
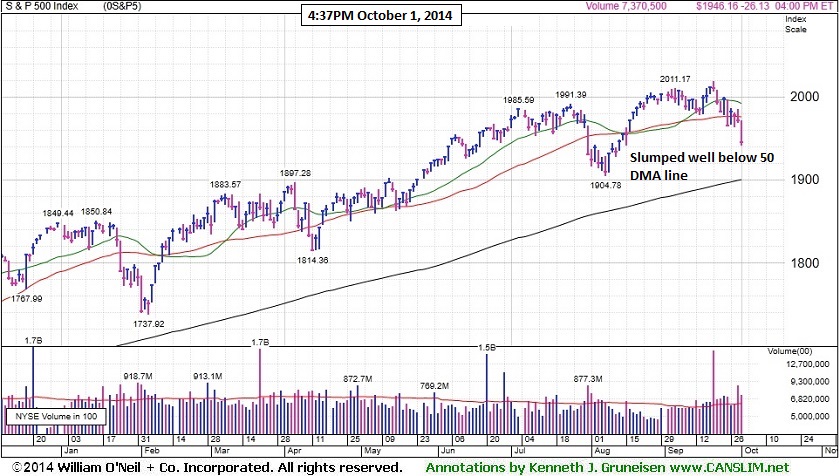
PICTURED: The S&P 500 Index fell 26 points to 1,946, slumping well below its 50-day moving average (DMA) line.
The NASDAQ dropped 71 points to 4,422 and the Dow declined 238 points to 16,804. Stocks finished lower for a third day amid a batch of mostly disappointing economic data. The ISM's manufacturing index dropped in in September from the highest level since early 2011 while euro zone factories expanded at the slowest pace in 14 months. A separate report showed construction spending fell by a more than anticipated 0.8% in August. On the upside, ADP reported companies added 213,000 workers to private payrolls in September, topping estimates for an increase of 205,000.
Nine of the 10 sectors in the S&P 500 retreated. Materials and industrials were the worst performing groups as Dow Chemical (DOW -3.8%) and General Electric (GE -1.8%) fell. Utilities advanced as investors sought out defensive issues, and Exelon (EXC +1.6%) posted a gain. Automakers were also in focus. The new General Motors Company (GM +1.7%) posted better-than-expected monthly sales figures , but Ford (F -1.3%) fell as it missed analyst estimates.
Treasuries staged a rally. The 10-year note rose 27/32 to yield 2.39%. The 30-year bond gained nearly two full points to yield 3.10%.
The CANSLIM.net Featured Stocks Page shows the most action-worthy candidates and their latest notes and a Headline Link directs members to the latest detailed analysis with data-packed graphs annotated by a Certified expert along with links to additional resources. The Premium Member Homepage includes "dynamic archives" to all prior pay reports published.
|
 Kenneth J. Gruneisen started out as a licensed stockbroker in August 1987, a couple of months prior to the historic stock market crash that took the Dow Jones Industrial Average down -22.6% in a single day. He has published daily fact-based fundamental and technical analysis on high-ranked stocks online for two decades. Through FACTBASEDINVESTING.COM, Kenneth provides educational articles, news, market commentary, and other information regarding proven investment systems that work in good times and bad.
Comments contained in the body of this report are technical opinions only and are not necessarily those of Gruneisen Growth Corp. The material herein has been obtained from sources believed to be reliable and accurate, however, its accuracy and completeness cannot be guaranteed. Our firm, employees, and customers may effect transactions, including transactions contrary to any recommendation herein, or have positions in the securities mentioned herein or options with respect thereto. Any recommendation contained in this report may not be suitable for all investors and it is not to be deemed an offer or solicitation on our part with respect to the purchase or sale of any securities. |
|
 |
Energy, Tech, Retail, and Financial Groups Fell
Kenneth J. Gruneisen - Passed the CAN SLIM® Master's Exam
The Oil Services Index ($OSX -2.52%) and Integrated Oil Index ($XOI -1.85%) both suffered large losses and led broad based declines on Wednesday. Financial shares were a negative influence on the major averages as the Broker/Dealer Index ($XBD -1.41%) and the Bank Index ($BKX -1.17%) fell. The tech sector saw unanimous losses from the Networking Index ($NWX -1.31%), Biotechnology Index ($BTK -1.27%), and the Semiconductor Index ($SOX -2.37%). The Gold & Silver Index ($XAU -0.12%) held its ground.
Charts courtesy www.stockcharts.com
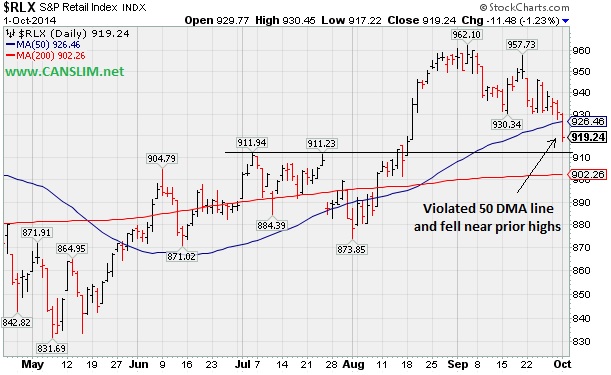
PICTURED: The Retail Index ($RLX -1.23%) violated its 50-day moving average (DMA) line with a damaging loss, sinking near its July highs.
| Oil Services |
$OSX |
259.68 |
-6.71 |
-2.52% |
-7.60% |
| Integrated Oil |
$XOI |
1,523.37 |
-28.66 |
-1.85% |
+1.35% |
| Semiconductor |
$SOX |
623.36 |
-15.12 |
-2.37% |
+16.51% |
| Networking |
$NWX |
317.59 |
-4.23 |
-1.31% |
-1.96% |
| Broker/Dealer |
$XBD |
166.12 |
-2.38 |
-1.41% |
+3.46% |
| Retail |
$RLX |
919.24 |
-11.48 |
-1.23% |
-2.19% |
| Gold & Silver |
$XAU |
81.01 |
-0.10 |
-0.12% |
-3.73% |
| Bank |
$BKX |
70.72 |
-0.84 |
-1.17% |
+2.11% |
| Biotech |
$BTK |
3,054.48 |
-39.14 |
-1.27% |
+31.07% |
|
|
|
 |
Fundamental and Technical Deterioration Raised Concerns
Kenneth J. Gruneisen - Passed the CAN SLIM® Master's Exam
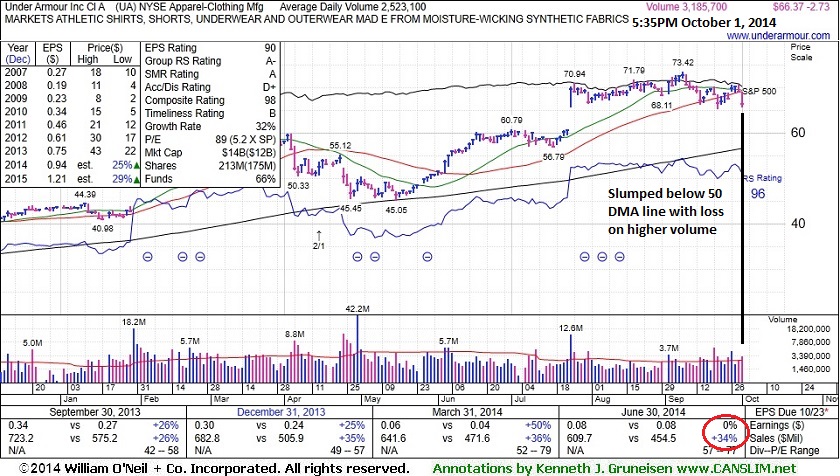
Under Armour Inc (UA -$2.73 or -3.95% to $66.37) sank well below its 50-day moving average (DMA) line with higher volume behind today's damaging loss triggering technical sell signals. Widespread market weakness (M criteria) has been raising concerns. Due to noted fundamental and technical deterioration it will be dropped from the Featured Stocks list tonight.
Keep in mind that, while retreating from its 52-week high, fundamental concerns were raised by earnings reported +0% on +34% sales revenues for the Jun '14 quarter, below the +25% minimum earnings guideline (C criteria). When UA was last shown in this FSU section on 9/15/14 with annotated graphs under the headline "Higher Volume Behind Loss Testing 50-Day Moving Average", members were cautioned - The fact-based investment system's rule prompts selling if any stock falls more than -7% from the purchase price. If market conditions deteriorate it could be extra motivation to limit losses in fundamentally faltering stocks even before a loss might reach the -7% threshold." Also previously noted - "Some concerns are raised by the fact that it made only limited headway following a considerable "breakaway gap" on 7/24/14 with more than 4 times average volume."
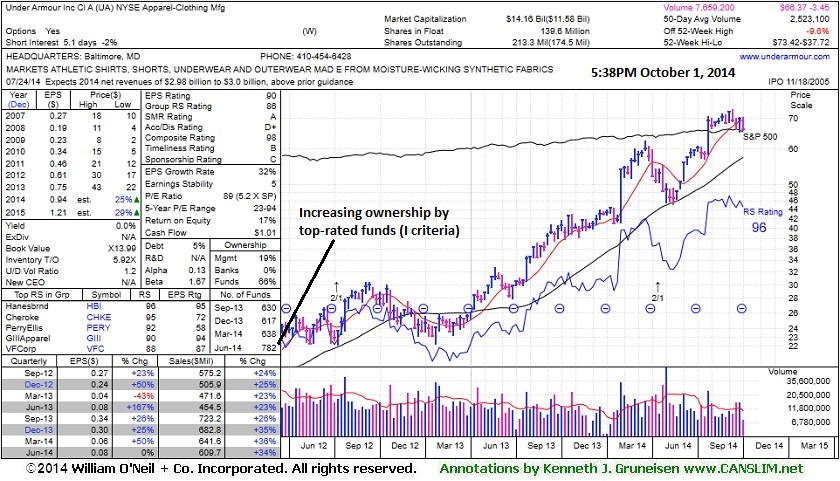
The high-ranked Apparel firm was highlighted in yellow with pivot point based on its 7/01/14 high in the 7/10/14 mid-day report (read here). Its annual earnings (A criteria) history has been strong. The number of top-rated funds owning its shares rose from 637 in Dec '13 to 782 in Jun '14, a reassuring trend concerning the I criteria.
|
|
|
Color Codes Explained :
Y - Better candidates highlighted by our
staff of experts.
G - Previously featured
in past reports as yellow but may no longer be buyable under the
guidelines.
***Last / Change / Volume data in this table is the closing quote data***
Symbol/Exchange
Company Name
Industry Group |
PRICE |
CHANGE
(%Change) |
Day High |
Volume
(% DAV)
(% 50 day avg vol) |
52 Wk Hi
% From Hi |
Featured
Date |
Price
Featured |
Pivot Featured |
|
Max Buy |
ACT
-
NYSE
Actavis plc
Medical-Generic Drugs
|
$238.48
|
-2.80
-1.16% |
$242.50
|
2,044,818
89.45% of 50 DAV
50 DAV is 2,286,000
|
$249.94
-4.59%
|
6/20/2014
|
$216.53
|
PP = $230.87
|
|
MB = $242.41
|
 Most Recent Note - 10/1/2014 1:36:53 PM
Y - Quietly consolidating below its "max buy" level and its color code is changed to yellow. Prior highs near $230 define near-term support to watch on pullbacks.
>>> FEATURED STOCK ARTICLE : Finally Volume-backed Gains Confirmed a Technical Buy Signal - 9/19/2014
View all notes |
Set NEW NOTE alert |
CANSLIM.net Company Profile |
SEC
News |
Chart |
Request a new note
C
A N
S L
I M


|
BITA
-
NYSE
Bitauto Hldgs Ltd Ads
Internet-Content
|
$73.49
|
-4.51
-5.78% |
$77.98
|
1,891,879
107.62% of 50 DAV
50 DAV is 1,758,000
|
$98.28
-25.22%
|
6/26/2014
|
$46.20
|
PP = $47.03
|
|
MB = $49.38
|
Most Recent Note - 10/1/2014 2:00:33 PM
G - Violating its 50 DMA line with today's big loss amid widespread market (M criteria) weakness which is prompting concerns and triggering technical sell signals.
>>> FEATURED STOCK ARTICLE : Volume Totals Recently Cooling After Halting Slide - 9/18/2014
View all notes |
Set NEW NOTE alert |
CANSLIM.net Company Profile |
SEC
News |
Chart |
Request a new note
C
A N
S L
I M
|
FB
-
NASDAQ
Facebook Inc Cl A
INTERNET
|
$76.55
|
-2.49
-3.15% |
$78.82
|
54,953,979
155.70% of 50 DAV
50 DAV is 35,294,000
|
$79.71
-3.96%
|
9/9/2014
|
$76.67
|
PP = $76.84
|
|
MB = $80.68
|
Most Recent Note - 10/1/2014 1:53:21 PM
Y - Pulling back with higher volume today after wedging higher with gains lacking great volume conviction. Its 50 DMA line ($75.41) defines important near term support where a violation would trigger a technical sell signal
>>> FEATURED STOCK ARTICLE : Fell Toward 50-day Moving Average; Recent Gains Lacked Great Volume - 9/25/2014
View all notes |
Set NEW NOTE alert |
CANSLIM.net Company Profile |
SEC
News |
Chart |
Request a new note
C
A N
S L
I M
|
NVGS
-
NYSE
Navigator Holdings Ltd
Transportation-Ship
|
$27.14
|
-0.69
-2.48% |
$27.70
|
290,196
112.04% of 50 DAV
50 DAV is 259,000
|
$31.90
-14.92%
|
9/16/2014
|
$30.33
|
PP = $30.56
|
|
MB = $32.09
|
Most Recent Note - 10/1/2014 1:54:53 PM
G - Down again today with yet another damaging volume-driven loss, slumping toward its 200 DMA line. Prior losses triggered a technical sell signal. A rebound above its 50 DMA line is needed to help its outlook improve.
>>> FEATURED STOCK ARTICLE : Finished Strong While Challenging Pivot Point and Recent Highs - 9/16/2014
View all notes |
Set NEW NOTE alert |
CANSLIM.net Company Profile |
SEC
News |
Chart |
Request a new note
C
A N
S L
I M
|
NXPI
-
NASDAQ
Nxp Semiconductors N V
ELECTRONICS - Semiconductor - Broad Line
|
$66.01
|
-2.42
-3.54% |
$68.46
|
5,089,421
147.56% of 50 DAV
50 DAV is 3,449,000
|
$73.82
-10.58%
|
8/29/2014
|
$68.50
|
PP = $67.89
|
|
MB = $71.28
|
Most Recent Note - 10/1/2014 1:49:56 PM
Y- Slumping near its 50 DMA line and prior highs in the $67 area defining important support with today's 3rd consecutive loss on ever-increasing volume. Weakening market conditions (M criteria) are prompting investors to reduce exposure in any faltering stocks and avoid new buying efforts until strength returns.
>>> FEATURED STOCK ARTICLE : Consolidating Above Pivot Point and Below "Max Buy" Level - 9/17/2014
View all notes |
Set NEW NOTE alert |
CANSLIM.net Company Profile |
SEC
News |
Chart |
Request a new note
C
A N
S L
I M
|
Symbol/Exchange
Company Name
Industry Group |
PRICE |
CHANGE
(%Change) |
Day High |
Volume
(% DAV)
(% 50 day avg vol) |
52 Wk Hi
% From Hi |
Featured
Date |
Price
Featured |
Pivot Featured |
|
Max Buy |
PANW
-
NYSE
Palo Alto Networks
Computer Sftwr-Security
|
$95.39
|
-2.71
-2.76% |
$97.79
|
2,513,208
150.04% of 50 DAV
50 DAV is 1,675,000
|
$102.45
-6.89%
|
7/30/2014
|
$84.21
|
PP = $85.88
|
|
MB = $90.17
|
Most Recent Note - 10/1/2014 1:40:21 PM
G - Pulling back with higher volume today amid widespread market (M criteria) weakness which is prompting concern. Prior highs in the $87 area define initial support to watch above its 50 DMA line ($88.54).
>>> FEATURED STOCK ARTICLE : Holding Ground Near Highs After Big Volume-Driven Gains - 9/24/2014
View all notes |
Set NEW NOTE alert |
CANSLIM.net Company Profile |
SEC
News |
Chart |
Request a new note
C
A N
S L
I M
|
STRT
-
NASDAQ
Strattec Security Corp
AUTOMOTIVE - Auto Parts
|
$81.33
|
-0.02
-0.02% |
$83.20
|
21,697
94.33% of 50 DAV
50 DAV is 23,000
|
$89.87
-9.51%
|
9/19/2014
|
$86.06
|
PP = $89.97
|
|
MB = $94.47
|
Most Recent Note - 10/1/2014 2:05:31 PM
Y - Still quietly consolidating, however eroding market conditions (M criteria) have raised concerns. Previously noted - "Volume-driven gains above the new pivot point cited may trigger a new (or add-on) technical buy signal. Its 50 DMA line and prior highs define important support to watch on pullbacks."
>>> FEATURED STOCK ARTICLE : Consolidating Above Prior Highs and 50-Day Moving Average Line - 9/26/2014
View all notes |
Set NEW NOTE alert |
CANSLIM.net Company Profile |
SEC
News |
Chart |
Request a new note
C
A N
S L
I M
|
TARO
-
NYSE
Taro Pharmaceutical Inds
DRUGS - Drug Manufacturers - Other
|
$149.91
|
-3.95
-2.57% |
$153.19
|
75,722
81.42% of 50 DAV
50 DAV is 93,000
|
$165.30
-9.31%
|
7/30/2014
|
$144.24
|
PP = $149.99
|
|
MB = $157.49
|
Most Recent Note - 10/1/2014 1:58:15 PM
G - Violating its 50 DMA line and undercutting prior lows with today's 3rd consecutive loss raising concerns and triggering a technical sell signal. Repeatedly noted with caution - "Recently reported earnings for the Jun '14 quarter below the +25% minimum earnings guideline (C criteria) raising fundamental concerns."
>>> FEATURED STOCK ARTICLE : Consolidating Above 50-day Moving Average and Prior Highs - 9/23/2014
View all notes |
Set NEW NOTE alert |
CANSLIM.net Company Profile |
SEC
News |
Chart |
Request a new note
C
A N
S L
I M
|
TRN
-
NYSE
Trinity Industries Inc
TRANSPORTATION - Railroads
|
$43.12
|
-3.60
-7.71% |
$46.67
|
11,282,738
425.12% of 50 DAV
50 DAV is 2,654,000
|
$50.77
-15.07%
|
4/30/2014
|
$37.79
|
PP = $38.03
|
|
MB = $39.93
|
Most Recent Note - 10/1/2014 11:59:29 AM
G - Violated prior highs in the $46-47 area and sank below its 50 DMA line with a damaging volume-driven loss today raising concerns and triggering a technical sell signal.
>>> FEATURED STOCK ARTICLE : Consolidating Above 50-Day Moving Average Line - 9/12/2014
View all notes |
Set NEW NOTE alert |
CANSLIM.net Company Profile |
SEC
News |
Chart |
Request a new note
C
A N
S L
I M
|
UA
-
NYSE
Under Armour Inc Cl A
CONSUMER NON-DURABLES - Textile - Apparel Clothing
|
$66.37
|
-2.73
-3.95% |
$69.01
|
3,185,729
126.27% of 50 DAV
50 DAV is 2,523,000
|
$73.42
-9.60%
|
7/10/2014
|
$58.50
|
PP = $60.79
|
|
MB = $63.83
|
Most Recent Note - 10/1/2014 2:03:18 PM
Slicing below its 50 DMA line with today's damaging loss amid widespread market weakness (M criteria) raising concerns and triggering technical sell signals. Due to noted fundamental and technical deterioration it will be dropped from the Featured Stocks list tonight.
>>> FEATURED STOCK ARTICLE : Fundamental and Technical Deterioration Raised Concerns - 10/1/2014
View all notes |
Set NEW NOTE alert |
CANSLIM.net Company Profile |
SEC
News |
Chart |
Request a new note
C
A N
S L
I M
|
Symbol/Exchange
Company Name
Industry Group |
PRICE |
CHANGE
(%Change) |
Day High |
Volume
(% DAV)
(% 50 day avg vol) |
52 Wk Hi
% From Hi |
Featured
Date |
Price
Featured |
Pivot Featured |
|
Max Buy |
|
|
|
THESE ARE NOT BUY RECOMMENDATIONS!
Comments contained in the body of this report are technical
opinions only. The material herein has been obtained
from sources believed to be reliable and accurate, however,
its accuracy and completeness cannot be guaranteed.
This site is not an investment advisor, hence it does
not endorse or recommend any securities or other investments.
Any recommendation contained in this report may not
be suitable for all investors and it is not to be deemed
an offer or solicitation on our part with respect to
the purchase or sale of any securities. All trademarks,
service marks and trade names appearing in this report
are the property of their respective owners, and are
likewise used for identification purposes only.
This report is a service available
only to active Paid Premium Members.
You may opt-out of receiving report notifications
at any time. Questions or comments may be submitted
by writing to Premium Membership Services 665 S.E. 10 Street, Suite 201 Deerfield Beach, FL 33441-5634 or by calling 1-800-965-8307
or 954-785-1121.
|
|
|

