You are not logged in.
This means you
CAN ONLY VIEW reports that were published prior to Wednesday, April 9, 2025.
You
MUST UPGRADE YOUR MEMBERSHIP if you want to see any current reports.
AFTER MARKET UPDATE - TUESDAY, SEPTEMBER 30TH, 2014
Previous After Market Report Next After Market Report >>>
|
|
|
|
DOW |
-28.32 |
17,042.90 |
-0.17% |
|
Volume |
926,980,750 |
+45% |
|
Volume |
1,946,145,410 |
+21% |
|
NASDAQ |
-12.46 |
4,493.39 |
-0.28% |
|
Advancers |
1,146 |
36% |
|
Advancers |
839 |
30% |
|
S&P 500 |
-5.51 |
1,972.29 |
-0.28% |
|
Decliners |
1,946 |
61% |
|
Decliners |
1,890 |
67% |
|
Russell 2000 |
-16.23 |
1,101.68 |
-1.45% |
|
52 Wk Highs |
42 |
|
|
52 Wk Highs |
45 |
|
|
S&P 600 |
-8.12 |
634.99 |
-1.26% |
|
52 Wk Lows |
194 |
|
|
52 Wk Lows |
147 |
|
|
 |
Major Averages Fell With Higher Volume Totals
Kenneth J. Gruneisen - Passed the CAN SLIM® Master's Exam
The major finished modestly lower on Tuesday. Despite the decline, the major averages were higher for the third-quarter. The Dow rose +1.3%, the S&P 500 gained +0.6% and the NASDAQ climbed +1.9%. The S&P 500 Index and Nasdaq Composite Index both slumped and closed below their respective 50-day moving average (DMA) lines. The volume totals were reported higher than the prior session totals on the NYSE and on the Nasdaq exchange, a sign of selling pressure from large institutional investors. Breadth was negative as decliners led advances by nearly 2-1 on the NYSE and more than 2-1 on the NASDAQ exchange. There were 17 high-ranked companies from the CANSLIM.net Leaders List that made new 52-week highs and appeared on the CANSLIM.net BreakOuts Page, up from the prior session total of 14 stocks. New 52-week lows expanded and outnumbered new 52-week highs on the NYSE and on the Nasdaq exchange. There were gains for 2 of the 10 high-ranked companies currently included on the Featured Stocks Page. Distributional action raised concerns while leadership (stocks hitting new 52-week highs) waned and a deteriorating market (M criteria) environment was noted last week. Remember that the fact-based investment system prompts disciplined investors to reduce market exposure by selling any faltering stocks during rough market periods.
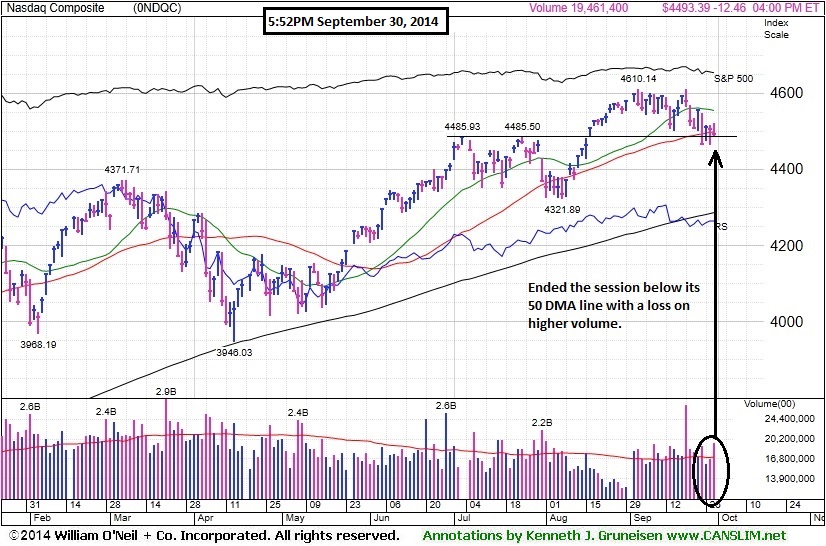
PICTURED: The NASDAQ declined 12 points to 4,493, finishing the session below its 50-day moving average (DMA) line (4,498).
The Dow was down 28 points to 17,042. The S&P 500 fell 6 points to 1,972. The major averages experienced a choppy trading session on the final trading day of the third-quarter following a round of disappointing economic data. An index of home prices for the 20 largest U.S. cities rose 6.75% in July, below a projected 7.4% increase. Consumer confidence declined to a four-year low in September while a gauge of Midwest manufacturing showed the pace of expansion slowed this month.
Seven of 10 sectors in the S&P 500 were down on the session. Energy was the worst performing group. Chevron (CVX -1%) edged lower as the price of crude oil retreated. Telecom was the best performing group with Verizon (VZ +0.5%) inching higher. eBay (EBAY +7.5%) was a notable gainer, up after the company announced plans to spin-off its PayPal unit next year.
Treasuries were down with the 10-year note off 7/32 to yield 2.51%. In commodities, WTI crude oil dropped 3.2% to $91.52 a barrel on the NYMEX. COMEX gold was down 0.6% to $1,210.50 an ounce.
The CANSLIM.net Featured Stocks Page shows the most action-worthy candidates and their latest notes and a Headline Link directs members to the latest detailed analysis with data-packed graphs annotated by a Certified expert along with links to additional resources. The Premium Member Homepage includes "dynamic archives" to all prior pay reports published.
|
 Kenneth J. Gruneisen started out as a licensed stockbroker in August 1987, a couple of months prior to the historic stock market crash that took the Dow Jones Industrial Average down -22.6% in a single day. He has published daily fact-based fundamental and technical analysis on high-ranked stocks online for two decades. Through FACTBASEDINVESTING.COM, Kenneth provides educational articles, news, market commentary, and other information regarding proven investment systems that work in good times and bad.
Comments contained in the body of this report are technical opinions only and are not necessarily those of Gruneisen Growth Corp. The material herein has been obtained from sources believed to be reliable and accurate, however, its accuracy and completeness cannot be guaranteed. Our firm, employees, and customers may effect transactions, including transactions contrary to any recommendation herein, or have positions in the securities mentioned herein or options with respect thereto. Any recommendation contained in this report may not be suitable for all investors and it is not to be deemed an offer or solicitation on our part with respect to the purchase or sale of any securities. |
|
 |
Commodity-Linked Groups, Tech, Retail, and Financial Groups Ended Lower
Kenneth J. Gruneisen - Passed the CAN SLIM® Master's Exam
The Retail Index ($RLX -0.49%) fell and financial shares were negative influences on the major averages as the Broker/Dealer Index ($XBD -0.46%) and the Bank Index ($BKX -0.25%) both edged lower. Commodity-linked groups fell and the Gold & Silver Index ($XAU -2.10%) was a standout decliner while the Oil Services Index ($OSX -1.49%) and the Integrated Oil Index ($XOI -1.17%) also lost ground. The tech sector had a negative bias as the Biotechnology Index ($BTK -1.28%), Networking Index ($NWX -0.94%), and the Semiconductor Index ($SOX -0.89%) ended unanimously lower.
Charts courtesy www.stockcharts.com
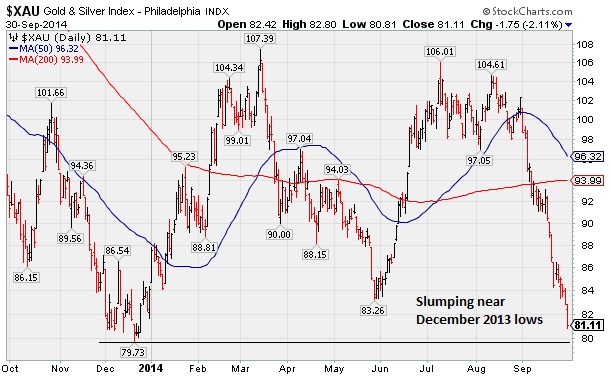
PICTURED: The Gold & Silver Index ($XAU -2.10%) is slumping near its 2013 lows.
| Oil Services |
$OSX |
266.39 |
-4.04 |
-1.49% |
-5.21% |
| Integrated Oil |
$XOI |
1,552.04 |
-18.42 |
-1.17% |
+3.25% |
| Semiconductor |
$SOX |
638.48 |
-5.75 |
-0.89% |
+19.34% |
| Networking |
$NWX |
321.82 |
-3.06 |
-0.94% |
-0.65% |
| Broker/Dealer |
$XBD |
168.50 |
-0.79 |
-0.46% |
+4.94% |
| Retail |
$RLX |
930.72 |
-4.61 |
-0.49% |
-0.97% |
| Gold & Silver |
$XAU |
81.11 |
-1.74 |
-2.10% |
-3.61% |
| Bank |
$BKX |
71.56 |
-0.18 |
-0.25% |
+3.32% |
| Biotech |
$BTK |
3,093.62 |
-40.06 |
-1.28% |
+32.75% |
|
|
|
 |
Submit Your Request for a Featured Stock Update
Kenneth J. Gruneisen - Passed the CAN SLIM® Master's Exam
There are few stocks currently included on the Featured Stocks list and none of the companies need additional review in detail with annotated graphs. At times like these we have an opportunity to look back and review previously featured stocks which were dropped. This can serve as an educational review of the investment system's tactics and a reminder that even high-ranked leaders eventually fall out of favor. If you wish to request for a specific stock to receive more detailed coverage in this section please use the inquiry form to submit your request. Thank you! |
|
|
Color Codes Explained :
Y - Better candidates highlighted by our
staff of experts.
G - Previously featured
in past reports as yellow but may no longer be buyable under the
guidelines.
***Last / Change / Volume data in this table is the closing quote data***
Symbol/Exchange
Company Name
Industry Group |
PRICE |
CHANGE
(%Change) |
Day High |
Volume
(% DAV)
(% 50 day avg vol) |
52 Wk Hi
% From Hi |
Featured
Date |
Price
Featured |
Pivot Featured |
|
Max Buy |
ACT
-
NYSE
Actavis plc
Medical-Generic Drugs
|
$241.28
|
-3.11
-1.27% |
$244.53
|
1,666,243
73.05% of 50 DAV
50 DAV is 2,281,000
|
$249.94
-3.46%
|
6/20/2014
|
$216.53
|
PP = $230.87
|
|
MB = $242.41
|
Most Recent Note - 9/24/2014 5:28:51 PM
G - Finished at a best-ever close well above its "max buy" level and its color code is changed to green. Prior highs near $230 define near-term support to watch on pullbacks.
>>> FEATURED STOCK ARTICLE : Finally Volume-backed Gains Confirmed a Technical Buy Signal - 9/19/2014
View all notes |
Set NEW NOTE alert |
CANSLIM.net Company Profile |
SEC
News |
Chart |
Request a new note
C
A N
S L
I M


|
BITA
-
NYSE
Bitauto Hldgs Ltd Ads
Internet-Content
|
$78.00
|
+0.14
0.18% |
$82.96
|
1,703,639
98.02% of 50 DAV
50 DAV is 1,738,000
|
$98.28
-20.63%
|
6/26/2014
|
$46.20
|
PP = $47.03
|
|
MB = $49.38
|
Most Recent Note - 9/26/2014 6:57:44 PM
G - Rose today with light volume, halting its slide at its 50 DMA line ($74.72). A violation would raise concerns and trigger a technical sell signal. Noted repeatedly with caution - "Has the look of a 'climax run' with volume-driven gains getting very extended from its prior base."
>>> FEATURED STOCK ARTICLE : Volume Totals Recently Cooling After Halting Slide - 9/18/2014
View all notes |
Set NEW NOTE alert |
CANSLIM.net Company Profile |
SEC
News |
Chart |
Request a new note
C
A N
S L
I M
|
FB
-
NASDAQ
Facebook Inc Cl A
INTERNET
|
$79.04
|
+0.04
0.05% |
$79.71
|
35,811,790
100.69% of 50 DAV
50 DAV is 35,567,000
|
$79.20
-0.20%
|
9/9/2014
|
$76.67
|
PP = $76.84
|
|
MB = $80.68
|
Most Recent Note - 9/25/2014 6:09:18 PM
Y - Reversed into the red for a loss on near average volume after touching a new high. Its 50 DMA line ($74.60) defines important near term support. See the latest FSU analysis for more details and new annotated graphs.
>>> FEATURED STOCK ARTICLE : Fell Toward 50-day Moving Average; Recent Gains Lacked Great Volume - 9/25/2014
View all notes |
Set NEW NOTE alert |
CANSLIM.net Company Profile |
SEC
News |
Chart |
Request a new note
C
A N
S L
I M
|
NVGS
-
NYSE
Navigator Holdings Ltd
Transportation-Ship
|
$27.83
|
-0.76
-2.66% |
$28.80
|
721,062
288.42% of 50 DAV
50 DAV is 250,000
|
$31.90
-12.76%
|
9/16/2014
|
$30.33
|
PP = $30.56
|
|
MB = $32.09
|
 Most Recent Note - 9/30/2014 6:28:46 PM
G - Down again today with another damaging volume-driven loss, slumping toward its 200 DMA line. Prior losses triggered a technical sell signal. Only a rebound above its 50 DMA line would help its outlook improve.
>>> FEATURED STOCK ARTICLE : Finished Strong While Challenging Pivot Point and Recent Highs - 9/16/2014
View all notes |
Set NEW NOTE alert |
CANSLIM.net Company Profile |
SEC
News |
Chart |
Request a new note
C
A N
S L
I M
|
NXPI
-
NASDAQ
Nxp Semiconductors N V
ELECTRONICS - Semiconductor - Broad Line
|
$68.43
|
-1.85
-2.63% |
$70.28
|
3,848,207
112.69% of 50 DAV
50 DAV is 3,415,000
|
$73.82
-7.30%
|
8/29/2014
|
$68.50
|
PP = $67.89
|
|
MB = $71.28
|
Most Recent Note - 9/25/2014 6:13:35 PM
Y- Color code is changed to yellow after dipping below its "max buy" level. Weakening market conditions (M criteria) are prompting investors to reduce exposure in any faltering stocks and avoid new buying efforts until strength returns. Prior highs in the $67 area define initial support to watch on pullbacks.
>>> FEATURED STOCK ARTICLE : Consolidating Above Pivot Point and Below "Max Buy" Level - 9/17/2014
View all notes |
Set NEW NOTE alert |
CANSLIM.net Company Profile |
SEC
News |
Chart |
Request a new note
C
A N
S L
I M
|
Symbol/Exchange
Company Name
Industry Group |
PRICE |
CHANGE
(%Change) |
Day High |
Volume
(% DAV)
(% 50 day avg vol) |
52 Wk Hi
% From Hi |
Featured
Date |
Price
Featured |
Pivot Featured |
|
Max Buy |
PANW
-
NYSE
Palo Alto Networks
Computer Sftwr-Security
|
$98.10
|
-1.18
-1.19% |
$100.93
|
1,648,186
99.23% of 50 DAV
50 DAV is 1,661,000
|
$102.45
-4.25%
|
7/30/2014
|
$84.21
|
PP = $85.88
|
|
MB = $90.17
|
Most Recent Note - 9/24/2014 5:31:05 PM
G - Holding its ground near all-time highs with volume totals cooling. Prior highs in the $87 area define initial support to watch above its 50 DMA line ($86.74). Disciplined investors avoid chasing extended stocks. See the latest FSU analysis for more details and new annotated graphs.
>>> FEATURED STOCK ARTICLE : Holding Ground Near Highs After Big Volume-Driven Gains - 9/24/2014
View all notes |
Set NEW NOTE alert |
CANSLIM.net Company Profile |
SEC
News |
Chart |
Request a new note
C
A N
S L
I M
|
STRT
-
NASDAQ
Strattec Security Corp
AUTOMOTIVE - Auto Parts
|
$81.35
|
-0.27
-0.33% |
$84.11
|
20,885
90.80% of 50 DAV
50 DAV is 23,000
|
$89.87
-9.48%
|
9/19/2014
|
$86.06
|
PP = $89.97
|
|
MB = $94.47
|
Most Recent Note - 9/26/2014 6:55:39 PM
Y - Subsequent volume-driven gains above the new pivot point cited may trigger a new (or add-on) technical buy signal. Its 50 DMA line and prior highs define important support to watch on pullbacks. See the latest FSU analysis for more details and new annotated graphs.
>>> FEATURED STOCK ARTICLE : Consolidating Above Prior Highs and 50-Day Moving Average Line - 9/26/2014
View all notes |
Set NEW NOTE alert |
CANSLIM.net Company Profile |
SEC
News |
Chart |
Request a new note
C
A N
S L
I M
|
TARO
-
NYSE
Taro Pharmaceutical Inds
DRUGS - Drug Manufacturers - Other
|
$153.86
|
-0.90
-0.58% |
$156.75
|
81,896
89.02% of 50 DAV
50 DAV is 92,000
|
$165.30
-6.92%
|
7/30/2014
|
$144.24
|
PP = $149.99
|
|
MB = $157.49
|
Most Recent Note - 9/29/2014 12:34:28 PM
G - Found support last week while consolidating above its 50 DMA line. Repeatedly noted with caution - "Recently reported earnings for the Jun '14 quarter below the +25% minimum earnings guideline (C criteria) raising fundamental concerns."
>>> FEATURED STOCK ARTICLE : Consolidating Above 50-day Moving Average and Prior Highs - 9/23/2014
View all notes |
Set NEW NOTE alert |
CANSLIM.net Company Profile |
SEC
News |
Chart |
Request a new note
C
A N
S L
I M
|
TRN
-
NYSE
Trinity Industries Inc
TRANSPORTATION - Railroads
|
$46.72
|
-0.59
-1.25% |
$47.63
|
2,163,161
81.05% of 50 DAV
50 DAV is 2,669,000
|
$50.77
-7.98%
|
4/30/2014
|
$37.79
|
PP = $38.03
|
|
MB = $39.93
|
Most Recent Note - 9/29/2014 6:13:39 PM
G - It has not formed a sound base. Endured distributional pressure while recently consolidating near prior highs in the $46-47 area and above its 50 DMA line. More damaging losses would raise greater concerns.
>>> FEATURED STOCK ARTICLE : Consolidating Above 50-Day Moving Average Line - 9/12/2014
View all notes |
Set NEW NOTE alert |
CANSLIM.net Company Profile |
SEC
News |
Chart |
Request a new note
C
A N
S L
I M
|
UA
-
NYSE
Under Armour Inc Cl A
CONSUMER NON-DURABLES - Textile - Apparel Clothing
|
$69.10
|
-1.02
-1.45% |
$70.50
|
2,505,353
99.78% of 50 DAV
50 DAV is 2,511,000
|
$73.42
-5.88%
|
7/10/2014
|
$58.50
|
PP = $60.79
|
|
MB = $63.83
|
Most Recent Note - 9/26/2014 12:35:07 PM
G - Consolidating above its 50 DMA line within striking distance of its 52-week high. Prior notes cautioned members - "Fundamental concerns were raised by earnings reported +0% on +34% sales revenues for the Jun '14 quarter, below the +25% minimum earnings guideline (C criteria)."
>>> FEATURED STOCK ARTICLE : Higher Volume Behind Loss Testing 50-Day Moving Average - 9/15/2014
View all notes |
Set NEW NOTE alert |
CANSLIM.net Company Profile |
SEC
News |
Chart |
Request a new note
C
A N
S L
I M
|
Symbol/Exchange
Company Name
Industry Group |
PRICE |
CHANGE
(%Change) |
Day High |
Volume
(% DAV)
(% 50 day avg vol) |
52 Wk Hi
% From Hi |
Featured
Date |
Price
Featured |
Pivot Featured |
|
Max Buy |
|
|
|
THESE ARE NOT BUY RECOMMENDATIONS!
Comments contained in the body of this report are technical
opinions only. The material herein has been obtained
from sources believed to be reliable and accurate, however,
its accuracy and completeness cannot be guaranteed.
This site is not an investment advisor, hence it does
not endorse or recommend any securities or other investments.
Any recommendation contained in this report may not
be suitable for all investors and it is not to be deemed
an offer or solicitation on our part with respect to
the purchase or sale of any securities. All trademarks,
service marks and trade names appearing in this report
are the property of their respective owners, and are
likewise used for identification purposes only.
This report is a service available
only to active Paid Premium Members.
You may opt-out of receiving report notifications
at any time. Questions or comments may be submitted
by writing to Premium Membership Services 665 S.E. 10 Street, Suite 201 Deerfield Beach, FL 33441-5634 or by calling 1-800-965-8307
or 954-785-1121.
|
|
|

