You are not logged in.
This means you
CAN ONLY VIEW reports that were published prior to Wednesday, April 9, 2025.
You
MUST UPGRADE YOUR MEMBERSHIP if you want to see any current reports.
AFTER MARKET UPDATE - THURSDAY, OCTOBER 2ND, 2014
Previous After Market Report Next After Market Report >>>
|
|
|
|
DOW |
-3.66 |
16,801.05 |
-0.02% |
|
Volume |
781,488,420 |
-8% |
|
Volume |
2,011,056,330 |
-6% |
|
NASDAQ |
+8.10 |
4,430.19 |
+0.18% |
|
Advancers |
1,659 |
52% |
|
Advancers |
1,780 |
61% |
|
S&P 500 |
+0.01 |
1,946.17 |
+0.00% |
|
Decliners |
1,439 |
45% |
|
Decliners |
1,064 |
36% |
|
Russell 2000 |
+10.97 |
1,096.38 |
+1.01% |
|
52 Wk Highs |
15 |
|
|
52 Wk Highs |
24 |
|
|
S&P 600 |
+5.48 |
632.09 |
+0.87% |
|
52 Wk Lows |
260 |
|
|
52 Wk Lows |
183 |
|
|
 |
Major Averages Rebounded From Deeper Losses
Kenneth J. Gruneisen - Passed the CAN SLIM® Master's Exam
The major averages reversed course and erased large losses to finish Thursday's session nearly unchanged. Still, the Dow Jones Industrial Average, S&P 500 Index, and Nasdaq Composite Index remain well below their respective 50-day moving average (DMA) lines after damaging losses. The volume totals were reported lighter than the prior session totals on the NYSE and on the Nasdaq exchange. Breadth was slightly positive as advancers led decliners by an 8-7 margin on the NYSE and 9-5 on the NASDAQ exchange. There were 11 high-ranked companies from the CANSLIM.net Leaders List that made new 52-week highs and appeared on the CANSLIM.net BreakOuts Page, up from the prior session total of 6 stocks. The new 52-week lows list solidly outnumbered new 52-week highs on the NYSE and on the Nasdaq exchange. There were gains for 4 of the 9 high-ranked companies currently included on the Featured Stocks Page. Distributional action raised concerns while leadership (stocks hitting new 52-week highs) waned and a deteriorating market (M criteria) environment was repeatedly noted in this commentary since last Thursday. Remember that the fact-based investment system prompts disciplined investors to reduce market exposure by selling any faltering stocks during rough market periods.
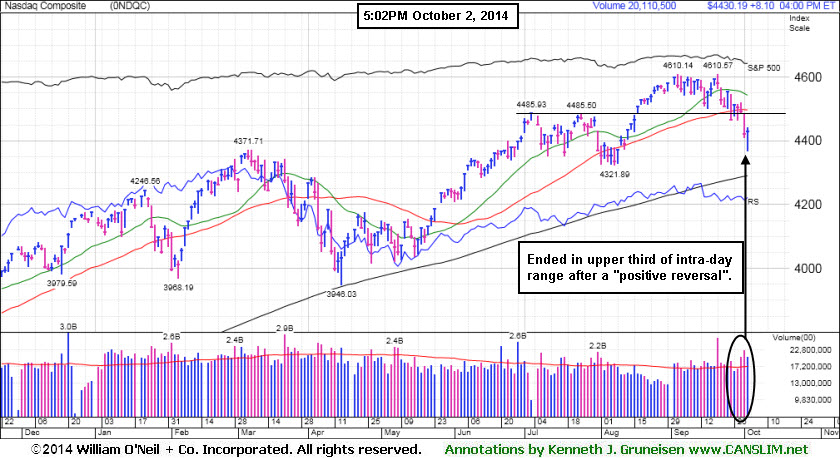
PICTURED: The NASDAQ Composite Index ended 8 points higher at 4,430, finishing in the upper third of its intra-day range after a "positive reversal".
The Dow declined less than 4 points to 16801. The S&P 500 was flat at 1946. The major averages erased early losses to close little changed in a choppy trading session. Investors were cautious ahead of Friday's all-important monthly employment report. Non-farm payrolls are expected to increase 215,000 in September. Thursday's report showed that the number of individuals filing for unemployment benefits fell last week to 287,000, below estimates for 297,000. A gauge of factory orders for September declined 10.1%, after a record-setting 10.5% increase in August.
Six of 10 sectors in the S&P 500 finished in negative territory. Energy led the decline as WTI crude fell to the lowest level in almost a year and a half. Apache (APA -2.6%) and Baker Hughes (BHI -2.1%) fell. Consumer discretionary was a notable outperformer. Netflix (NFLX +2.3%) rose following reports of new exclusive programming contracts. Warren Buffet's Berkshire Hathaway (BRKB +0.7%) rose after the company announced plans to purchase the largest private U.S. auto-dealer. AutoNation (AN +6.3%) in sympathy.
Treasuries fell following Wednesday's rally. The benchmark 10-year note lost 13/32 to yield 2.43%.
The CANSLIM.net Featured Stocks Page shows the most action-worthy candidates and their latest notes and a Headline Link directs members to the latest detailed analysis with data-packed graphs annotated by a Certified expert along with links to additional resources. The Premium Member Homepage includes "dynamic archives" to all prior pay reports published.
|
 Kenneth J. Gruneisen started out as a licensed stockbroker in August 1987, a couple of months prior to the historic stock market crash that took the Dow Jones Industrial Average down -22.6% in a single day. He has published daily fact-based fundamental and technical analysis on high-ranked stocks online for two decades. Through FACTBASEDINVESTING.COM, Kenneth provides educational articles, news, market commentary, and other information regarding proven investment systems that work in good times and bad.
Comments contained in the body of this report are technical opinions only and are not necessarily those of Gruneisen Growth Corp. The material herein has been obtained from sources believed to be reliable and accurate, however, its accuracy and completeness cannot be guaranteed. Our firm, employees, and customers may effect transactions, including transactions contrary to any recommendation herein, or have positions in the securities mentioned herein or options with respect thereto. Any recommendation contained in this report may not be suitable for all investors and it is not to be deemed an offer or solicitation on our part with respect to the purchase or sale of any securities. |
|
 |
Retail and Broker/Dealer Indexes Helped Market Bounce Back
Kenneth J. Gruneisen - Passed the CAN SLIM® Master's Exam
The Retail Index ($RLX +0.85%) was a positive influence on the major averages on Thursday. Financial shares were led higher by the Broker/Dealer Index ($XBD +0.81%) rose while the Bank Index ($BKX +0.06%) finished flat. Energy-related shares fell as the Oil Services Index ($OSX -0.94%) and the Integrated Oil Index ($XOI -0.61%) ended lower again. The tech sector was mixed as the Networking Index ($NWX +0.42%) edged higher while the Semiconductor Index ($SOX -0.59%) and Biotechnology Index ($BTK -0.31%) both suffered modest losses. The Gold & Silver Index ($XAU +0.77%) posted a small gain.
Charts courtesy www.stockcharts.com
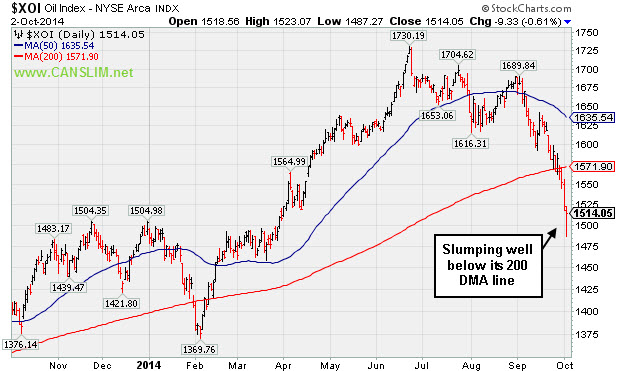
PICTURED: The Integrated Oil Index ($XOI -0.61%) is slumping well below its 200-day moving average (DMA) line with a streak of damaging losses.
| Oil Services |
$OSX |
257.25 |
-2.43 |
-0.94% |
-8.46% |
| Integrated Oil |
$XOI |
1,514.05 |
-9.33 |
-0.61% |
+0.73% |
| Semiconductor |
$SOX |
619.66 |
-3.70 |
-0.59% |
+15.82% |
| Networking |
$NWX |
318.93 |
+1.34 |
+0.42% |
-1.55% |
| Broker/Dealer |
$XBD |
167.47 |
+1.35 |
+0.81% |
+4.30% |
| Retail |
$RLX |
927.06 |
+7.82 |
+0.85% |
-1.36% |
| Gold & Silver |
$XAU |
81.63 |
+0.62 |
+0.77% |
-2.99% |
| Bank |
$BKX |
70.76 |
+0.04 |
+0.06% |
+2.17% |
| Biotech |
$BTK |
3,044.96 |
-9.52 |
-0.31% |
+30.66% |
|
|
|
 |
Volume-Driven Losses Triggered Sell Signal
Kenneth J. Gruneisen - Passed the CAN SLIM® Master's Exam
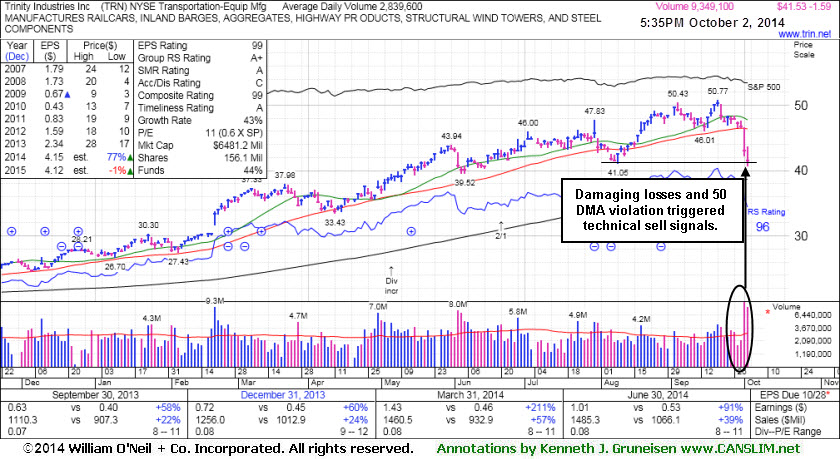
Trinity Industries Inc (TRN -$1.59 or -3.69% to $41.53) traded below its prior low ($41.05 on 8/08/14) today while tallying a 6th consecutive loss. This week's damaging volume-driven losses triggered a technical sell signal. Due to technical deterioration it will be dropped from the Featured Stocks list tonight. The Transportation - Equipment Manufacturing firm was last shown in this FSU section on 9/12/14 with annotated graphs under the headline, "Consolidating Above 50-Day Moving Average Line", and noted with caution - "Pulling back since a 'negative reversal' at its 52-week high on 9/03/14. It has not formed a sound base. Prior highs near $46-47 define near-term support above its 50-day moving average (DMA) line. Subsequent deterioration below that important short-term average would raise concerns and trigger technical sell signals."
Fundamentals remain strong after it reported earnings +91% on +39% sales revenues for the Jun '14 quarter, continuing its streak of strong quarterly earnings increases above the +25% minimum earnings guideline (C criteria). Annual earnings (A criteria) have improved following a downturn in FY '08-10.
TRN traded up as much as +34.35% since first highlighted in yellow in the 4/30/14 mid-day report report (read here). Disciplined investors avoid chasing stocks extended more than +5% above prior highs and they always limit losses by selling any stock that falls more than -7% from their purchase price.
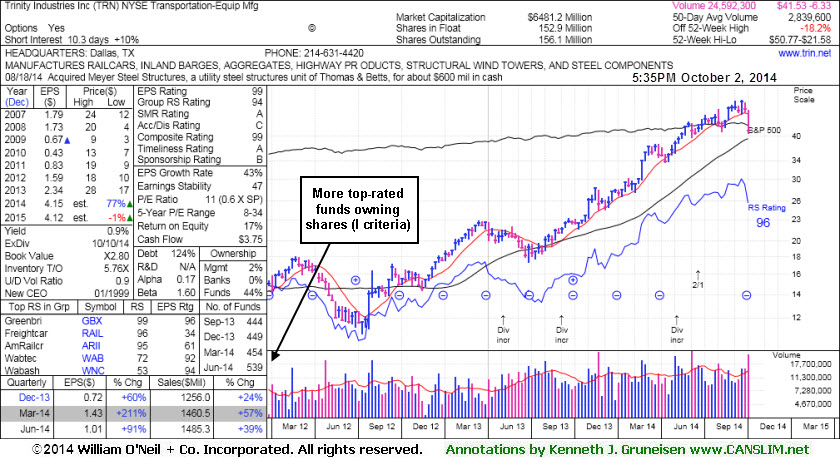
The number of top-rated funds owning its shares rose from 455 in Sep '13 to 539 in Jun '14, a reassuring sign concerning the I criteria. Its supply of shares outstanding (S criteria) was doubled as a 2:1 split was effective as of 6/20/14.
|
|
|
Color Codes Explained :
Y - Better candidates highlighted by our
staff of experts.
G - Previously featured
in past reports as yellow but may no longer be buyable under the
guidelines.
***Last / Change / Volume data in this table is the closing quote data***
Symbol/Exchange
Company Name
Industry Group |
PRICE |
CHANGE
(%Change) |
Day High |
Volume
(% DAV)
(% 50 day avg vol) |
52 Wk Hi
% From Hi |
Featured
Date |
Price
Featured |
Pivot Featured |
|
Max Buy |
ACT
-
NYSE
Actavis plc
Medical-Generic Drugs
|
$236.00
|
-2.48
-1.04% |
$240.38
|
2,235,367
97.32% of 50 DAV
50 DAV is 2,297,000
|
$249.94
-5.58%
|
6/20/2014
|
$216.53
|
PP = $230.87
|
|
MB = $242.41
|
Most Recent Note - 10/1/2014 1:36:53 PM
Y - Quietly consolidating below its "max buy" level and its color code is changed to yellow. Prior highs near $230 define near-term support to watch on pullbacks.
>>> FEATURED STOCK ARTICLE : Finally Volume-backed Gains Confirmed a Technical Buy Signal - 9/19/2014
View all notes |
Set NEW NOTE alert |
CANSLIM.net Company Profile |
SEC
News |
Chart |
Request a new note
C
A N
S L
I M


|
BITA
-
NYSE
Bitauto Hldgs Ltd Ads
Internet-Content
|
$74.96
|
+1.47
2.00% |
$76.15
|
1,353,627
76.00% of 50 DAV
50 DAV is 1,781,000
|
$98.28
-23.73%
|
6/26/2014
|
$46.20
|
PP = $47.03
|
|
MB = $49.38
|
 Most Recent Note - 10/2/2014 1:13:42 PM
Failing to rebound promptly after violating its 50 DMA line with losses amid widespread market (M criteria) weakness. Faces resistance due to overhead supply following recent technical sell signals. It will be dropped from the Featured Stocks list tonight.
>>> FEATURED STOCK ARTICLE : Volume Totals Recently Cooling After Halting Slide - 9/18/2014
View all notes |
Set NEW NOTE alert |
CANSLIM.net Company Profile |
SEC
News |
Chart |
Request a new note
C
A N
S L
I M
|
FB
-
NASDAQ
Facebook Inc Cl A
INTERNET
|
$77.08
|
+0.53
0.69% |
$77.48
|
36,431,584
102.37% of 50 DAV
50 DAV is 35,588,000
|
$79.71
-3.30%
|
9/9/2014
|
$76.67
|
PP = $76.84
|
|
MB = $80.68
|
Most Recent Note - 10/1/2014 1:53:21 PM
Y - Pulling back with higher volume today after wedging higher with gains lacking great volume conviction. Its 50 DMA line ($75.41) defines important near term support where a violation would trigger a technical sell signal
>>> FEATURED STOCK ARTICLE : Fell Toward 50-day Moving Average; Recent Gains Lacked Great Volume - 9/25/2014
View all notes |
Set NEW NOTE alert |
CANSLIM.net Company Profile |
SEC
News |
Chart |
Request a new note
C
A N
S L
I M
|
NVGS
-
NYSE
Navigator Holdings Ltd
Transportation-Ship
|
$26.28
|
-0.86
-3.17% |
$27.11
|
508,529
194.84% of 50 DAV
50 DAV is 261,000
|
$31.90
-17.62%
|
9/16/2014
|
$30.33
|
PP = $30.56
|
|
MB = $32.09
|
Most Recent Note - 10/2/2014 1:06:26 PM
Violated its 200 DMA line today with another volume-driven loss. Prior losses triggered a technical sell signal. Due to technical deterioration it will be dropped from the Featured Stocks list tonight.
>>> FEATURED STOCK ARTICLE : Finished Strong While Challenging Pivot Point and Recent Highs - 9/16/2014
View all notes |
Set NEW NOTE alert |
CANSLIM.net Company Profile |
SEC
News |
Chart |
Request a new note
C
A N
S L
I M
|
NXPI
-
NASDAQ
Nxp Semiconductors N V
ELECTRONICS - Semiconductor - Broad Line
|
$66.31
|
+0.30
0.45% |
$66.48
|
5,741,257
164.84% of 50 DAV
50 DAV is 3,483,000
|
$73.82
-10.17%
|
8/29/2014
|
$68.50
|
PP = $67.89
|
|
MB = $71.28
|
Most Recent Note - 10/1/2014 1:49:56 PM
Y- Slumping near its 50 DMA line and prior highs in the $67 area defining important support with today's 3rd consecutive loss on ever-increasing volume. Weakening market conditions (M criteria) are prompting investors to reduce exposure in any faltering stocks and avoid new buying efforts until strength returns.
>>> FEATURED STOCK ARTICLE : Consolidating Above Pivot Point and Below "Max Buy" Level - 9/17/2014
View all notes |
Set NEW NOTE alert |
CANSLIM.net Company Profile |
SEC
News |
Chart |
Request a new note
C
A N
S L
I M
|
Symbol/Exchange
Company Name
Industry Group |
PRICE |
CHANGE
(%Change) |
Day High |
Volume
(% DAV)
(% 50 day avg vol) |
52 Wk Hi
% From Hi |
Featured
Date |
Price
Featured |
Pivot Featured |
|
Max Buy |
PANW
-
NYSE
Palo Alto Networks
Computer Sftwr-Security
|
$98.18
|
+2.79
2.92% |
$99.90
|
2,542,747
149.84% of 50 DAV
50 DAV is 1,697,000
|
$102.45
-4.17%
|
7/30/2014
|
$84.21
|
PP = $85.88
|
|
MB = $90.17
|
Most Recent Note - 10/2/2014 5:57:06 PM
G - Posted a gain today with above average volume. Holding its ground stubbornly near its highs while widespread market (M criteria) weakness has prompted concerns. Prior highs in the $87 area define initial support to watch above its 50 DMA line ($88.89).
>>> FEATURED STOCK ARTICLE : Holding Ground Near Highs After Big Volume-Driven Gains - 9/24/2014
View all notes |
Set NEW NOTE alert |
CANSLIM.net Company Profile |
SEC
News |
Chart |
Request a new note
C
A N
S L
I M
|
STRT
-
NASDAQ
Strattec Security Corp
AUTOMOTIVE - Auto Parts
|
$81.09
|
-0.24
-0.30% |
$82.98
|
20,861
90.70% of 50 DAV
50 DAV is 23,000
|
$89.87
-9.77%
|
9/19/2014
|
$86.06
|
PP = $89.97
|
|
MB = $94.47
|
Most Recent Note - 10/1/2014 2:05:31 PM
Y - Still quietly consolidating, however eroding market conditions (M criteria) have raised concerns. Previously noted - "Volume-driven gains above the new pivot point cited may trigger a new (or add-on) technical buy signal. Its 50 DMA line and prior highs define important support to watch on pullbacks."
>>> FEATURED STOCK ARTICLE : Consolidating Above Prior Highs and 50-Day Moving Average Line - 9/26/2014
View all notes |
Set NEW NOTE alert |
CANSLIM.net Company Profile |
SEC
News |
Chart |
Request a new note
C
A N
S L
I M
|
TARO
-
NYSE
Taro Pharmaceutical Inds
DRUGS - Drug Manufacturers - Other
|
$148.98
|
-0.93
-0.62% |
$150.79
|
69,222
74.43% of 50 DAV
50 DAV is 93,000
|
$165.30
-9.87%
|
7/30/2014
|
$144.24
|
PP = $149.99
|
|
MB = $157.49
|
Most Recent Note - 10/1/2014 1:58:15 PM
G - Violating its 50 DMA line and undercutting prior lows with today's 3rd consecutive loss raising concerns and triggering a technical sell signal. Repeatedly noted with caution - "Recently reported earnings for the Jun '14 quarter below the +25% minimum earnings guideline (C criteria) raising fundamental concerns."
>>> FEATURED STOCK ARTICLE : Consolidating Above 50-day Moving Average and Prior Highs - 9/23/2014
View all notes |
Set NEW NOTE alert |
CANSLIM.net Company Profile |
SEC
News |
Chart |
Request a new note
C
A N
S L
I M
|
TRN
-
NYSE
Trinity Industries Inc
TRANSPORTATION - Railroads
|
$41.53
|
-1.59
-3.69% |
$43.71
|
9,349,519
329.32% of 50 DAV
50 DAV is 2,839,000
|
$50.77
-18.21%
|
4/30/2014
|
$37.79
|
PP = $38.03
|
|
MB = $39.93
|
Most Recent Note - 10/2/2014 1:10:16 PM
Traded below its prior low ($41.05 on 8/08/14) today while on track for a 6th consecutive loss. Damaging volume-driven losses triggered a technical sell signal. Due to technical deterioration it will be dropped from the Featured Stocks list tonight.
>>> FEATURED STOCK ARTICLE : Volume-Driven Losses Triggered Sell Signal - 10/2/2014
View all notes |
Set NEW NOTE alert |
CANSLIM.net Company Profile |
SEC
News |
Chart |
Request a new note
C
A N
S L
I M
|
|
|
|
THESE ARE NOT BUY RECOMMENDATIONS!
Comments contained in the body of this report are technical
opinions only. The material herein has been obtained
from sources believed to be reliable and accurate, however,
its accuracy and completeness cannot be guaranteed.
This site is not an investment advisor, hence it does
not endorse or recommend any securities or other investments.
Any recommendation contained in this report may not
be suitable for all investors and it is not to be deemed
an offer or solicitation on our part with respect to
the purchase or sale of any securities. All trademarks,
service marks and trade names appearing in this report
are the property of their respective owners, and are
likewise used for identification purposes only.
This report is a service available
only to active Paid Premium Members.
You may opt-out of receiving report notifications
at any time. Questions or comments may be submitted
by writing to Premium Membership Services 665 S.E. 10 Street, Suite 201 Deerfield Beach, FL 33441-5634 or by calling 1-800-965-8307
or 954-785-1121.
|
|
|

