You are not logged in.
This means you
CAN ONLY VIEW reports that were published prior to Wednesday, April 9, 2025.
You
MUST UPGRADE YOUR MEMBERSHIP if you want to see any current reports.
AFTER MARKET UPDATE - THURSDAY, SEPTEMBER 29TH, 2022
Previous After Market Report Next After Market Report >>>
|
|
|
|
DOW |
-458.13 |
29,225.61 |
-1.54% |
|
Volume |
1,017,614,069 |
-2% |
|
Volume |
4,479,996,300 |
-2% |
|
NASDAQ |
-314.13 |
10,737.51 |
-2.84% |
|
Advancers |
512 |
17% |
|
Advancers |
1,098 |
27% |
|
S&P 500 |
-78.57 |
3,640.47 |
-2.11% |
|
Decliners |
2,523 |
83% |
|
Decliners |
3,037 |
73% |
|
Russell 2000 |
-40.31 |
1,674.93 |
-2.35% |
|
52 Wk Highs |
8 |
|
|
52 Wk Highs |
19 |
|
|
S&P 600 |
-22.84 |
1,071.95 |
-2.09% |
|
52 Wk Lows |
820 |
|
|
52 Wk Lows |
771 |
|
|
The market (M criteria) is in a correction. A caution flag has been raised by the technical damage in the major indices coupled with a shrinking list of stocks hitting new highs. Disciplined investors know to raise cash by selling weakening stocks on a case-by-case basis, and to protect that cash by avoiding any new buys until a new rally is confirmed with a follow-through day.
|
 |
Major Averages Sink Decisively Again
Kenneth J. Gruneisen - Passed the CAN SLIM® Master's Exam
The Dow fell 458 points, while the Nasdaq Composite dropped 2.8% amid weakness in Technology shares. The S&P 500 shed 2.1% to notch a new low for 2022.. The volume totals reported were lighter than the prior session on the NYSE and on the Nasdaq exchange. Decliners led advancers by almost a 5-1 margin on the NYSE and nearly 3-1 on the Nasdaq exchange. There were zero high-ranked companies from the Leaders List that hit new 52-week highs and were listed on the BreakOuts Page, versus 2 on the prior session. New 52-week lows totals swelled and solidly outnumbered a shrinking list of new 52-week highs on both the NYSE and the Nasdaq exchange. The market is now in a correction (M criteria).
Chart courtesy of www.stockcharts.com%20on%20Tuesday.%20Yesterday,%20the%20broad%20benchmark%20eclipsed%20the%204,300%20level%20for%20the%20first%20time%20since%20late%20April.%20The%20Nasdaq%20Composite%20fell%201.3%%20amid%20weakness%20in%20mega-cap%20tech%20shares.%20The%20volume%20totals%20reported%20were%20mixed,%20lighter%20than%20the%20prior%20session%20on%20the%20NYSE%20and%20higher%20on%20the%20Nasdaq%20exchange.%20Decliners%20led%20advancers%20by%20a%204-1%20margin%20on%20the%20NYSE%20ad%20by%20a%203-1%20margin%20on%20the%20Nasdaq%20exchange.%20There%20were%2017%20high-ranked%20companies%20from%20the%20Leaders%20List%20that%20hit%20new%2052-week%20highs%20and%20were%20listed%20on%20the%20BreakOuts%20Page,%20down%20from%20the%20total%20of%2045%20on%20the%20prior%20session.%20New%2052-week%20highs%20outnumbered%20new%2052-week%20lows%20on%20the%20NYSE,%20but%20new%20lows%20outnumbered%20new%20highs%20on%20the%20Nasdaq%20exchange.%20The%20market%20is%20in%20a%20confirmed%20uptrend%20(M%20criteria).%20Any%20sustainable%20rally%20requires%20a%20healthy%20crop%20of%20leading%20stocks%20hitting%20new%20highs,%20so%20the%20recent%20improvement%20in%20leadership%20was%20a%20reassuring%20sign.) 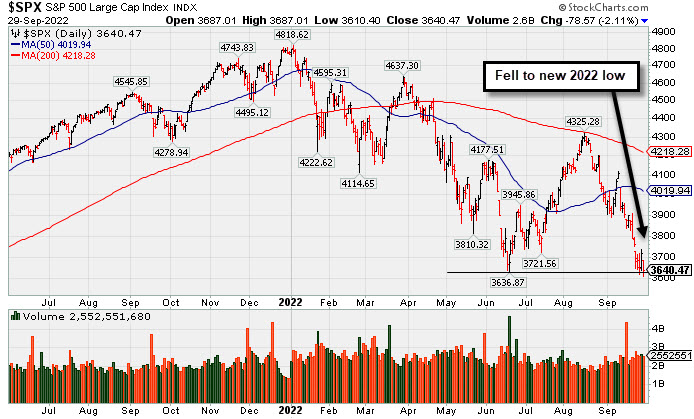 PICTURED: The S&P 500 Index slumped to a new 2022 low. Caution and patience remain paramount. Disciplined investors know to watch for a follow-through day of big gains on Day 4-7 of a new rally to confirm a new uptrend.
U.S. equities finished lower in volatile trading Thursday as investors digested fresh economic data and commentary from U.S. Federal Reserve (Fed) officials. All sectors in the S&P 500 ended in negative territory with Utilities and Consumer Discretionary leading laggards. St. Louis Fed President James Bullard echoed the hawkish rhetoric of other Fed officials, saying the central bank will not back down from additional rate hikes in the coming months. Cleveland Fed President Loretta Mester reiterated the need for further monetary policy tightening, even though it will cause some economic pain.
On the data front, initial jobless claims came in at its lowest point since April for the week ended September 24. Meanwhile, a third reading for second quarter Gross Domestic Product (GDP) was unchanged, while the personal consumption component of GDP and Core PCE (the Fed’s preferred proxy for inflation) were upwardly revised. The better-than-expected figures have increased the probability the Fed will maintain its aggressive stance and proceed with its rate hiking path.
Treasuries weakened, with the yield on the benchmark ten-year adding three basis points (0.03%) to 3.76%, while the 30-year bond yield climbed two basis points (0.02%) to 3.70%. The yield on the more policy-sensitive two-year note advanced five basis points (0.05%) to 4.17%. Elsewhere, a gauge of the U.S. dollar reversed earlier gains to decline 0.4%. In commodities, West Texas Intermediate (WTI) crude declined 0.7% to $81.56/barrel despite tight supply conditions and a softening dollar. |
 Kenneth J. Gruneisen started out as a licensed stockbroker in August 1987, a couple of months prior to the historic stock market crash that took the Dow Jones Industrial Average down -22.6% in a single day. He has published daily fact-based fundamental and technical analysis on high-ranked stocks online for two decades. Through FACTBASEDINVESTING.COM, Kenneth provides educational articles, news, market commentary, and other information regarding proven investment systems that work in good times and bad.
Comments contained in the body of this report are technical opinions only and are not necessarily those of Gruneisen Growth Corp. The material herein has been obtained from sources believed to be reliable and accurate, however, its accuracy and completeness cannot be guaranteed. Our firm, employees, and customers may effect transactions, including transactions contrary to any recommendation herein, or have positions in the securities mentioned herein or options with respect thereto. Any recommendation contained in this report may not be suitable for all investors and it is not to be deemed an offer or solicitation on our part with respect to the purchase or sale of any securities. |
|
 |
Retail, Financial, and Tech Groups Fell
Kenneth J. Gruneisen - Passed the CAN SLIM® Master's Exam
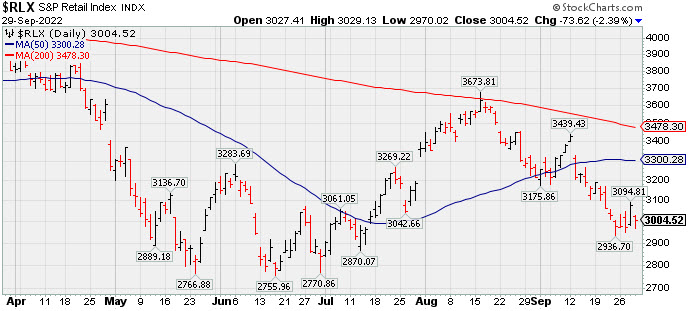
The Retail Index ($RLX -2.39%) weighed on the major averages along with the Bank Index ($BKX -1.57%) and Broker/Dealer Index ($XBD -1.91%). The tech sector was led lower by the Semiconductor Index ($SOX -3.29%) and Networking Index ($NWX -2.43%) while the Biotech Index ($BTK -1.73%) also slumped for a considerable loss. The Gold & Silver Index ($XAU +1.20%) posted a solid gain while the Oil Services Index ($OSX +0.05%) and Integrated Oil Index ($XOI +0.02%) both finished little changed.
PICTURED: The Retail Index ($RLX -2.39%) has been slumping toward the recent low.
| Oil Services |
$OSX |
60.09 |
+0.03 |
+0.05% |
+13.99% |
| Integrated Oil |
$XOI |
1,511.56 |
+0.26 |
+0.02% |
+28.29% |
| Semiconductor |
$SOX |
2,347.36 |
-79.90 |
-3.29% |
-40.52% |
| Networking |
$NWX |
720.89 |
-17.96 |
-2.43% |
-25.76% |
| Broker/Dealer |
$XBD |
410.17 |
-7.97 |
-1.91% |
-15.75% |
| Retail |
$RLX |
3,004.52 |
-73.62 |
-2.39% |
-28.91% |
| Gold & Silver |
$XAU |
99.35 |
+1.18 |
+1.20% |
-24.99% |
| Bank |
$BKX |
96.63 |
-1.54 |
-1.57% |
-26.91% |
| Biotech |
$BTK |
4,516.48 |
-79.45 |
-1.73% |
-18.16% |
|
|
|
 |
Featured Stocks
Kenneth J. Gruneisen - Passed the CAN SLIM® Master's Exam
|
|
|
Color Codes Explained :
Y - Better candidates highlighted by our
staff of experts.
G - Previously featured
in past reports as yellow but may no longer be buyable under the
guidelines.
***Last / Change / Volume data in this table is the closing quote data***
Symbol/Exchange
Company Name
Industry Group |
PRICE |
CHANGE
(%Change) |
Day High |
Volume
(% DAV)
(% 50 day avg vol) |
52 Wk Hi
% From Hi |
Featured
Date |
Price
Featured |
Pivot Featured |
|
Max Buy |
 CI
-
NYSE
CI
-
NYSE
Cigna Corp
Medical-Managed Care
|
$280.56
|
-1.99
-0.70% |
$281.69
|
1,470,372
76.66% of 50 DAV
50 DAV is 1,918,000
|
$296.29
-5.31%
|
7/7/2022
|
$276.55
|
PP = $273.68
|
|
MB = $287.36
|
Most Recent Note - 9/28/2022 5:58:11 PM
G - Posted a 2nd consecutive gain today, rebounding near its 50 DMA line ($283.56) which may now act as resistance after a streak of 6 consecutive damaging losses. Reported earnings for the Jun '22 quarter rose +19% on +5% sales revenues versus the year ago period, breaking a streak of 3 quarterly earnings increases above the +25% minimum guideline (C criteria), raising fundamental concerns.
>>> FEATURED STOCK ARTICLE : Found Support Above 50-Day Moving Average Line This Week - 9/16/2022 |
View all notes |
Set NEW NOTE alert |
Company Profile |
SEC
News |
Chart |
Request a new note
C
A
S
I |
ESQ
-
NASDAQ
Esquire Financial Hldgs
Finance-Commercial Loans
|
$36.68
|
-0.60
-1.61% |
$37.18
|
48,683
187.24% of 50 DAV
50 DAV is 26,000
|
$41.68
-12.00%
|
7/26/2022
|
$37.74
|
PP = $39.19
|
|
MB = $41.15
|
 Most Recent Note - 9/29/2022 12:11:49 PM
G - Color code was changed to green after slumping below its 50 DMA line ($37.94) during a 4 session losing streak, raising greater concerns while slumping well below the pivot point. The market is in a correction (M criteria) and disciplined investors know to avoid new buying efforts until a new rally confirmed with a follow-through day.
>>> FEATURED STOCK ARTICLE : Thinly-Traded Esquire Still Perched Near High - 9/20/2022 |
View all notes |
Set NEW NOTE alert |
Company Profile |
SEC
News |
Chart |
Request a new note
C
A
S
I |
ENPH
-
NASDAQ
Enphase Energy Inc
Energy-Solar
|
$277.84
|
-14.47
-4.95% |
$290.98
|
3,565,680
96.68% of 50 DAV
50 DAV is 3,688,000
|
$324.84
-14.47%
|
7/28/2022
|
$276.66
|
PP = $282.55
|
|
MB = $296.68
|
Most Recent Note - 9/29/2022 2:19:39 PM
G - Color code is changed to green while slumping back below its 50 DMA line ($287) with today's big loss testing the prior low ($270.57 on 9/23/22). More damaging losses would raise greater concerns. Fundamentals remain strong. The market is in a correction (M criteria) and disciplined investors know to avoid new buying efforts until a new rally confirmed with a follow-through day.
>>> FEATURED STOCK ARTICLE : Found Support After Undercutting 50 DMA and Prior Low - 9/27/2022 |
View all notes |
Set NEW NOTE alert |
Company Profile |
SEC
News |
Chart |
Request a new note
C
A
S
I |
CCRN
-
NASDAQ
Cross Country Healthcare
DIVERSIFIED SERVICES - Staffing and Outsourcing Service
|
$29.19
|
+0.31
1.07% |
$29.26
|
665,772
75.23% of 50 DAV
50 DAV is 885,000
|
$30.51
-4.33%
|
9/9/2022
|
$27.32
|
PP = $30.61
|
|
MB = $32.14
|
Most Recent Note - 9/28/2022 5:56:33 PM
Y - Posted a 3rd consecutive gain with below average volume. Its 50 DMA line ($26) defines important near-term support where a violation would raise concerns and trigger a technical sell signal. Volume totals have been cooling while still consolidating within striking distance of prior highs in the $30 area. Recently reported insider buying is a reassuring sign. The market is in a correction (M criteria) and disciplined investors know to avoid new buying efforts until a new rally confirmed with a follow-through day.
>>> FEATURED STOCK ARTICLE : Positive Reversal While Consolidating Above 50-Day Moving Average - 9/12/2022 |
View all notes |
Set NEW NOTE alert |
Company Profile |
SEC
News |
Chart |
Request a new note
C
A
S
I |
|
|
|
THESE ARE NOT BUY RECOMMENDATIONS!
Comments contained in the body of this report are technical
opinions only. The material herein has been obtained
from sources believed to be reliable and accurate, however,
its accuracy and completeness cannot be guaranteed.
This site is not an investment advisor, hence it does
not endorse or recommend any securities or other investments.
Any recommendation contained in this report may not
be suitable for all investors and it is not to be deemed
an offer or solicitation on our part with respect to
the purchase or sale of any securities. All trademarks,
service marks and trade names appearing in this report
are the property of their respective owners, and are
likewise used for identification purposes only.
This report is a service available
only to active Paid Premium Members.
You may opt-out of receiving report notifications
at any time. Questions or comments may be submitted
by writing to Premium Membership Services 665 S.E. 10 Street, Suite 201 Deerfield Beach, FL 33441-5634 or by calling 1-800-965-8307
or 954-785-1121.
|
|
|