You are not logged in.
This means you
CAN ONLY VIEW reports that were published prior to Tuesday, April 15, 2025.
You
MUST UPGRADE YOUR MEMBERSHIP if you want to see any current reports.
AFTER MARKET UPDATE - FRIDAY, SEPTEMBER 18TH, 2009
Previous After Market Report Next After Market Report >>>
|
|
|
|
DOW |
+36.28 |
9,820.20 |
+0.37% |
|
Volume |
2,275,271,280 |
+50% |
|
Volume |
3,236,432,190 |
+22% |
|
NASDAQ |
+6.11 |
2,132.86 |
+0.29% |
|
Advancers |
1,755 |
57% |
|
Advancers |
1,434 |
50% |
|
S&P 500 |
+2.81 |
1,068.30 |
+0.26% |
|
Decliners |
1,250 |
40% |
|
Decliners |
1,319 |
46% |
|
Russell 2000 |
+2.41 |
617.88 |
+0.39% |
|
52 Wk Highs |
220 |
|
|
52 Wk Highs |
94 |
|
|
S&P 600 |
+0.54 |
323.53 |
+0.17% |
|
52 Wk Lows |
2 |
|
|
52 Wk Lows |
1 |
|
|
 |
S&P 500 Index Finishes Up +60% From March 2009 Low
Adam Sarhan, Contributing Writer,
The major averages closed higher on Friday as volume surged across the board thanks to a series of options expirations. Advancers led decliners by almost a 3-to-2 ratio on the NYSE while, but they led only by a narrow 14-to-13 ratio on the Nasdaq exchange. There were 31 high-ranked companies from the CANSLIM.net Leaders List that made a new 52-week high and appeared on the CANSLIM.net BreakOuts Page, down from 40 issues that appeared on the prior session. New 52-week highs were in the triple digits on both exchanges, while new 52-week lows were in the single digits yet again.
Monday marked the anniversary of Lehman Brothers' infamous bankruptcy which triggered last year's violent stock market sell off and claimed scores of large financial institutions. The major averages fluctuated between positive and negative territory, but the day was relatively quiet was the major averages ended on a high note for all of the major averages. The major averages edged higher after retail sales topped analysts estimates last month and Federal Reserve Chairman Ben Bernanke said the recession is "very likely" over.
On Wednesday, stocks surged around the world as the US dollar continued falling and gold surged to a new high. The Federal Reserve said industrial production rose at a stronger than expected rate which was echoed other stronger than expected economic data released throughout the week. The Bloomberg Professional Global Confidence Index, a survey that measures global confidence, rose to +58.54 in September which is higher than the boom/bust reading of 50 and higher than last month's reading of 58.12. Confidence in the world economy held steady in September after reports suggested the recession may be finally over.
On Thursday, the market negatively reversed and closed lower after the latest round of economic data was released. The Commerce Department said that housing starts rose +1.5% last month to an annual rate of 598,000, led by construction of multi-family homes. This was the highest reading in nine months which bodes well for the possible "recovery" for housing prices. Elsewhere, the Federal Reserve Bank of Philadelphia said its general economic index rose to 14.1 in September from 4.2 in August. Both reports coupled with an unexpected decline in jobless claims, support Fed Chairman Ben S. Bernanke’s theory that the recession has likely ended. A separate report from the Fed showed that US household wealth rose by $2 trillion in the second quarter which effectively ended the largest slump in history. Net worth for households and non-profit groups rose to $53.1 from $51.1 trillion in the first quarter, reflecting the largest quarterly jump in stock prices since 1998 and the first increase in home prices in more than two years. This was the first gain in household wealth since the third quarter of 2007.
Stocks edged higher on Friday as the bulls continue to quell any bearish selling. The market is very strong, evidenced by the very steep rally over the past two weeks.
PICTURED: The S&P 500 Index is the common "benchmark" index money managers strive to keep pace with, and very few outperform it. It has rallied +60.36% from its March low! While its strong uptrend remains intact, keep in mind that as every day passes the chances of a more considerable pullback increase. Normally, one would like to see the market advance on heavy volume then pull back on lighter volume before resuming its uptrend.
Money Management Services: Free Portfolio Review!
Investors often inquire looking for a money manager who follows a proven set of rules and who has completed the Master's Program, demonstrating a high level of skill at using this powerful investment system. Well, you are in luck! If you qualify to open an account with us you will have not one, but two highly qualified portfolio managers who have completed the Master's Program and follow the rules of this powerful investment system. Learn more about having your account professionally managed using this fact-based investment system by clicking HERE. *Accounts over $250,000 please. ** Serious inquiries only.
|
|
|
 |
Retail, Semiconductor, and Financial Groups Provided Strength During Rally
Kenneth J. Gruneisen - Passed the CAN SLIM® Master's Exam
Defensive groups lagged other areas as the Gold & Silver Index ($XAU -1.79%) and Healthcare Index ($HMO -1.01%) were decliners on Friday. Energy shares were mixed as the Oil Services Index ($OSX +1.07%) rose and the Integrated Oil Index ($XOI -0.40%) fell. Tech shares has a mildly positive bias as the Internet Index ($IIX +0.18%), Biotechnology Index ($BTK +0.29%), and Networking Index ($NWX +0.31%) posted modest gains.
The Bank Index ($BKX -0.36%) also edged lower on Friday after Thursday's negative reversal. For the near term it may be important to keep a close eye on financial stocks. Financial stocks were described as a very important leading indicator for the broader market when the Bank Index's rally to a new 2009 high was shown in this IGW section on Wednesday (read here). Below we will take a closer look at some very influential areas that have provided important strength during the market's current rally. It is a sign of a healthy market environment when strength abounds across various industry groups.
Charts courtesy www.stockcharts.com
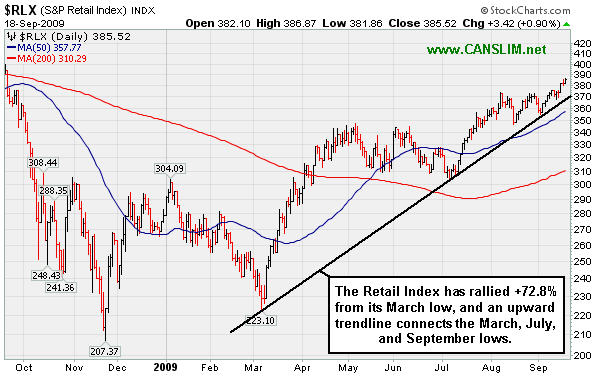
PICTURED 1: The Retail Index ($RLX +0.90%) has rallied +72.8% from its March low, and an upward trendline connects its March, July, and September lows.
Charts courtesy www.stockcharts.com
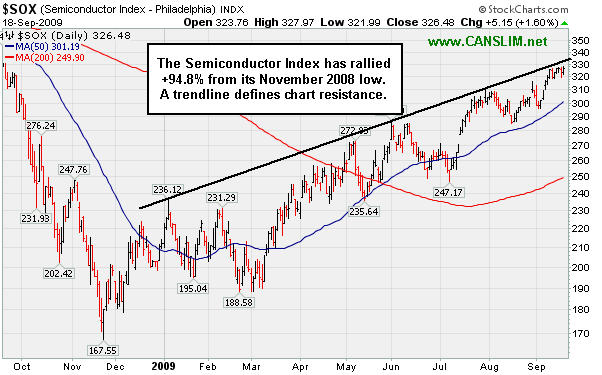
PICTURED 2: The Semiconductor Index ($SOX +1.60%) has rallied +94.8% from its November 2008 low. A trendline connecting at least 3 prior highs defines chart resistance which it has once again rallied near.
Charts courtesy www.stockcharts.com
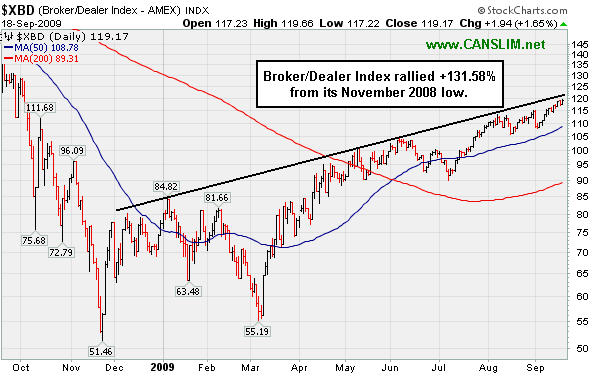
PICTURED 3: The Broker/Dealer Index ($XBD +1.65%) has rallied +131.58% from its November 2008 low. Its big percentage gain makes it very hard to question the importance of financial shares' impact on the broader market direction.
| Oil Services |
$OSX |
196.27 |
+2.07 |
+1.07% |
+61.69% |
| Healthcare |
$HMO |
1,256.23 |
-12.81 |
-1.01% |
+30.83% |
| Integrated Oil |
$XOI |
1,048.28 |
-4.22 |
-0.40% |
+7.00% |
| Semiconductor |
$SOX |
326.48 |
+5.15 |
+1.60% |
+53.88% |
| Networking |
$NWX |
235.85 |
+0.73 |
+0.31% |
+63.91% |
| Internet |
$IIX |
217.93 |
+0.40 |
+0.18% |
+62.91% |
| Broker/Dealer |
$XBD |
119.17 |
+1.94 |
+1.65% |
+53.83% |
| Retail |
$RLX |
385.52 |
+3.42 |
+0.90% |
+38.05% |
| Gold & Silver |
$XAU |
168.03 |
-3.06 |
-1.79% |
+35.67% |
| Bank |
$BKX |
47.69 |
-0.17 |
-0.36% |
+7.60% |
| Biotech |
$BTK |
957.05 |
+2.74 |
+0.29% |
+47.88% |
|
|
|
 |
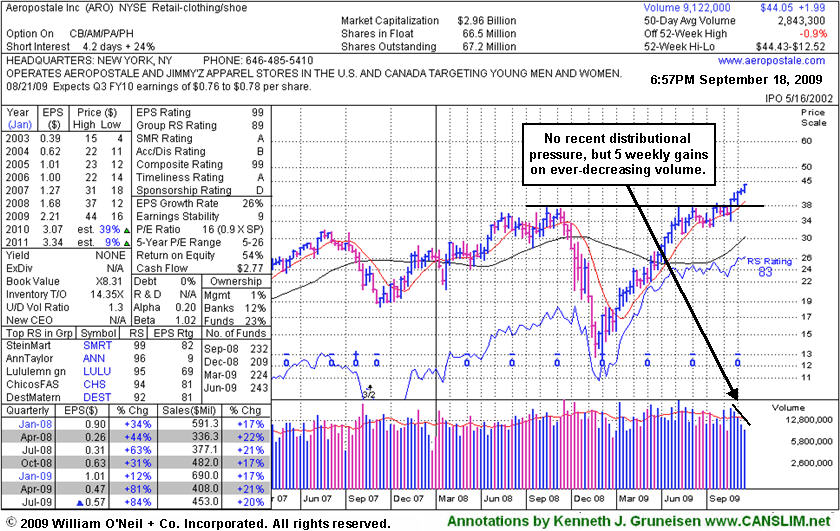
Slow Steady Climb Continues For Retailer
Kenneth J. Gruneisen - Passed the CAN SLIM® Master's Exam
Aeropostale Inc (ARO +$0.13 or +0.30% to $44.05) inched to a new all-time high close today with light volume behind its 5th consecutive up session. Its weekly graph below illustrates its streak of 5 consecutive weekly gains on ever-decreasing volume. It has not encountered any distributional action since it rallied above its 2008 highs, however it is extended from a sound base and not buyable under the investment system guidelines now. Support to watch is at prior highs in the $38 area. Disciplined investors avoid chasing stocks more than 5% above their pivot point, as doing so increases the chances that a normal pullback will prompt them to sell the stock -as investors should always limit losses by selling any stock that falls 7% from their buy price.
This a high-ranked leader in the Retail - Clothing/shoe group has advanced slowly, steadily, and quietly since it was featured in yellow with new pivot point and max buy levels noted in the 8/21/09 Mid-Day BreakOuts Report (read here). It has a great annual earnings history (the A criteria), and the 2 latest quarterly comparisons showed +81% and +84% earnings increases, well above the investment system's +25% guideline. The number of top-rated funds owning an interest in its shares rose from 209 in Dec '08 to 243 in Jun '09, which is good news concerning the I criteria. An annotated daily graph was included on 9/02/09 with its last appearance in this FSU section under the headline "Consolidation Near Prior Highs While Market Sputters. It found great support and continued higher as the market improved.
|
|
|
Color Codes Explained :
Y - Better candidates highlighted by our
staff of experts.
G - Previously featured
in past reports as yellow but may no longer be buyable under the
guidelines.
***Last / Change / Volume quote data in this table corresponds with the timestamp on the note***
Symbol/Exchange
Company Name
Industry Group |
Last |
Chg. |
Vol
% DAV |
Date Featured |
Price Featured |
Latest Pivot Point
Featured |
Status |
| Latest Max Buy Price |
ARO
- NYSE
Aeropostale Inc
RETAIL - Apparel Stores
|
$44.05
|
+0.13
|
1,673,044
59% DAV
2,843,300
|
8/21/2009
(Date
Featured) |
$39.21
(Price
Featured) |
PP = $38.84 |
G |
| MB = $40.78 |
Most Recent Note - 9/18/2009 6:18:45 PM
G - This high-ranked leader in the Retail - Clothing/shoe group inched to a new all-time high close today with light volume behind its 5th consecutive gain. It is extended from a sound base and not buyable under the investment system guidelines now. Support to watch is at prior highs in the $38 area. It was featured in yellow in the 8/21/09 Mid-Day BreakOuts Report (read here).
>>> The latest Featured Stock Update with an annotated graph appeared on 9/18/2009. click here.
|
|
C
A
S
I |
News |
Chart |
SEC
View all notes Alert
me of new notes
Company
Profile
|
ARST
-
|
$22.60
|
+0.41
|
977,928
137% DAV
715,300
|
9/1/2009
(Date
Featured) |
$19.91
(Price
Featured) |
PP = $20.90 |
G |
| MB = $21.95 |
Most Recent Note - 9/18/2009 6:19:48 PM
G - Small gap up and gain with above average volume today after an analyst upgrade. It has stubbornly held its recent volume-driven gains. It is hovering above its "max buy" level, and prior chart highs in the $20 area are important support to watch on pullbacks.
>>> The latest Featured Stock Update with an annotated graph appeared on 9/17/2009. click here.
|
|
C
A
S
I |
News |
Chart |
SEC
View all notes Alert
me of new notes
Company
Profile
|
BIDU
- NASDAQ
Baidu Inc Ads
INTERNET - Internet Information Providers
|
$399.98
|
+0.79
|
1,384,864
75% DAV
1,854,200
|
9/8/2009
(Date
Featured) |
$351.80
(Price
Featured) |
PP = $368.59 |
G |
| MB = $387.02 |
Most Recent Note - 9/18/2009 6:22:42 PM
G - Perched near the $400 level, extended from a sound base, thus not buyable now under the investment system guidelines. BIDU was featured in yellow in the 9/08/09 Mid-Day BreakOuts Report (read here).
>>> The latest Featured Stock Update with an annotated graph appeared on 9/8/2009. click here.
|
|
C
A
S
I |
News |
Chart |
SEC
View all notes Alert
me of new notes
Company
Profile
|
CRM
- NYSE
Salesforce.com Inc
INTERNET - Internet Software & Services
|
$58.17
|
-0.37
|
2,096,391
105% DAV
2,001,900
|
8/16/2009
(Date
Featured) |
$47.12
(Price
Featured) |
PP = $45.59 |
G |
| MB = $47.87 |
Most Recent Note - 9/18/2009 6:23:58 PM
G - Extended from a sound base, thus not buyable now under the guidelines. Prior highs near $55 are an intial support level to watch on pullbacks. It recently rose from a "3-weeks tight" type pattern following its "breakaway gap" on 8/21/09 with more than 5 times average volume. Detailed analysis and an annotated graph were included when recently featured in the 8/16/09 Stock Bulletin (read here).
>>> The latest Featured Stock Update with an annotated graph appeared on 9/15/2009. click here.
|
|
C
A
S
I |
News |
Chart |
SEC
View all notes Alert
me of new notes
Company
Profile
|
EBIX
- NASDAQ
Ebix Inc
COMPUTER SOFTWARE & SERVICES - Business Software & Services
|
$49.48
|
-1.02
|
149,610
119% DAV
125,500
|
8/28/2009
(Date
Featured) |
$45.86
(Price
Featured) |
PP = $45.35 |
G |
| MB = $47.62 |
Most Recent Note - 9/18/2009 6:26:30 PM
G - It is consolidating and still too extended from a sound base. Recent whipsaw action briefly tested support, like its shakeout in mid-August. It has a small supply of only 6.62 million shares in the float. EBIX rallied as much as +19.76% since featured in yellow in the 8/28/09 Mid-Day BreakOuts Report (read here).
>>> The latest Featured Stock Update with an annotated graph appeared on 9/11/2009. click here.
|
|
C
A
S
I |
News |
Chart |
SEC
View all notes Alert
me of new notes
Company
Profile
|
GMCR
- NASDAQ
Green Mtn Coffee Roastrs
FOOD & BEVERAGE - Processed & Packaged Goods
|
$68.89
|
+1.35
|
1,190,849
80% DAV
1,479,800
|
7/17/2009
(Date
Featured) |
$60.15
(Price
Featured) |
PP = $63.79 |
G |
| MB = $66.98 |
Most Recent Note - 9/18/2009 6:36:09 PM
G - It overcame distributional pressure after it completed an additional share offering on 8/07/09, and volume totals have been light as it recently rose back above its 50 DMA line and rallied up through most overhead supply. GMCR traded up more than +168% since appearing with an annotated graph under the headline "It May Soon Be Time To Go Green" when featured in the January 2009 CANSLIM.net News (read here).
>>> The latest Featured Stock Update with an annotated graph appeared on 9/10/2009. click here.
|
|
C
A
S
I |
News |
Chart |
SEC
View all notes Alert
me of new notes
Company
Profile
|
NTES
- NASDAQ
Netease Inc Adr
INTERNET - Internet Information Providers
|
$45.24
|
-0.23
|
1,573,519
76% DAV
2,076,600
|
7/17/2009
(Date
Featured) |
$39.29
(Price
Featured) |
PP = $38.74 |
G |
| MB = $40.68 |
Most Recent Note - 9/18/2009 6:37:38 PM
G - The week's trading was highlighted by a solid gap up gain on 9/16/09 with higher volume, rallying from support at its 50 DMA line. The next support is as prior chart highs in the $38 area. Deterioration below those levels would raise more serious concerns and trigger additional sell signals.
>>> The latest Featured Stock Update with an annotated graph appeared on 9/14/2009. click here.
|
|
C
A
S
I |
News |
Chart |
SEC
View all notes Alert
me of new notes
Company
Profile
|
NVEC
- NASDAQ
N V E Corp
ELECTRONICS - Semiconductor - Specialized
|
$54.66
|
-1.09
|
141,777
162% DAV
87,400
|
8/26/2009
(Date
Featured) |
$55.32
(Price
Featured) |
PP = $57.60 |
G |
| MB = $60.48 |
Most Recent Note - 9/18/2009 6:39:40 PM
G - Fell near its 50 DMA line today with another loss on above average volume. Gapped down on 8/17/09 and suffered a considerable loss with nearly 4 times average volume, negating its latest breakout and triggering a technical sell signal. Whenever any stock flashes its biggest point loss on its highest down volume it raises great concerns. On the prior session it touched a new 52-week high and then negatively reversed for a loss on average volume. This high-ranked leader from the Electronics industry group quickly got extended from its latest sound base. As previously noted, "Keep in mind its small supply (the S criteria) of shares outstanding which can contribute to greater than usual volatility. Be mindful of its still rather minuscule sales revenues. These concerns heighten the need for great discipline in trading (buying AND selling)."
>>> The latest Featured Stock Update with an annotated graph appeared on 9/16/2009. click here.
|
|
C
A
S
I |
News |
Chart |
SEC
View all notes Alert
me of new notes
Company
Profile
|
PEGA
- NASDAQ
Pegasystems Inc
COMPUTER SOFTWARE & SERVICES - Business Software & Services
|
$33.26
|
+0.94
|
337,053
90% DAV
376,500
|
9/9/2009
(Date
Featured) |
$31.14
(Price
Featured) |
PP = $33.35 |
Y |
| MB = $35.02 |
Most Recent Note - 9/18/2009 6:45:09 PM
Y - Gain today on near average volume for its second best close ever. A pullback under its latest pivot point on 9/17/09 raised concerns after volume-driven gains pegged the high-ranked Computer Software - Financial firm to a new all-time high.
>>> The latest Featured Stock Update with an annotated graph appeared on 9/9/2009. click here.
|
|
C
A
S
I |
News |
Chart |
SEC
View all notes Alert
me of new notes
Company
Profile
|
|
|
|
THESE ARE NOT BUY RECOMMENDATIONS!
Comments contained in the body of this report are technical
opinions only. The material herein has been obtained
from sources believed to be reliable and accurate, however,
its accuracy and completeness cannot be guaranteed.
This site is not an investment advisor, hence it does
not endorse or recommend any securities or other investments.
Any recommendation contained in this report may not
be suitable for all investors and it is not to be deemed
an offer or solicitation on our part with respect to
the purchase or sale of any securities. All trademarks,
service marks and trade names appearing in this report
are the property of their respective owners, and are
likewise used for identification purposes only.
This report is a service available
only to active Paid Premium Members.
You may opt-out of receiving report notifications
at any time. Questions or comments may be submitted
by writing to Premium Membership Services 665 S.E. 10 Street, Suite 201 Deerfield Beach, FL 33441-5634 or by calling 1-800-965-8307
or 954-785-1121.
|
|
|


