You are not logged in.
This means you
CAN ONLY VIEW reports that were published prior to Thursday, April 10, 2025.
You
MUST UPGRADE YOUR MEMBERSHIP if you want to see any current reports.
AFTER MARKET UPDATE - WEDNESDAY, SEPTEMBER 14TH, 2022
Previous After Market Report Next After Market Report >>>
|
|
|
|
DOW |
+30.12 |
31,135.09 |
+0.10% |
|
Volume |
1,001,405,545 |
+7% |
|
Volume |
4,880,350,500 |
-6% |
|
NASDAQ |
+86.10 |
11,719.68 |
+0.74% |
|
Advancers |
1,588 |
52% |
|
Advancers |
2,083 |
48% |
|
S&P 500 |
+13.32 |
3,946.01 |
+0.34% |
|
Decliners |
1,464 |
48% |
|
Decliners |
2,211 |
51% |
|
Russell 2000 |
+6.89 |
1,838.46 |
+0.38% |
|
52 Wk Highs |
33 |
|
|
52 Wk Highs |
39 |
|
|
S&P 600 |
-0.23 |
1,161.99 |
-0.02% |
|
52 Wk Lows |
183 |
|
|
52 Wk Lows |
271 |
|
|
Deterioration has the market uptrend under pressure (M criteria) and having the overall look of a more serious correction. A caution flag has been raised by the technical damage in the major indices coupled with a shrinking list of stocks hitting new highs.
|
 |
Leadership Thin as Major Averages Inched Higher
Kenneth J. Gruneisen - Passed the CAN SLIM® Master's Exam
The Dow added 30 points, while the Nasdaq Composite advanced 0.7%. The S&P 500 climbed 0.3%. The volume totals reported were mixed, higher than the prior session on the NYSE and lighter on the Nasdaq exchange. Breadth was fairly even as decliners led advancers by a narrow margin on the Nasdaq exchange while advancers slightly outnumbered decliners on the NYSE. Leadership remained thin as there were 5 high-ranked companies from the Leaders List that hit new 52-week highs and were listed on the BreakOuts Page, versus the total of 3 on the prior session. New 52-week lows outnumbered new 52-week highs on both the NYSE and the Nasdaq exchange. The market uptrend is now under pressure (M criteria). Any sustainable rally requires a healthy crop of leading stocks hitting new highs.
Chart courtesy of www.stockcharts.com%20on%20Tuesday.%20Yesterday,%20the%20broad%20benchmark%20eclipsed%20the%204,300%20level%20for%20the%20first%20time%20since%20late%20April.%20The%20Nasdaq%20Composite%20fell%201.3%%20amid%20weakness%20in%20mega-cap%20tech%20shares.%20The%20volume%20totals%20reported%20were%20mixed,%20lighter%20than%20the%20prior%20session%20on%20the%20NYSE%20and%20higher%20on%20the%20Nasdaq%20exchange.%20Decliners%20led%20advancers%20by%20a%204-1%20margin%20on%20the%20NYSE%20ad%20by%20a%203-1%20margin%20on%20the%20Nasdaq%20exchange.%20There%20were%2017%20high-ranked%20companies%20from%20the%20Leaders%20List%20that%20hit%20new%2052-week%20highs%20and%20were%20listed%20on%20the%20BreakOuts%20Page,%20down%20from%20the%20total%20of%2045%20on%20the%20prior%20session.%20New%2052-week%20highs%20outnumbered%20new%2052-week%20lows%20on%20the%20NYSE,%20but%20new%20lows%20outnumbered%20new%20highs%20on%20the%20Nasdaq%20exchange.%20The%20market%20is%20in%20a%20confirmed%20uptrend%20(M%20criteria).%20Any%20sustainable%20rally%20requires%20a%20healthy%20crop%20of%20leading%20stocks%20hitting%20new%20highs,%20so%20the%20recent%20improvement%20in%20leadership%20was%20a%20reassuring%20sign.) 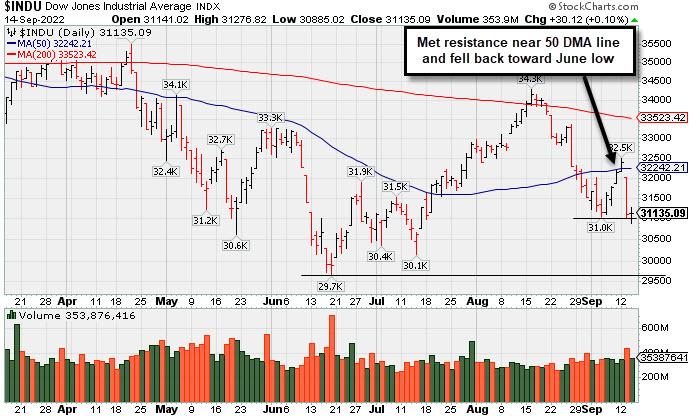 PICTURED: The Dow Jones Industrial Average met resistance near its 50-day moving average (DMA) line and slumped back toward the June low with a big loss on higher volume.
U.S. equities finished higher in volatile trading Wednesday as Wall Street rebounded from its worst day since June 2020. Investors also assessed the latest round of inflation data. Yesterday, the Consumer Price Index (CPI) came in hotter than expected, climbing 0.1% in the month of August, while the headline figure remained elevated at 8.3%, well above the Federal Reserve’s (Fed) 2% target. Today, the Producer Price Index (PPI) fell 0.1% in August, in line with estimates, while the headline figure climbed at a still elevated 8.7% year-over-year pace, moderating from the previous 9.8% annual increase. Core PPI (excluding the more volatile food and energy components) jumped 7.3% year-over-year, compared to July’s upwardly revised 7.7% annual clip.
Shorter-dated Treasuries weakened, with the yield on the two-year note adding four basis points (0.04%) to 3.79%, its highest since 2007. Longer-dated Treasury yields fell, with the yield on the benchmark 10-year note dipping one basis point (0.01%) to 3.41%, while the 30-year bond yield shed three basis points (0.03%) to 3.47%. In commodities, West Texas Intermediate (WTI) crude climbed 1.6% to $88.69/barrel following a report from the International Energy Agency (IEA) and news of loosening COVID-19 restrictions in China. As one of the world’s largest consumers of oil, China’s recent restrictions have kept a cap on oil prices. Meanwhile, the U.S. government has announced they are considering refilling the Strategic Petroleum Reserve if prices slide below $80/barrel. A gauge of the U.S. dollar slipped 0.1%, adding further support to oil prices. |
 Kenneth J. Gruneisen started out as a licensed stockbroker in August 1987, a couple of months prior to the historic stock market crash that took the Dow Jones Industrial Average down -22.6% in a single day. He has published daily fact-based fundamental and technical analysis on high-ranked stocks online for two decades. Through FACTBASEDINVESTING.COM, Kenneth provides educational articles, news, market commentary, and other information regarding proven investment systems that work in good times and bad.
Comments contained in the body of this report are technical opinions only and are not necessarily those of Gruneisen Growth Corp. The material herein has been obtained from sources believed to be reliable and accurate, however, its accuracy and completeness cannot be guaranteed. Our firm, employees, and customers may effect transactions, including transactions contrary to any recommendation herein, or have positions in the securities mentioned herein or options with respect thereto. Any recommendation contained in this report may not be suitable for all investors and it is not to be deemed an offer or solicitation on our part with respect to the purchase or sale of any securities. |
|
 |
Energy-Linked Groups Led Retail and Tech Indexes Higher
Kenneth J. Gruneisen - Passed the CAN SLIM® Master's Exam
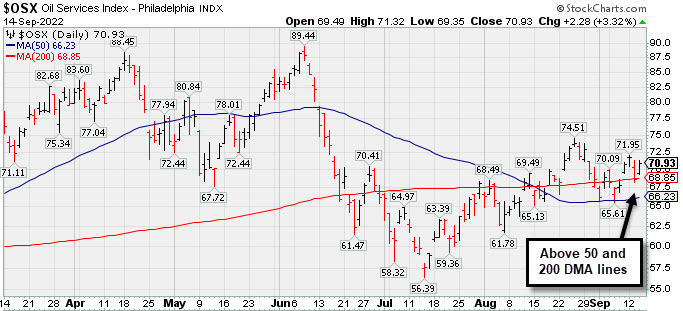
The Retail Index ($RLX +0.50%) and Broker/Dealer Index ($XBD +0.26%) each posted a small gain while the Bank Index ($BKX -0.50%) edged lower. The tech sector had a positive bias as the Semiconductor Index ($SOX +1.14%) and Networking Index ($NWX +1.13%) noted solid gains while the Biotech Index ($BTK +0.39%) posted a smaller gain. Energy-linked groups posted solid gain as the Oil Services Index ($OSX +3.32%) and Integrated Oil Index ($XOI +2.40%), meanwhile the Gold & Silver Index ($XAU -0.12%) finished slightly in the red.
PICTURED: The Oil Services Index ($OSX +3.32%) has recently been consolidating above its 50-day and 200-day moving average (DMA) lines.
| Oil Services |
$OSX |
70.93 |
+2.28 |
+3.32% |
+34.54% |
| Integrated Oil |
$XOI |
1,672.82 |
+39.17 |
+2.40% |
+41.98% |
| Semiconductor |
$SOX |
2,591.51 |
+29.24 |
+1.14% |
-34.33% |
| Networking |
$NWX |
803.24 |
+8.94 |
+1.13% |
-17.28% |
| Broker/Dealer |
$XBD |
445.24 |
+1.13 |
+0.26% |
-8.55% |
| Retail |
$RLX |
3,230.00 |
+16.14 |
+0.50% |
-23.58% |
| Gold & Silver |
$XAU |
102.26 |
-0.12 |
-0.12% |
-22.79% |
| Bank |
$BKX |
106.26 |
-0.53 |
-0.50% |
-19.63% |
| Biotech |
$BTK |
4,762.88 |
+18.27 |
+0.39% |
-13.69% |
|
|
|
 |
Consolidating Near High Well Above 50-Day Moving Average
Kenneth J. Gruneisen - Passed the CAN SLIM® Master's Exam
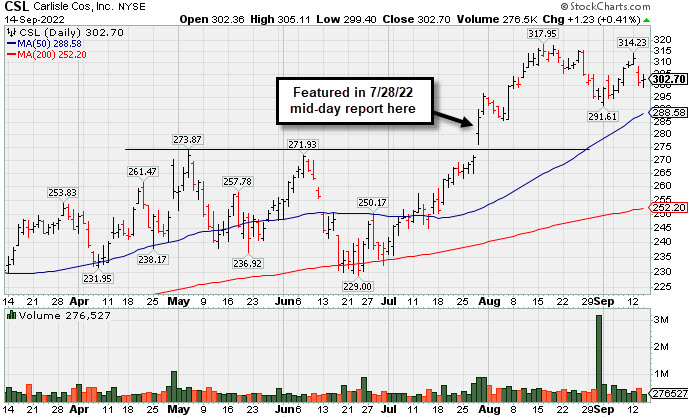
Carlisle Cos Inc (CSL +$1.23 or +0.41% to $302.70) has been consolidating near its all-time high. Its prior low $291 defines near term support to watch above its 50-day moving average (DMA) line ($289).
Bullish action continued since highlighted in yellow in the 7/28/22 mid-day report (read here) with pivot point cited based on its 5/04/22 high plus 10 cents. CSL was last shown in detail in this FSU section on 8/22/22 with an annotated graph under the headline, "Pulling Back From All-Time High After Volume-Driven Gains".
CSL has a 97 Earnings Per Share Rating. It recently reported Jun '22 quarterly earnings +185% on +57% sales revenues versus the year ago period, its 4th very strong quarter well above the +25% minimum earnings guideline (C criteria). Annual earnings (A criteria) history included a small downturn in FY '20 that was previously noted.
There are 51.7 million shares outstanding, which can contribute to greater price volatility in the event of institutional buying or selling. The number of top-rated funds owning its shares rose from 772 in Sep '21 to 839 in Jun '22, a reassuring sign concerning the I criteria. Its current Up/Down Volume Ratio of 2.5 is an unbiased indication its shares have been under accumulation over the past 50 days.
|
|
|
Color Codes Explained :
Y - Better candidates highlighted by our
staff of experts.
G - Previously featured
in past reports as yellow but may no longer be buyable under the
guidelines.
***Last / Change / Volume data in this table is the closing quote data***
Symbol/Exchange
Company Name
Industry Group |
PRICE |
CHANGE
(%Change) |
Day High |
Volume
(% DAV)
(% 50 day avg vol) |
52 Wk Hi
% From Hi |
Featured
Date |
Price
Featured |
Pivot Featured |
|
Max Buy |
 CI
-
NYSE
CI
-
NYSE
Cigna Corp
Medical-Managed Care
|
$284.08
|
-2.74
-0.96% |
$289.29
|
2,454,326
125.16% of 50 DAV
50 DAV is 1,961,000
|
$296.29
-4.12%
|
7/7/2022
|
$276.55
|
PP = $273.68
|
|
MB = $287.36
|
Most Recent Note - 9/12/2022 12:39:36 PM
G - Inching higher today for a 4th consecutive small gain, rising above its "max buy" level. Reported earnings for the Jun '22 quarter rose +19% on +5% sales revenues versus the year ago period, breaking a streak of 3 quarterly earnings increases above the +25% minimum guideline (C criteria), raising fundamental concerns. Near-term support to watch is at its 50 DMA line ($281).
>>> FEATURED STOCK ARTICLE : Cigna Hovering Near High Despite Earnings Under +25% Minimum - 8/26/2022 |
View all notes |
Set NEW NOTE alert |
Company Profile |
SEC
News |
Chart |
Request a new note
C
A
S
I |
ESQ
-
NASDAQ
Esquire Financial Holdings
Finance-Commercial Loans
|
$38.49
|
+0.10
0.26% |
$38.82
|
21,676
79.40% of 50 DAV
50 DAV is 27,300
|
$41.68
-7.65%
|
7/26/2022
|
$37.74
|
PP = $39.19
|
|
MB = $41.15
|
Most Recent Note - 9/12/2022 4:51:32 PM
Y - Posted a 4th consecutive gain today after recently finding support near its 50 DMA line ($36.89). Confirming gains above the pivot point backed by at least +40% above average volume would be a reassuring sign of fresh institutional buying.
>>> FEATURED STOCK ARTICLE : Testing 50-Day Moving Average With 5th Straight Loss - 9/1/2022 |
View all notes |
Set NEW NOTE alert |
Company Profile |
SEC
News |
Chart |
Request a new note
C
A
S
I |
GPK
-
NYSE
Graphic Packaging Hldg
CONSUMER NON-DURABLES - Packaging and Containers
|
$22.70
|
-0.25
-1.07% |
$23.06
|
2,078,031
75.24% of 50 DAV
50 DAV is 2,762,000
|
$24.07
-5.69%
|
7/26/2022
|
$22.63
|
PP = $23.09
|
|
MB = $24.24
|
Most Recent Note - 9/13/2022 6:00:59 PM
Y - Pulled back quietly today after wedging to a new 52-week high with the prior gain lacking great volume conviction. Near-term support to watch is at its 50 DMA line ($22.25).
>>> FEATURED STOCK ARTICLE : Recently Slipped Below Pivot Point Testing 50-Day Average - 9/6/2022 |
View all notes |
Set NEW NOTE alert |
Company Profile |
SEC
News |
Chart |
Request a new note
C
A
S
I |
CSL
-
NYSE
Carlisle Cos Inc
Diversified Operations
|
$302.70
|
+1.23
0.41% |
$305.12
|
276,527
58.46% of 50 DAV
50 DAV is 473,000
|
$318.71
-5.02%
|
7/28/2022
|
$282.31
|
PP = $275.23
|
|
MB = $288.99
|
 Most Recent Note - 9/14/2022 8:55:19 PM
G - Consolidating near its all-time high. Its prior low $291 defines near term support to watch above its 50 DMA line ($289). See the latest FSU analysis for more details and a new annotated graph.
>>> FEATURED STOCK ARTICLE : Consolidating Near High Well Above 50-Day Moving Average - 9/14/2022 |
View all notes |
Set NEW NOTE alert |
Company Profile |
SEC
News |
Chart |
Request a new note
C
A
S
I |
ENPH
-
NASDAQ
Enphase Energy Inc
Energy-Solar
|
$320.62
|
+15.12
4.95% |
$320.97
|
4,221,766
118.16% of 50 DAV
50 DAV is 3,573,000
|
$324.84
-1.30%
|
7/28/2022
|
$276.66
|
PP = $282.55
|
|
MB = $296.68
|
Most Recent Note - 9/14/2022 8:36:56 PM
G - Posted a solid gain today for a best-ever close. Held its ground near its all-time high after a volume-driven breakout gain on 9/07/22 following a brief consolidation. Recent lows in the $271-272 area define initial support above its 50 DMA line ($267). Fundamentals remain strong.
>>> FEATURED STOCK ARTICLE : High-Ranked Solar Energy Firm Hovering Near All-Time High - 9/13/2022 |
View all notes |
Set NEW NOTE alert |
Company Profile |
SEC
News |
Chart |
Request a new note
C
A
S
I |
Symbol/Exchange
Company Name
Industry Group |
PRICE |
CHANGE
(%Change) |
Day High |
Volume
(% DAV)
(% 50 day avg vol) |
52 Wk Hi
% From Hi |
Featured
Date |
Price
Featured |
Pivot Featured |
|
Max Buy |
PWR
-
NYSE
Quanta Services Inc
MATERIALS and CONSTRUCTION - General Contractors
|
$142.37
|
+0.92
0.65% |
$143.21
|
1,565,482
154.39% of 50 DAV
50 DAV is 1,014,000
|
$149.33
-4.66%
|
7/28/2022
|
$141.83
|
PP = $140.14
|
|
MB = $147.15
|
Most Recent Note - 9/13/2022 6:03:02 PM
Y - Confirming volume-driven gains for new highs would be a reassuring sign of fresh institutional buying demand. It is quietly consolidating above its 50 DMA line ($137.78) which defines important near-term support to watch. Fundamentals remain strong.
>>> FEATURED STOCK ARTICLE : Consolidating Near Prior Highs and Above 50-Day Moving Average - 9/7/2022 |
View all notes |
Set NEW NOTE alert |
Company Profile |
SEC
News |
Chart |
Request a new note
C
A
S
I |
GFF
-
NYSE
Griffon Corporation
MATERIALS and CONSTRUCTION - General Building Materials
|
$32.71
|
+0.46
1.43% |
$33.29
|
337,799
87.51% of 50 DAV
50 DAV is 386,000
|
$34.92
-6.33%
|
8/8/2022
|
$32.46
|
PP = $31.12
|
|
MB = $32.68
|
Most Recent Note - 9/13/2022 5:55:08 PM
Y - Gapped down retreating from its all-time high with today's loss backed by below average volume. Color code is changed to yellow after pulling back below its "max buy" level. Prior lows and its 50 DMA line define important near-term support in the $30 area.
>>> FEATURED STOCK ARTICLE : Best Ever Close With Gain on Lighter Volume - 8/25/2022 |
View all notes |
Set NEW NOTE alert |
Company Profile |
SEC
News |
Chart |
Request a new note
C
A
S
I |
CLH
-
NYSE
Clean Harbors Inc
Pollution Control
|
$120.57
|
+0.79
0.66% |
$122.07
|
588,232
177.18% of 50 DAV
50 DAV is 332,000
|
$124.49
-3.15%
|
8/10/2022
|
$111.78
|
PP = $115.10
|
|
MB = $120.86
|
Most Recent Note - 9/14/2022 12:34:41 PM
G - Perched near its all-time high following volume-driven gains. Prior high in the $115 area defines important near-term support to watch. No resistance remains due to overhead supply. Fundamentals remain strong.
>>> FEATURED STOCK ARTICLE : Quietly Consolidating Below "Max Buy" Level After Breakout - 8/29/2022 |
View all notes |
Set NEW NOTE alert |
Company Profile |
SEC
News |
Chart |
Request a new note
C
A
S
I |
CASY
-
NASDAQ
Caseys General Stores
RETAIL - Super/Mini Markets
|
$214.82
|
+0.12
0.06% |
$216.42
|
293,392
111.98% of 50 DAV
50 DAV is 262,000
|
$223.90
-4.06%
|
9/8/2022
|
$217.81
|
PP = $222.40
|
|
MB = $233.52
|
Most Recent Note - 9/13/2022 6:08:26 PM
Y - Ended near the low end of its intra-day range with a 2nd consecutive loss after failing to close above the pivot point and clinch a proper technical buy signal. Fundamentals remain strong.
>>> FEATURED STOCK ARTICLE : Casey's is Perched Within Close Range of All-Time High - 9/9/2022 |
View all notes |
Set NEW NOTE alert |
Company Profile |
SEC
News |
Chart |
Request a new note
C
A
S
I |
CPRX
-
NASDAQ
Catalyst Pharma Inc
Medical-Biomed/Biotech
|
$15.52
|
+0.22
1.44% |
$15.82
|
28,325,610
1,018.17% of 50 DAV
50 DAV is 2,782,000
|
$17.22
-9.87%
|
9/8/2022
|
$15.14
|
PP = $15.17
|
|
MB = $15.93
|
Most Recent Note - 9/14/2022 12:40:46 PM
G - Rising today after hitting a new 52-week high on the prior session and trading above its "max buy" level but ending in the lower part of its intra-day range. Highlighted in yellow with pivot point cited based on its 8/23/22 high plus 10 cents in the 9/08/22 mid-day report. Reported Jun '22 quarterly earnings +75% on +46% sales revenues versus the year ago period, its 3rd consecutive quarterly comparison above the +25% minimum earnings guideline (C criteria). Annual earnings (A criteria) growth has been strong since turning profitable in FY '19.
>>> FEATURED STOCK ARTICLE : Hit a New High After a 4-Week Tight Pattern of Closes - 9/8/2022 |
View all notes |
Set NEW NOTE alert |
Company Profile |
SEC
News |
Chart |
Request a new note
C
A
S
I |
Symbol/Exchange
Company Name
Industry Group |
PRICE |
CHANGE
(%Change) |
Day High |
Volume
(% DAV)
(% 50 day avg vol) |
52 Wk Hi
% From Hi |
Featured
Date |
Price
Featured |
Pivot Featured |
|
Max Buy |
CCRN
-
NASDAQ
Cross Country Healthcare
DIVERSIFIED SERVICES - Staffing and Outsourcing Service
|
$28.75
|
+2.15
8.08% |
$30.47
|
2,238,030
264.54% of 50 DAV
50 DAV is 846,000
|
$30.51
-5.77%
|
9/9/2022
|
$27.32
|
PP = $30.61
|
|
MB = $32.14
|
Most Recent Note - 9/14/2022 12:33:47 PM
Y - Today's big volume-driven gain is challenging prior highs. It has been consolidating above its 50 DMA line ($25.20) which defines important support to watch. Recently reported insider buying is a reassuring sign. Highlighted in yellow with pivot point cited based on its 7/21/22 high plus 10 cents in the 9/09/22 mid-day report and noted - "Subsequent gains above the pivot point backed by at least +40% above average volume may trigger a technical buy signal. See the latest FSU analysis for more details and a new annotated graph."
>>> FEATURED STOCK ARTICLE : Positive Reversal While Consolidating Above 50-Day Moving Average - 9/12/2022 |
View all notes |
Set NEW NOTE alert |
Company Profile |
SEC
News |
Chart |
Request a new note
C
A
S
I |
|
|
|
THESE ARE NOT BUY RECOMMENDATIONS!
Comments contained in the body of this report are technical
opinions only. The material herein has been obtained
from sources believed to be reliable and accurate, however,
its accuracy and completeness cannot be guaranteed.
This site is not an investment advisor, hence it does
not endorse or recommend any securities or other investments.
Any recommendation contained in this report may not
be suitable for all investors and it is not to be deemed
an offer or solicitation on our part with respect to
the purchase or sale of any securities. All trademarks,
service marks and trade names appearing in this report
are the property of their respective owners, and are
likewise used for identification purposes only.
This report is a service available
only to active Paid Premium Members.
You may opt-out of receiving report notifications
at any time. Questions or comments may be submitted
by writing to Premium Membership Services 665 S.E. 10 Street, Suite 201 Deerfield Beach, FL 33441-5634 or by calling 1-800-965-8307
or 954-785-1121.
|
|
|