You are not logged in.
This means you
CAN ONLY VIEW reports that were published prior to Monday, April 7, 2025.
You
MUST UPGRADE YOUR MEMBERSHIP if you want to see any current reports.
AFTER MARKET UPDATE - THURSDAY, AUGUST 28TH, 2014
Previous After Market Report Next After Market Report >>>
|
|
|
|
DOW |
-42.44 |
17,079.57 |
-0.25% |
|
Volume |
479,037,620 |
-2% |
|
Volume |
1,192,741,720 |
-7% |
|
NASDAQ |
-11.93 |
4,557.69 |
-0.26% |
|
Advancers |
1,269 |
40% |
|
Advancers |
910 |
32% |
|
S&P 500 |
-3.38 |
1,996.74 |
-0.17% |
|
Decliners |
1,750 |
55% |
|
Decliners |
1,784 |
63% |
|
Russell 2000 |
-6.76 |
1,165.95 |
-0.58% |
|
52 Wk Highs |
135 |
|
|
52 Wk Highs |
45 |
|
|
S&P 600 |
-4.10 |
667.74 |
-0.61% |
|
52 Wk Lows |
10 |
|
|
52 Wk Lows |
41 |
|
|
 |
Major Indices Pulled Back With Lighter Volume Totals
Kenneth J. Gruneisen - Passed the CAN SLIM® Master's Exam
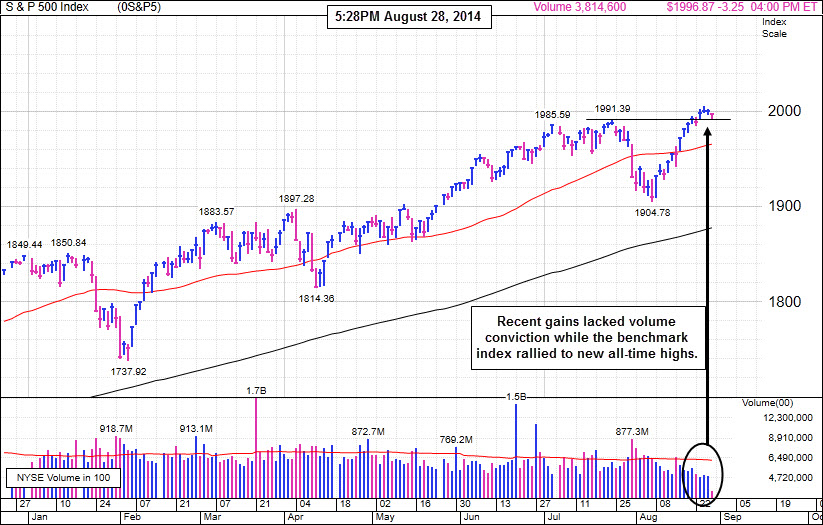
The major averages ended lower on Thursday, however the volume totals were lighter on the NYSE and on the Nasdaq exchange, indicating no increase in selling pressure coming from the institutional crowd. Breadth was negative as decliners led advancers by about a 3-2 margin on the NYSE and by 2-1 on the NASDAQ exchange. Leadership contracted as there were 24 high-ranked companies from the CANSLIM.net Leaders List that made new 52-week highs and appeared on the CANSLIM.net BreakOuts Page, down from the prior session total of 45 stocks. New 52-week highs solidly outnumbered new 52-week lows on the NYSE, but the new high/low totals were close to even on the Nasdaq exchange. There were gains for only 2 of the 12 of the high-ranked companies currently included on the Featured Stocks Page. The broader market (M criteria) has been in a "confirmed uptrend" while leadership (stocks hitting new 52-week highs) has remained healthy. Remember that disciplined investors buy stocks with superior fundamentals only after they have triggered a proper technical buy signal.
PICTURED: The benchmark S&P 500 Index recently rallied to new all-time highs with gains lacking great volume conviction.
The major averages experienced a pullback amid renewed tension in Eastern Europe. U.S. equities followed overseas markets lower after Ukraine said Russian troops crossed its border. The uptick in geopolitical concerns offset positive readings on the U.S. economy. Before the open, second quarter GDP was revised up to a 4.2% annualized rate from 4.0%. Additional releases revealed weekly jobless claims dipped 1,000 to 298,000 and pending home sales unexpectedly rose 3.3% in July.
Financials were the worst performing sector on the session. J.P. Morgan Chase & Co (JPM -0.7%) and Citigroup (C -0.9%) fell after the FBI said it was investigating reports of cyber-attacks on U.S. banks by Russian hackers. Retailers also weighed on the market. Williams-Sonoma (WSM -12%) slumped and Guess (GES -8.8%) dropped after both companies reduced their guidance. Utilities and materials helped mute the decline. Consolidated Edison (ED +0.21%) rose and Newmont Mining (NEM +1.28%) climbed as the price of gold advanced.
Trading was subdued ahead of the Labor Day weekend. Treasuries were higher on the session. Benchmark 10-year notes gained 6/32 to yield 2.33%. In commodity trading, gold rose 0.5% to $1,289.30 an ounce on the COMEX. WTI crude oil increased 0.8% to $94.66 a barrel.
The CANSLIM.net Featured Stocks Page shows the most action-worthy candidates and their latest notes and a Headline Link directs members to the latest detailed analysis with data-packed graphs annotated by a Certified expert along with links to additional resources. The Premium Member Homepage includes "dynamic archives" to all prior pay reports published.
|
 Kenneth J. Gruneisen started out as a licensed stockbroker in August 1987, a couple of months prior to the historic stock market crash that took the Dow Jones Industrial Average down -22.6% in a single day. He has published daily fact-based fundamental and technical analysis on high-ranked stocks online for two decades. Through FACTBASEDINVESTING.COM, Kenneth provides educational articles, news, market commentary, and other information regarding proven investment systems that work in good times and bad.
Comments contained in the body of this report are technical opinions only and are not necessarily those of Gruneisen Growth Corp. The material herein has been obtained from sources believed to be reliable and accurate, however, its accuracy and completeness cannot be guaranteed. Our firm, employees, and customers may effect transactions, including transactions contrary to any recommendation herein, or have positions in the securities mentioned herein or options with respect thereto. Any recommendation contained in this report may not be suitable for all investors and it is not to be deemed an offer or solicitation on our part with respect to the purchase or sale of any securities. |
|
 |
Gold & Silver Index Rose While Most Groups Were Quiet
Kenneth J. Gruneisen - Passed the CAN SLIM® Master's Exam
Financial shares had a slightly negative bias as the Bank Index ($BKX -0.53%) and the Broker/Dealer Index ($XBD -0.40%) fell while the Retail Index ($RLX -0.09%) finished flat. The Biotechnology Index ($BTK -0.50%) suffered a small loss while the Networking Index ($NWX +0.07%) finished flat and the Semiconductor Index ($SOX +0.30%) eked out a small gain. The Oil Services Index ($OSX -0.12%) and the Integrated Oil Index ($XOI +0.07%) were little changed.
Charts courtesy www.stockcharts.com
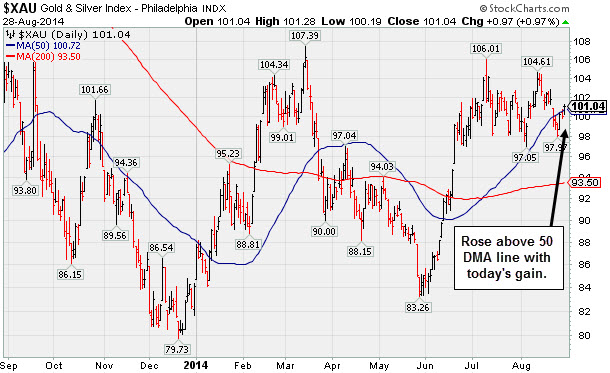
PICTURED: The Gold & Silver Index ($XAU +0.97%) was a standout gainer on Thursday as a gain helped it rebound above its 50-day moving average (DMA) line.
| Oil Services |
$OSX |
293.04 |
-0.36 |
-0.12% |
+4.27% |
| Integrated Oil |
$XOI |
1,680.31 |
+1.25 |
+0.07% |
+11.79% |
| Semiconductor |
$SOX |
640.49 |
+1.92 |
+0.30% |
+19.71% |
| Networking |
$NWX |
336.54 |
+0.24 |
+0.07% |
+3.89% |
| Broker/Dealer |
$XBD |
166.32 |
-0.66 |
-0.40% |
+3.59% |
| Retail |
$RLX |
955.84 |
-0.90 |
-0.09% |
+1.71% |
| Gold & Silver |
$XAU |
101.04 |
+0.97 |
+0.97% |
+20.07% |
| Bank |
$BKX |
71.14 |
-0.38 |
-0.53% |
+2.71% |
| Biotech |
$BTK |
3,081.93 |
-15.49 |
-0.50% |
+32.25% |
|
|
|
 |
Quietly Perched Within Striking Distance of 52-Week High
Kenneth J. Gruneisen - Passed the CAN SLIM® Master's Exam
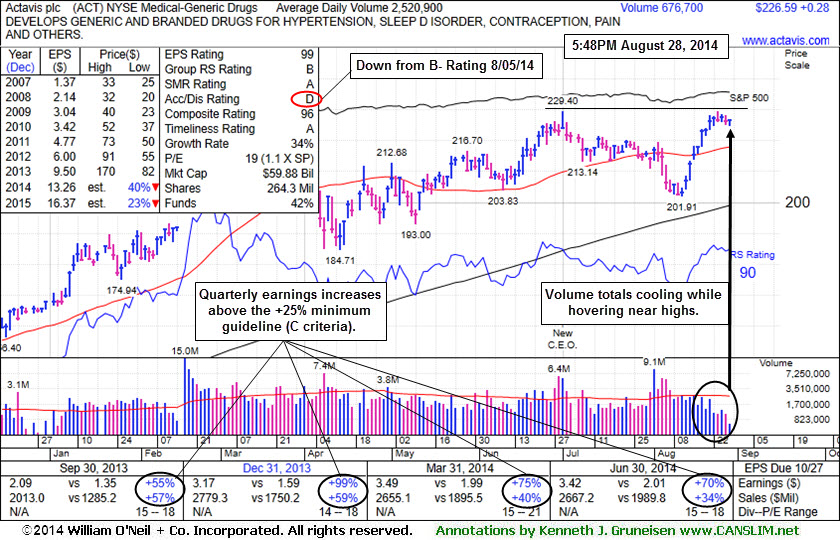
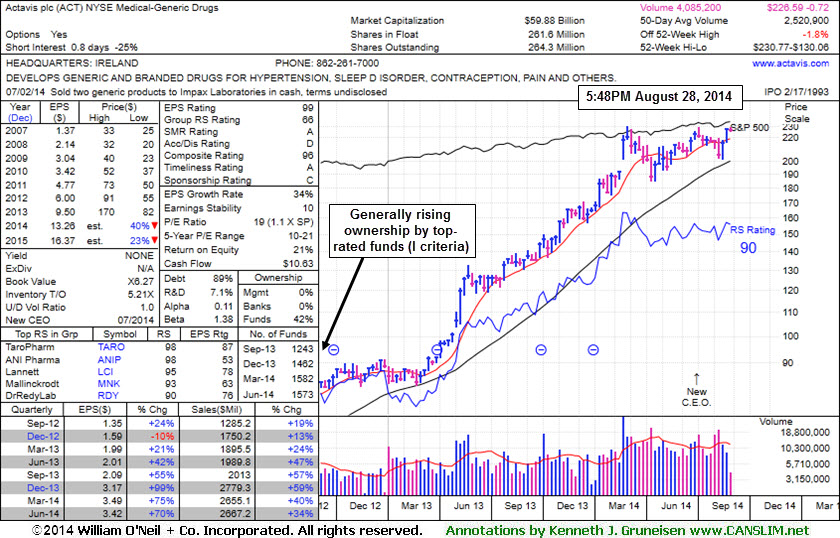
Atavis plc (ACT +$0.28 or +0.12% to $226.59) is perched within close striking distance of prior highs and its 52-week high, and volume totals have been quiet indicating that very few investors have been headed for the exit. However, its Accumulation/Distribution Rating has slumped to a D from a B- when last shown in this FSU section on 8/05/14 with annotated graphs under the headline, "Enduring Distributional Pressure While Sputtering Near 50-Day Average". Its streak of gains and rebound above its 50-day moving average (DMA) line helped its outlook improve.
ACT was highlighted in yellow in the 6/20/14 mid-day report (read here) with a pivot point based on its 2/26/14 high plus 10 cents (not shown on the daily graph below - it is covered by the data block). Subsequent volume-driven gains should be backed by at least +40% above average volume as it hits new highs to trigger a proper technical buy signal.
The Medical - Generic Drugs industry group currently has a 66 Group Relative Strength Rating, down from a 90 when shown on 8/05/14. However leadership from other issues is still a reassuring sign concerning the L criteria. It reported earnings +70% on +34% sales revenues for the Jun '14 quarter, and its strong record satisfies the C criteria. Its annual earnings (A criteria) history has also been strong. The number of top-rated funds owning its shares rose from 1,236 in Jun '13 to 1,573 in Jun '14, a reassuring sign concerning the I criteria.
|
|
|
Color Codes Explained :
Y - Better candidates highlighted by our
staff of experts.
G - Previously featured
in past reports as yellow but may no longer be buyable under the
guidelines.
***Last / Change / Volume data in this table is the closing quote data***
Symbol/Exchange
Company Name
Industry Group |
PRICE |
CHANGE
(%Change) |
Day High |
Volume
(% DAV)
(% 50 day avg vol) |
52 Wk Hi
% From Hi |
Featured
Date |
Price
Featured |
Pivot Featured |
|
Max Buy |
ACT
-
NYSE
Actavis plc
Medical-Generic Drugs
|
$226.59
|
+0.28
0.12% |
$227.06
|
678,032
26.91% of 50 DAV
50 DAV is 2,520,000
|
$230.77
-1.81%
|
6/20/2014
|
$216.53
|
PP = $230.87
|
|
MB = $242.41
|
 Most Recent Note - 8/28/2014 6:16:40 PM
Y - Quietly perched near its 52-week high today trading very light volume. Subsequent volume-driven gains to new highs may trigger a technical buy signal. See the latest FSU analysis for more details and new annotated graphs.
>>> FEATURED STOCK ARTICLE : Quietly Perched Within Striking Distance of 52-Week High - 8/28/2014
View all notes |
Set NEW NOTE alert |
CANSLIM.net Company Profile |
SEC
News |
Chart |
Request a new note
C
A N
S L
I M


|
AFSI
-
NASDAQ
Amtrust Financial Svcs
INSURANCE - Property and; Casualty Insurance
|
$44.04
|
-0.21
-0.47% |
$44.38
|
508,112
106.75% of 50 DAV
50 DAV is 476,000
|
$47.10
-6.50%
|
5/21/2014
|
$44.85
|
PP = $44.85
|
|
MB = $47.09
|
Most Recent Note - 8/28/2014 6:18:32 PM
G - Consolidating above support at its 50 DMA line, still only -6.5% off its 52-week high. Relative Strength Rating has slumped to 69, below the 80+ minimum guideline for buy candidates. Faces resistance due to overhead supply up through the $47 level.
>>> FEATURED STOCK ARTICLE : Relative Strength Rating Slumped While Building Longer Base - 8/18/2014
View all notes |
Set NEW NOTE alert |
CANSLIM.net Company Profile |
SEC
News |
Chart |
Request a new note
C
A N
S L
I M
|
BITA
-
NYSE
Bitauto Hldgs Ltd Ads
Internet-Content
|
$87.36
|
-1.68
-1.89% |
$90.59
|
2,418,680
184.21% of 50 DAV
50 DAV is 1,313,000
|
$98.28
-11.11%
|
6/26/2014
|
$46.20
|
PP = $47.03
|
|
MB = $49.38
|
Most Recent Note - 8/28/2014 12:01:51 PM
G - Finished near the session low with a loss on heavy volume on the prior session and enduring more distributional pressure today. Previously noted with caution - "Has the look of a "climax run" with volume-driven gains getting very extended from its prior base." See the latest FSU analysis for more details and annotated graphs.
>>> FEATURED STOCK ARTICLE : Finished Near Session Low - Noted With Look of "Climax Run" - 8/27/2014
View all notes |
Set NEW NOTE alert |
CANSLIM.net Company Profile |
SEC
News |
Chart |
Request a new note
C
A N
S L
I M
|
EQM
-
NYSE
E Q T Midstream Partners
ENERGY - Oil and Gas Pipelines
|
$97.13
|
-1.01
-1.03% |
$98.47
|
103,949
34.31% of 50 DAV
50 DAV is 303,000
|
$102.51
-5.25%
|
12/12/2013
|
$53.17
|
PP = $56.51
|
|
MB = $59.34
|
Most Recent Note - 8/25/2014 3:29:15 PM
G - Rebounding above its 50 DMA line today helping its technical stance improve. Reported earnings +37% on +21% sales revenues for the Jun '14 quarter, an improvement after 2 sub par quarterly earnings comparisons.
>>> FEATURED STOCK ARTICLE : Following 50-Day Moving Average Violation Gains Lacked Volume - 8/7/2014
View all notes |
Set NEW NOTE alert |
CANSLIM.net Company Profile |
SEC
News |
Chart |
Request a new note
C
A N
S L
I M
|
FB
-
NASDAQ
Facebook Inc Cl A
INTERNET
|
$73.86
|
-0.78
-1.04% |
$74.43
|
21,914,557
56.34% of 50 DAV
50 DAV is 38,899,000
|
$76.74
-3.76%
|
7/24/2014
|
$76.00
|
PP = $72.69
|
|
MB = $76.32
|
Most Recent Note - 8/25/2014 3:30:40 PM
Y - Volume totals have cooled while consolidating in a tight range, stubbornly holding its ground since gapping up on 7/24/14. Prior highs in the $72 area define initial support above its 50 DMA line ($69.93).
>>> FEATURED STOCK ARTICLE : Making Limited Headway But Holding Ground Since Gap Up - 8/20/2014
View all notes |
Set NEW NOTE alert |
CANSLIM.net Company Profile |
SEC
News |
Chart |
Request a new note
C
A N
S L
I M
|
Symbol/Exchange
Company Name
Industry Group |
PRICE |
CHANGE
(%Change) |
Day High |
Volume
(% DAV)
(% 50 day avg vol) |
52 Wk Hi
% From Hi |
Featured
Date |
Price
Featured |
Pivot Featured |
|
Max Buy |
PANW
-
NYSE
Palo Alto Networks
Computer Sftwr-Security
|
$82.26
|
-0.15
-0.18% |
$83.23
|
1,750,392
128.89% of 50 DAV
50 DAV is 1,358,000
|
$87.79
-6.30%
|
7/30/2014
|
$84.21
|
PP = $85.88
|
|
MB = $90.17
|
Most Recent Note - 8/28/2014 12:23:25 PM
Y - Undercut its 50 DMA line ($81.16) earlier today yet it rebounded and is trading near the session high. A damaging violation may trigger a technical sell signal. Did not tally volume-driven gains above the new pivot point cited to trigger a proper new (or add-on) technical buy signal. Due to report earnings on 9/09/14.
>>> FEATURED STOCK ARTICLE : Building on New Base Pattern Above 50-Day Average - 8/11/2014
View all notes |
Set NEW NOTE alert |
CANSLIM.net Company Profile |
SEC
News |
Chart |
Request a new note
C
A N
S L
I M
|
STRT
-
NASDAQ
Strattec Security Corp
AUTOMOTIVE - Auto Parts
|
$77.90
|
-0.20
-0.26% |
$78.62
|
20,836
71.85% of 50 DAV
50 DAV is 29,000
|
$78.52
-0.79%
|
8/22/2014
|
$71.47
|
PP = $73.97
|
|
MB = $77.67
|
Most Recent Note - 8/27/2014 12:38:44 PM
Y - Perched at its 52-week high and rallying further above its pivot point with today's 5th consecutive gain, however recent volume totals have been near average or below average. Gains should be backed by volume at least +40% above average to trigger a proper technical buy signal. Highlighted in yellow with pivot point based on its 6/06/14 high plus 10 cents in the 8/22/14 mid-day report (read here).
>>> FEATURED STOCK ARTICLE : Small Supply of Shares and Perched Near All-Time Highs - 8/22/2014
View all notes |
Set NEW NOTE alert |
CANSLIM.net Company Profile |
SEC
News |
Chart |
Request a new note
C
A N
S L
I M
|
TARO
-
NYSE
Taro Pharmaceutical Inds
DRUGS - Drug Manufacturers - Other
|
$160.73
|
-1.39
-0.86% |
$163.94
|
87,986
112.80% of 50 DAV
50 DAV is 78,000
|
$164.00
-1.99%
|
7/30/2014
|
$144.24
|
PP = $149.99
|
|
MB = $157.49
|
Most Recent Note - 8/28/2014 6:19:41 PM
G - Stubbornly holding its ground near its 52-week high. Recently reported earnings for the Jun '14 quarter below the +25% minimum earnings guideline (C criteria) raising fundamental concerns.
>>> FEATURED STOCK ARTICLE : Still Building on an Advanced Base Pattern - 8/6/2014
View all notes |
Set NEW NOTE alert |
CANSLIM.net Company Profile |
SEC
News |
Chart |
Request a new note
C
A N
S L
I M
|
TRN
-
NYSE
Trinity Industries Inc
TRANSPORTATION - Railroads
|
$48.01
|
-0.72
-1.48% |
$48.44
|
2,628,216
100.66% of 50 DAV
50 DAV is 2,611,000
|
$49.17
-2.36%
|
4/30/2014
|
$37.79
|
PP = $38.03
|
|
MB = $39.93
|
Most Recent Note - 8/25/2014 3:32:30 PM
G - Hitting another new 52-week high with today's 6th consecutive gain. It has not formed a sound base.
>>> FEATURED STOCK ARTICLE : Rallying Into New High Territory Without Forming New Base - 8/25/2014
View all notes |
Set NEW NOTE alert |
CANSLIM.net Company Profile |
SEC
News |
Chart |
Request a new note
C
A N
S L
I M
|
UA
-
NYSE
Under Armour Inc Cl A
CONSUMER NON-DURABLES - Textile - Apparel Clothing
|
$69.68
|
-0.38
-0.54% |
$69.85
|
1,559,602
66.85% of 50 DAV
50 DAV is 2,333,000
|
$71.79
-2.94%
|
7/10/2014
|
$58.50
|
PP = $60.79
|
|
MB = $63.83
|
Most Recent Note - 8/25/2014 3:33:55 PM
G - Stubbornly holding its ground near its all-time high and no resistance remains due to overhead supply. Recently reported earnings +0% on +34% sales revenues for the Jun '14 quarter, below the +25% minimum earnings guideline (C criteria), yet the company raised its guidance.
>>> FEATURED STOCK ARTICLE : Holding Ground Near All-Time Highs Despite Fundamental Concerns - 8/26/2014
View all notes |
Set NEW NOTE alert |
CANSLIM.net Company Profile |
SEC
News |
Chart |
Request a new note
C
A N
S L
I M
|
Symbol/Exchange
Company Name
Industry Group |
PRICE |
CHANGE
(%Change) |
Day High |
Volume
(% DAV)
(% 50 day avg vol) |
52 Wk Hi
% From Hi |
Featured
Date |
Price
Featured |
Pivot Featured |
|
Max Buy |
WLK
-
NYSE
Westlake Chemical Corp
CHEMICALS - Specialty Chemicals
|
$96.09
|
+0.46
0.48% |
$96.40
|
244,381
47.36% of 50 DAV
50 DAV is 516,000
|
$95.69
0.42%
|
4/29/2014
|
$72.79
|
PP = $69.31
|
|
MB = $72.78
|
Most Recent Note - 8/26/2014 5:33:32 PM
G - Perched at its 52-week high, and its 50 DMA line defines support where a subsequent violation would raise greater concerns and trigger a technical sell signal. Technical strength has continued despite having reported earnings +11% on +6% sales revenues for the Jun '14 quarter, below the +25% minimum earnings guideline (C criteria), raising fundamental concerns.
>>> FEATURED STOCK ARTICLE : Technically Strong Despite Fundamental Concerns Raised By Most Current Quarterly Earnings - 8/21/2014
View all notes |
Set NEW NOTE alert |
CANSLIM.net Company Profile |
SEC
News |
Chart |
Request a new note
C
A N
S L
I M
|
YY
-
NASDAQ
YY Inc Ads
INTERNET - Internet Service Providers
|
$84.80
|
-2.34
-2.69% |
$86.82
|
1,114,052
78.79% of 50 DAV
50 DAV is 1,414,000
|
$90.93
-6.74%
|
8/19/2014
|
$85.81
|
PP = $91.03
|
|
MB = $95.58
|
Most Recent Note - 8/28/2014 6:21:51 PM
Y - Pulled back today for a 2nd consecutive loss on lighter than average volume. Subsequent volume-driven gains for new highs may trigger a new technical buy signal.
>>> FEATURED STOCK ARTICLE : Encountered Distributional Peressure Near Prior High - 8/19/2014
View all notes |
Set NEW NOTE alert |
CANSLIM.net Company Profile |
SEC
News |
Chart |
Request a new note
C
A N
S L
I M
|
|
|
|
THESE ARE NOT BUY RECOMMENDATIONS!
Comments contained in the body of this report are technical
opinions only. The material herein has been obtained
from sources believed to be reliable and accurate, however,
its accuracy and completeness cannot be guaranteed.
This site is not an investment advisor, hence it does
not endorse or recommend any securities or other investments.
Any recommendation contained in this report may not
be suitable for all investors and it is not to be deemed
an offer or solicitation on our part with respect to
the purchase or sale of any securities. All trademarks,
service marks and trade names appearing in this report
are the property of their respective owners, and are
likewise used for identification purposes only.
This report is a service available
only to active Paid Premium Members.
You may opt-out of receiving report notifications
at any time. Questions or comments may be submitted
by writing to Premium Membership Services 665 S.E. 10 Street, Suite 201 Deerfield Beach, FL 33441-5634 or by calling 1-800-965-8307
or 954-785-1121.
|
|
|