You are not logged in.
This means you
CAN ONLY VIEW reports that were published prior to Saturday, April 5, 2025.
You
MUST UPGRADE YOUR MEMBERSHIP if you want to see any current reports.
AFTER MARKET UPDATE - FRIDAY, AUGUST 29TH, 2014
Previous After Market Report Next After Market Report >>>
|
|
|
|
DOW |
+18.88 |
17,098.45 |
+0.11% |
|
Volume |
604,308,630 |
+26% |
|
Volume |
1,216,653,150 |
+2% |
|
NASDAQ |
+22.58 |
4,580.27 |
+0.50% |
|
Advancers |
2,136 |
68% |
|
Advancers |
1,923 |
68% |
|
S&P 500 |
+6.63 |
2,003.37 |
+0.33% |
|
Decliners |
890 |
28% |
|
Decliners |
794 |
28% |
|
Russell 2000 |
+8.40 |
1,174.35 |
+0.72% |
|
52 Wk Highs |
184 |
|
|
52 Wk Highs |
81 |
|
|
S&P 600 |
+4.14 |
671.88 |
+0.62% |
|
52 Wk Lows |
10 |
|
|
52 Wk Lows |
25 |
|
|
 |
Indices Ended August With Another Positive Session
Kenneth J. Gruneisen - Passed the CAN SLIM® Master's Exam
With Friday’s advance, the major averages posted solid gains in August. For the month, the Dow was up +3.2%, the S&P 500 rose +3.8% and the NASDAQ advanced +4.8%. The volume totals on the session were lighter on the NYSE and on the Nasdaq exchange even though trading was muted ahead of the Labor Day weekend. Breadth was positive as advancers led decliners by a 12-5 margin on the NYSE and 7-3 on the NASDAQ exchange. There were 50 high-ranked companies from the CANSLIM.net Leaders List that made new 52-week highs and appeared on the CANSLIM.net BreakOuts Page, up from the prior session total of 43 stocks. New 52-week highs solidly outnumbered new 52-week lows on the NYSE, but the new high/low totals were close to even on the Nasdaq exchange. There were gains for 11 of the 13 of the high-ranked companies currently included on the Featured Stocks Page. The broader market (M criteria) has been in a "confirmed uptrend" while leadership (stocks hitting new 52-week highs) has remained healthy. Remember that disciplined investors buy stocks with superior fundamentals only after they have triggered a proper technical buy signal.
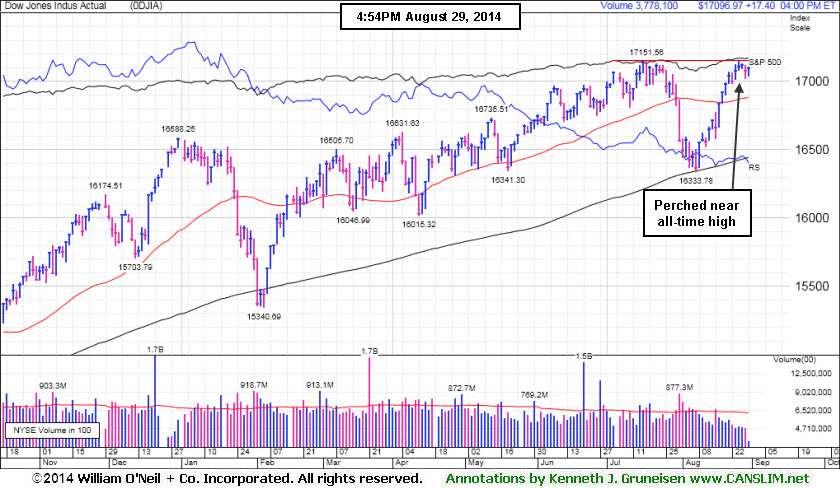
PICTURED: The Dow Jones Industrial Average rose 19 points to 17,098, perched near its all-time high hit intra-day on Tuesday.
The S&P 500 gained 7 points to close at a record high of 2,003. The NASDAQ advanced 23 points to 4,580.
The major averages ended the month on a positive note as investors weighed updates on the U.S. consumer. Before the open, reports showed personal spending fell 0.1% in July while income rose 0.2%. A release from the University of Michigan revealed sentiment improved more-than-expected in August. Geopolitical tension capped gains as the situation in Ukraine intensified and the U.K. raised its terror alert based on intelligence from Syria and Iraq.
The defensive utility and telecom sectors were up the most on the session. Entergy (ETR -1.4%) and Verizon (VZ +0.8%) rose. Tech also rose with chip maker Avago (AVGO +7.5%) up following its better-than-expected earnings results. Consumer discretionary was the worst performing group. Casino operator Wynn Resorts (WYNN -2%) declined. Retailer Big Lots (LOTS -1.8%) fell after posting revenues below analyst projections.
Treasuries declined with the 10-year note down 2/32 to yield 2.34%. COMEX gold slipped 0.2% to $1,287.20/oz. WTI crude oil rallied 1.4% to $95.89 on the NYMEX.
The CANSLIM.net Featured Stocks Page shows the most action-worthy candidates and their latest notes and a Headline Link directs members to the latest detailed analysis with data-packed graphs annotated by a Certified expert along with links to additional resources. The Premium Member Homepage includes "dynamic archives" to all prior pay reports published.
|
 Kenneth J. Gruneisen started out as a licensed stockbroker in August 1987, a couple of months prior to the historic stock market crash that took the Dow Jones Industrial Average down -22.6% in a single day. He has published daily fact-based fundamental and technical analysis on high-ranked stocks online for two decades. Through FACTBASEDINVESTING.COM, Kenneth provides educational articles, news, market commentary, and other information regarding proven investment systems that work in good times and bad.
Comments contained in the body of this report are technical opinions only and are not necessarily those of Gruneisen Growth Corp. The material herein has been obtained from sources believed to be reliable and accurate, however, its accuracy and completeness cannot be guaranteed. Our firm, employees, and customers may effect transactions, including transactions contrary to any recommendation herein, or have positions in the securities mentioned herein or options with respect thereto. Any recommendation contained in this report may not be suitable for all investors and it is not to be deemed an offer or solicitation on our part with respect to the purchase or sale of any securities. |
|
 |
Financial, Tech and Commodity-Linked Groups Rose
Kenneth J. Gruneisen - Passed the CAN SLIM® Master's Exam
Financial shares had a positive influence on the major averages on Friday as the Broker/Dealer Index ($XBD +0.44%) and the Bank Index ($BKX +0.49%) posted modest gains. The Retail Index ($RLX -0.01%) finished flat. The tech sector saw unanimous gains from the Biotechnology Index ($BTK +1.62%), Networking Index ($NWX +0.61%), and the Semiconductor Index ($SOX +0.74%). Commodity-linked groups also had a positive bias as the Gold & Silver Index ($XAU +1.22%) outpaced the Integrated Oil Index ($XOI +0.53%) and the Oil Services Index ($OSX +0.77%).
Charts courtesy www.stockcharts.com
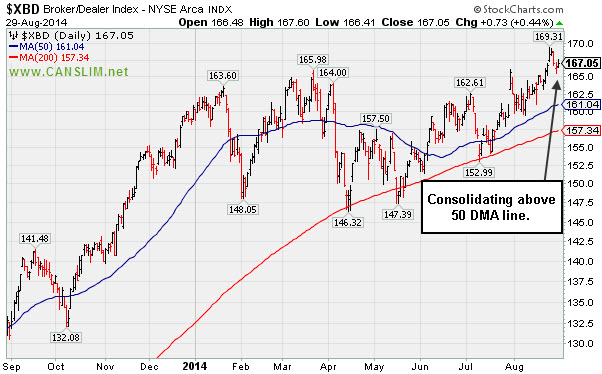
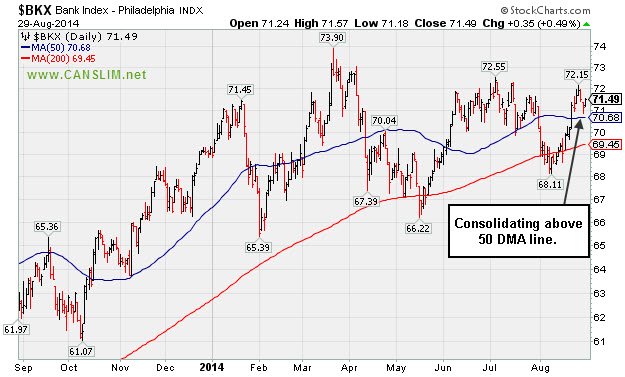
PICTURED: The Broker/Dealer Index ($XBD +0.44%) and the Bank Index ($BKX +0.49%) both are consolidating above their respective 50-day moving average (DMA) lines. Healthy action in financial groups of late is a reassuring sign as "leading indicators" for the broader market. The major averages have been especially prone to bad downdrafts in the past when financial shares were weak.
| Oil Services |
$OSX |
295.31 |
+2.27 |
+0.77% |
+5.08% |
| Integrated Oil |
$XOI |
1,689.23 |
+8.92 |
+0.53% |
+12.38% |
| Semiconductor |
$SOX |
645.25 |
+4.76 |
+0.74% |
+20.60% |
| Networking |
$NWX |
338.58 |
+2.04 |
+0.61% |
+4.52% |
| Broker/Dealer |
$XBD |
167.05 |
+0.73 |
+0.44% |
+4.04% |
| Retail |
$RLX |
955.71 |
-0.13 |
-0.01% |
+1.69% |
| Gold & Silver |
$XAU |
102.27 |
+1.23 |
+1.22% |
+21.53% |
| Bank |
$BKX |
71.49 |
+0.35 |
+0.49% |
+3.22% |
| Biotech |
$BTK |
3,131.89 |
+49.96 |
+1.62% |
+34.39% |
|
|
|
 |
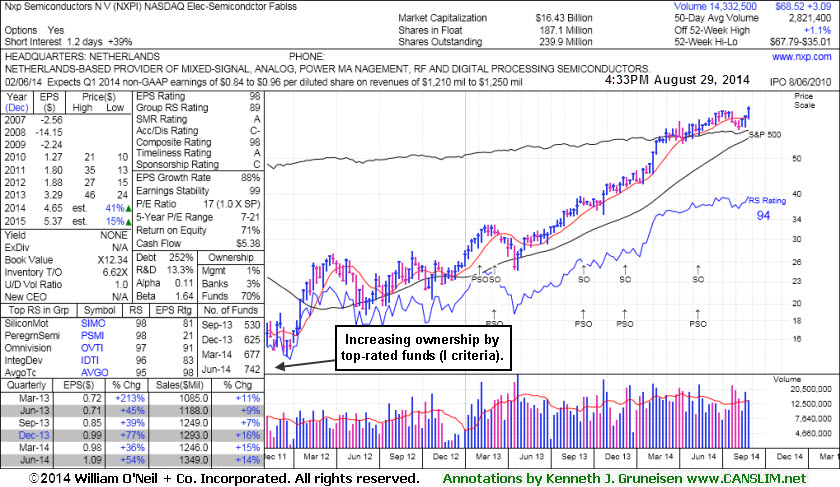
Gap Up For New High With Volume Triggered Technical Buy Signal
Kenneth J. Gruneisen - Passed the CAN SLIM® Master's Exam
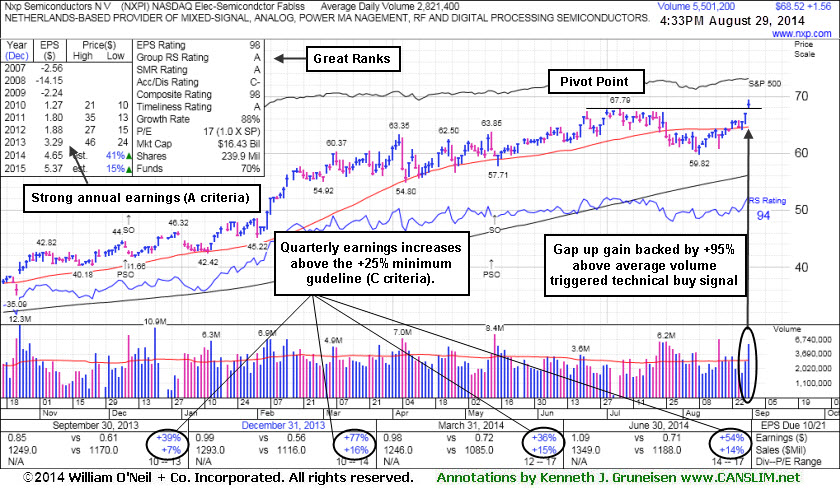
Nxp Semiconductors N V (NXPI +$1.56 or +2.33% to $68.52) was highlighted in yellow with pivot point cited based on its 7/07/14 high plus 10 cents in the earlier mid-day report (read here). It gapped up today and its gain backed by +95% above average volume helped it hit a new 52-week high (N criteria) and triggered a technical buy signal. No overhead supply remains to act as resistance.
Quarterly earnings (C criteria) through Jun '14 have shown strong growth and its annual earnings (A criteria) history is a good match the investment system guidelines. The number of top-rated funds owning its shares rose from 530 in Sep '13 to 742 in Jun '14, a reassuring sign concerning the I criteria. The Elec - Semicondctor Fablss group has a high 89 Group Relative Strength Rating and leadership from others in the industry group is a reassuring sign concerning the L criteria. It completed a Secondary Offering on 5/14/14 and earlier Secondary Offerings on 2/04/13, 3/08/13, 9/13/13, and 12/10/13.
Disciplined investors avoid chasing stocks more than +5% above their prior high or pivot point and always limit losses by selling any stock that falls more than -7% from their purchase price.
|
|
|
Color Codes Explained :
Y - Better candidates highlighted by our
staff of experts.
G - Previously featured
in past reports as yellow but may no longer be buyable under the
guidelines.
***Last / Change / Volume data in this table is the closing quote data***
Symbol/Exchange
Company Name
Industry Group |
PRICE |
CHANGE
(%Change) |
Day High |
Volume
(% DAV)
(% 50 day avg vol) |
52 Wk Hi
% From Hi |
Featured
Date |
Price
Featured |
Pivot Featured |
|
Max Buy |
ACT
-
NYSE
Actavis plc
Medical-Generic Drugs
|
$226.98
|
+0.39
0.17% |
$227.23
|
845,746
34.17% of 50 DAV
50 DAV is 2,475,000
|
$230.77
-1.64%
|
6/20/2014
|
$216.53
|
PP = $230.87
|
|
MB = $242.41
|
Most Recent Note - 8/28/2014 6:16:40 PM
Y - Quietly perched near its 52-week high today trading very light volume. Subsequent volume-driven gains to new highs may trigger a technical buy signal. See the latest FSU analysis for more details and new annotated graphs.
>>> FEATURED STOCK ARTICLE : Quietly Perched Within Striking Distance of 52-Week High - 8/28/2014
View all notes |
Set NEW NOTE alert |
CANSLIM.net Company Profile |
SEC
News |
Chart |
Request a new note
C
A N
S L
I M


|
AFSI
-
NASDAQ
Amtrust Financial Svcs
INSURANCE - Property and; Casualty Insurance
|
$44.03
|
-0.01
-0.02% |
$44.77
|
453,314
93.74% of 50 DAV
50 DAV is 483,600
|
$47.10
-6.52%
|
5/21/2014
|
$44.85
|
PP = $44.85
|
|
MB = $47.09
|
Most Recent Note - 8/28/2014 6:18:32 PM
G - Consolidating above support at its 50 DMA line, still only -6.5% off its 52-week high. Relative Strength Rating has slumped to 69, below the 80+ minimum guideline for buy candidates. Faces resistance due to overhead supply up through the $47 level.
>>> FEATURED STOCK ARTICLE : Relative Strength Rating Slumped While Building Longer Base - 8/18/2014
View all notes |
Set NEW NOTE alert |
CANSLIM.net Company Profile |
SEC
News |
Chart |
Request a new note
C
A N
S L
I M
|
BITA
-
NYSE
Bitauto Hldgs Ltd Ads
Internet-Content
|
$87.83
|
+0.47
0.54% |
$89.84
|
1,012,453
75.00% of 50 DAV
50 DAV is 1,350,000
|
$98.28
-10.63%
|
6/26/2014
|
$46.20
|
PP = $47.03
|
|
MB = $49.38
|
Most Recent Note - 8/28/2014 12:01:51 PM
G - Finished near the session low with a loss on heavy volume on the prior session and enduring more distributional pressure today. Previously noted with caution - "Has the look of a "climax run" with volume-driven gains getting very extended from its prior base." See the latest FSU analysis for more details and annotated graphs.
>>> FEATURED STOCK ARTICLE : Finished Near Session Low - Noted With Look of "Climax Run" - 8/27/2014
View all notes |
Set NEW NOTE alert |
CANSLIM.net Company Profile |
SEC
News |
Chart |
Request a new note
C
A N
S L
I M
|
EQM
-
NYSE
E Q T Midstream Partners
ENERGY - Oil and Gas Pipelines
|
$97.49
|
+0.36
0.37% |
$97.82
|
137,945
47.73% of 50 DAV
50 DAV is 289,000
|
$102.51
-4.90%
|
12/12/2013
|
$53.17
|
PP = $56.51
|
|
MB = $59.34
|
Most Recent Note - 8/25/2014 3:29:15 PM
G - Rebounding above its 50 DMA line today helping its technical stance improve. Reported earnings +37% on +21% sales revenues for the Jun '14 quarter, an improvement after 2 sub par quarterly earnings comparisons.
>>> FEATURED STOCK ARTICLE : Following 50-Day Moving Average Violation Gains Lacked Volume - 8/7/2014
View all notes |
Set NEW NOTE alert |
CANSLIM.net Company Profile |
SEC
News |
Chart |
Request a new note
C
A N
S L
I M
|
FB
-
NASDAQ
Facebook Inc Cl A
INTERNET
|
$74.82
|
+0.97
1.31% |
$74.82
|
26,215,557
67.87% of 50 DAV
50 DAV is 38,627,000
|
$76.74
-2.50%
|
7/24/2014
|
$76.00
|
PP = $72.69
|
|
MB = $76.32
|
Most Recent Note - 8/25/2014 3:30:40 PM
Y - Volume totals have cooled while consolidating in a tight range, stubbornly holding its ground since gapping up on 7/24/14. Prior highs in the $72 area define initial support above its 50 DMA line ($69.93).
>>> FEATURED STOCK ARTICLE : Making Limited Headway But Holding Ground Since Gap Up - 8/20/2014
View all notes |
Set NEW NOTE alert |
CANSLIM.net Company Profile |
SEC
News |
Chart |
Request a new note
C
A N
S L
I M
|
Symbol/Exchange
Company Name
Industry Group |
PRICE |
CHANGE
(%Change) |
Day High |
Volume
(% DAV)
(% 50 day avg vol) |
52 Wk Hi
% From Hi |
Featured
Date |
Price
Featured |
Pivot Featured |
|
Max Buy |
NXPI
-
NASDAQ
Nxp Semiconductors N V
ELECTRONICS - Semiconductor - Broad Line
|
$68.52
|
+1.56
2.33% |
$69.50
|
5,607,189
198.77% of 50 DAV
50 DAV is 2,821,000
|
$67.79
1.08%
|
8/29/2014
|
$68.50
|
PP = $67.89
|
|
MB = $71.28
|
 Most Recent Note - 8/29/2014 5:43:43 PM
Y - Was highlighted in yellow with pivot point cited based on its 7/07/14 high plus 10 cents in the earlier mid-day report (read here). Its gap up gain backed by heavy volume for a new 52-week high triggered a technical buy signal. No overhead supply remains to act as resistance. Quarterly earnings (C criteria) through Jun '14 have shown strong growth and its annual earnings (A criteria) history is a good match the investment system guidelines. See the latest FSU analysis for more details and annotated graphs.
>>> FEATURED STOCK ARTICLE : Gap Up For New High With Volume Triggered Technical Buy Signal - 8/29/2014
View all notes |
Set NEW NOTE alert |
CANSLIM.net Company Profile |
SEC
News |
Chart |
Request a new note
C
A N
S L
I M
|
PANW
-
NYSE
Palo Alto Networks
Computer Sftwr-Security
|
$84.99
|
+2.73
3.32% |
$85.63
|
1,325,480
96.89% of 50 DAV
50 DAV is 1,368,000
|
$87.79
-3.19%
|
7/30/2014
|
$84.21
|
PP = $85.88
|
|
MB = $90.17
|
Most Recent Note - 8/29/2014 5:47:39 PM
Y - Tallied a gain on average volume today after finding prompt support at its 50 DMA line ($81.28) on the prior session. Damaging violations of the 50 DMA line and 8/28/14 low ($79.71) would trigger technical sell signals. Subsequent volume-driven gains above the new pivot point cited may trigger a proper new (or add-on) technical buy signal. Due to report earnings on 9/09/14.
>>> FEATURED STOCK ARTICLE : Building on New Base Pattern Above 50-Day Average - 8/11/2014
View all notes |
Set NEW NOTE alert |
CANSLIM.net Company Profile |
SEC
News |
Chart |
Request a new note
C
A N
S L
I M
|
STRT
-
NASDAQ
Strattec Security Corp
AUTOMOTIVE - Auto Parts
|
$80.24
|
+2.34
3.00% |
$81.94
|
51,117
176.27% of 50 DAV
50 DAV is 29,000
|
$78.62
2.06%
|
8/22/2014
|
$71.47
|
PP = $73.97
|
|
MB = $77.67
|
Most Recent Note - 8/29/2014 2:54:35 PM
G - Hitting another new 52-week high with above average volume behind today's gain and its color code is changed to green after and rallying beyond its "max buy" level. Recent gain lacked significant volume, however, while gains should be backed by at least +40% above average volume to trigger a proper technical buy signal.
>>> FEATURED STOCK ARTICLE : Small Supply of Shares and Perched Near All-Time Highs - 8/22/2014
View all notes |
Set NEW NOTE alert |
CANSLIM.net Company Profile |
SEC
News |
Chart |
Request a new note
C
A N
S L
I M
|
TARO
-
NYSE
Taro Pharmaceutical Inds
DRUGS - Drug Manufacturers - Other
|
$161.16
|
+0.43
0.27% |
$165.30
|
151,650
191.96% of 50 DAV
50 DAV is 79,000
|
$164.00
-1.73%
|
7/30/2014
|
$144.24
|
PP = $149.99
|
|
MB = $157.49
|
Most Recent Note - 8/29/2014 12:55:32 PM
G - Hitting another new 52-week high with today's volume-driven gain, getting more extended from any sound base. Recently reported earnings for the Jun '14 quarter below the +25% minimum earnings guideline (C criteria) raising fundamental concerns.
>>> FEATURED STOCK ARTICLE : Still Building on an Advanced Base Pattern - 8/6/2014
View all notes |
Set NEW NOTE alert |
CANSLIM.net Company Profile |
SEC
News |
Chart |
Request a new note
C
A N
S L
I M
|
TRN
-
NYSE
Trinity Industries Inc
TRANSPORTATION - Railroads
|
$48.38
|
+0.37
0.77% |
$48.58
|
1,501,394
57.28% of 50 DAV
50 DAV is 2,621,000
|
$49.17
-1.61%
|
4/30/2014
|
$37.79
|
PP = $38.03
|
|
MB = $39.93
|
Most Recent Note - 8/25/2014 3:32:30 PM
G - Hitting another new 52-week high with today's 6th consecutive gain. It has not formed a sound base.
>>> FEATURED STOCK ARTICLE : Rallying Into New High Territory Without Forming New Base - 8/25/2014
View all notes |
Set NEW NOTE alert |
CANSLIM.net Company Profile |
SEC
News |
Chart |
Request a new note
C
A N
S L
I M
|
Symbol/Exchange
Company Name
Industry Group |
PRICE |
CHANGE
(%Change) |
Day High |
Volume
(% DAV)
(% 50 day avg vol) |
52 Wk Hi
% From Hi |
Featured
Date |
Price
Featured |
Pivot Featured |
|
Max Buy |
UA
-
NYSE
Under Armour Inc Cl A
CONSUMER NON-DURABLES - Textile - Apparel Clothing
|
$68.36
|
-1.32
-1.89% |
$69.98
|
2,396,821
103.53% of 50 DAV
50 DAV is 2,315,000
|
$71.79
-4.78%
|
7/10/2014
|
$58.50
|
PP = $60.79
|
|
MB = $63.83
|
Most Recent Note - 8/25/2014 3:33:55 PM
G - Stubbornly holding its ground near its all-time high and no resistance remains due to overhead supply. Recently reported earnings +0% on +34% sales revenues for the Jun '14 quarter, below the +25% minimum earnings guideline (C criteria), yet the company raised its guidance.
>>> FEATURED STOCK ARTICLE : Holding Ground Near All-Time Highs Despite Fundamental Concerns - 8/26/2014
View all notes |
Set NEW NOTE alert |
CANSLIM.net Company Profile |
SEC
News |
Chart |
Request a new note
C
A N
S L
I M
|
WLK
-
NYSE
Westlake Chemical Corp
CHEMICALS - Specialty Chemicals
|
$97.13
|
+1.04
1.08% |
$97.16
|
249,942
48.72% of 50 DAV
50 DAV is 513,000
|
$96.40
0.76%
|
4/29/2014
|
$72.79
|
PP = $69.31
|
|
MB = $72.78
|
Most Recent Note - 8/26/2014 5:33:32 PM
G - Perched at its 52-week high, and its 50 DMA line defines support where a subsequent violation would raise greater concerns and trigger a technical sell signal. Technical strength has continued despite having reported earnings +11% on +6% sales revenues for the Jun '14 quarter, below the +25% minimum earnings guideline (C criteria), raising fundamental concerns.
>>> FEATURED STOCK ARTICLE : Technically Strong Despite Fundamental Concerns Raised By Most Current Quarterly Earnings - 8/21/2014
View all notes |
Set NEW NOTE alert |
CANSLIM.net Company Profile |
SEC
News |
Chart |
Request a new note
C
A N
S L
I M
|
YY
-
NASDAQ
YY Inc Ads
INTERNET - Internet Service Providers
|
$84.89
|
+0.09
0.11% |
$85.55
|
930,328
67.46% of 50 DAV
50 DAV is 1,379,000
|
$90.93
-6.64%
|
8/19/2014
|
$85.81
|
PP = $91.03
|
|
MB = $95.58
|
Most Recent Note - 8/28/2014 6:21:51 PM
Y - Pulled back today for a 2nd consecutive loss on lighter than average volume. Subsequent volume-driven gains for new highs may trigger a new technical buy signal.
>>> FEATURED STOCK ARTICLE : Encountered Distributional Peressure Near Prior High - 8/19/2014
View all notes |
Set NEW NOTE alert |
CANSLIM.net Company Profile |
SEC
News |
Chart |
Request a new note
C
A N
S L
I M
|
|
|
|
THESE ARE NOT BUY RECOMMENDATIONS!
Comments contained in the body of this report are technical
opinions only. The material herein has been obtained
from sources believed to be reliable and accurate, however,
its accuracy and completeness cannot be guaranteed.
This site is not an investment advisor, hence it does
not endorse or recommend any securities or other investments.
Any recommendation contained in this report may not
be suitable for all investors and it is not to be deemed
an offer or solicitation on our part with respect to
the purchase or sale of any securities. All trademarks,
service marks and trade names appearing in this report
are the property of their respective owners, and are
likewise used for identification purposes only.
This report is a service available
only to active Paid Premium Members.
You may opt-out of receiving report notifications
at any time. Questions or comments may be submitted
by writing to Premium Membership Services 665 S.E. 10 Street, Suite 201 Deerfield Beach, FL 33441-5634 or by calling 1-800-965-8307
or 954-785-1121.
|
|
|

