You are not logged in.
This means you
CAN ONLY VIEW reports that were published prior to Monday, March 10, 2025.
You
MUST UPGRADE YOUR MEMBERSHIP if you want to see any current reports.
AFTER MARKET UPDATE - WEDNESDAY, AUGUST 27TH, 2014
Previous After Market Report Next After Market Report >>>
|
|
|
|
DOW |
+15.31 |
17,122.01 |
+0.09% |
|
Volume |
486,724,330 |
-3% |
|
Volume |
1,280,576,990 |
-3% |
|
NASDAQ |
-1.02 |
4,569.62 |
-0.02% |
|
Advancers |
1,716 |
54% |
|
Advancers |
1,204 |
42% |
|
S&P 500 |
+0.10 |
2,000.12 |
+0.00% |
|
Decliners |
1,316 |
42% |
|
Decliners |
1,520 |
54% |
|
Russell 2000 |
-2.46 |
1,172.71 |
-0.21% |
|
52 Wk Highs |
160 |
|
|
52 Wk Highs |
89 |
|
|
S&P 600 |
-1.31 |
671.84 |
-0.19% |
|
52 Wk Lows |
6 |
|
|
52 Wk Lows |
14 |
|
|
 |
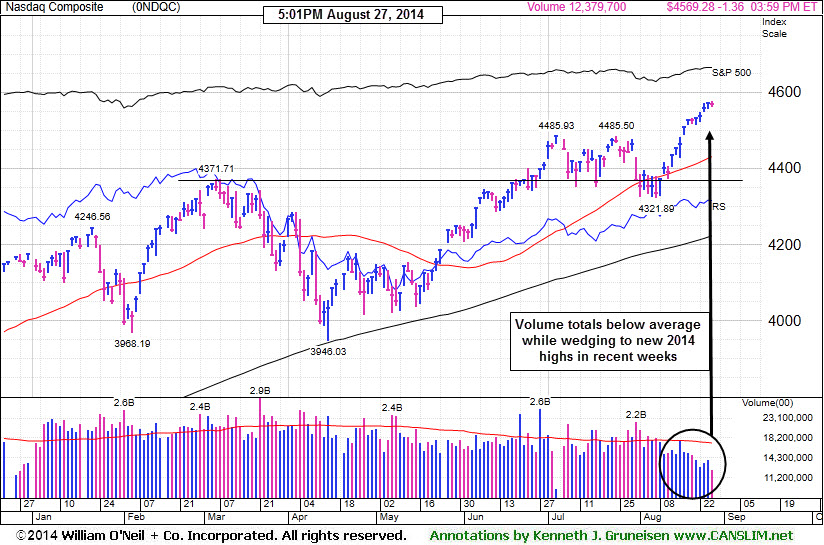
Major Averages Ended Mixed With Lighter Volume Totals
Kenneth J. Gruneisen - Passed the CAN SLIM® Master's Exam
The major averages finished mixed and little changed on Wednesday. The volume totals were lighter on the NYSE and on the Nasdaq exchange. Advancers led decliners by a 7-6 margin on the NYSE, but on the NASDAQ exchange decliners led advancers by a 5-4 margin. There were 45 high-ranked companies from the CANSLIM.net Leaders List that made new 52-week highs and appeared on the CANSLIM.net BreakOuts Page, down from the prior session total of 68 stocks. New 52-week highs contracted yet still easily outnumbered new 52-week lows on the NYSE and on the Nasdaq exchange. There were gains for 5 of the 12 of the high-ranked companies currently included on the Featured Stocks Page. The improved action in the broader market (M criteria) has been considered significant enough to shift back to a "confirmed uptrend" while leadership (stocks hitting new 52-week highs) has remained healthy. Remember that disciplined investors buy stocks with superior fundamentals only after they have triggered a proper technical buy signal.
PICTURED: The Nasdaq Composite Index wedged to new 2014 highs with lackluster volume totals behind gains in recent weeks.
The major averages ended a choppy session mixed as investors assessed the market's valuation following the recent rally. Tuesday, the S&P 500 advanced above the psychologically important 2,000 level for the first time as reports on durable goods orders and consumer confidence were viewed as signs of improving economic conditions.
With no meaningful data releases or Fed commentary, attention was on earnings. Tiffany (TIF +0.97%) rose after the upscale retailer raised its full-year profit forecast. Express (EXPR +12.75%) jumped following its better-than-expected quarterly results. Smith & Wesson (SWHC -13.63%) shares took a hit on the gun maker's reduced outlook.
Utilities and telecom were up the most on the session. NRG Energy (NRG +2.19%) and AT&T (T +0.72%) were higher. Energy and financials were the worst performing groups with losses for Halliburton (HAL -1.91%) and Charles Schwab (SCHW -1.28%).
Treasuries advanced attributed to investors seeking higher yields in U.S. government debt relative to its peers. The 10-year note rose 10/32 to yield 2.36%. In commodity trading, COMEX gold lost -0.2% to $1,281.90 an ounce. WTI crude oil was down less than 0.1% to $93.83 a barrel.
The CANSLIM.net Featured Stocks Page shows the most action-worthy candidates and their latest notes and a Headline Link directs members to the latest detailed analysis with data-packed graphs annotated by a Certified expert along with links to additional resources. The Premium Member Homepage includes "dynamic archives" to all prior pay reports published.
|
 Kenneth J. Gruneisen started out as a licensed stockbroker in August 1987, a couple of months prior to the historic stock market crash that took the Dow Jones Industrial Average down -22.6% in a single day. He has published daily fact-based fundamental and technical analysis on high-ranked stocks online for two decades. Through FACTBASEDINVESTING.COM, Kenneth provides educational articles, news, market commentary, and other information regarding proven investment systems that work in good times and bad.
Comments contained in the body of this report are technical opinions only and are not necessarily those of Gruneisen Growth Corp. The material herein has been obtained from sources believed to be reliable and accurate, however, its accuracy and completeness cannot be guaranteed. Our firm, employees, and customers may effect transactions, including transactions contrary to any recommendation herein, or have positions in the securities mentioned herein or options with respect thereto. Any recommendation contained in this report may not be suitable for all investors and it is not to be deemed an offer or solicitation on our part with respect to the purchase or sale of any securities. |
|
 |
Weaker Financial Shares Created a Drag
Kenneth J. Gruneisen - Passed the CAN SLIM® Master's Exam
The tech sector was indecisive as the Semiconductor Index ($SOX +0.16%) inched higher while the Biotechnology Index ($BTK -0.17%) and the Networking Index ($NWX -0.12%) inched lower. The Retail Index ($RLX +0.08%) finished flat, however financial shares were a slightly negative influence on the major averages as the Broker/Dealer Index ($XBD -0.95%) and the Bank Index ($BKX -0.54%) fell. Energy-related shares had a slightly positive bias as the Integrated Oil Index ($XOI +0.11%) and the Oil Services Index ($OSX +0.22%) edged higher. The Gold & Silver Index ($XAU -0.14%) was little changed.
Charts courtesy www.stockcharts.com
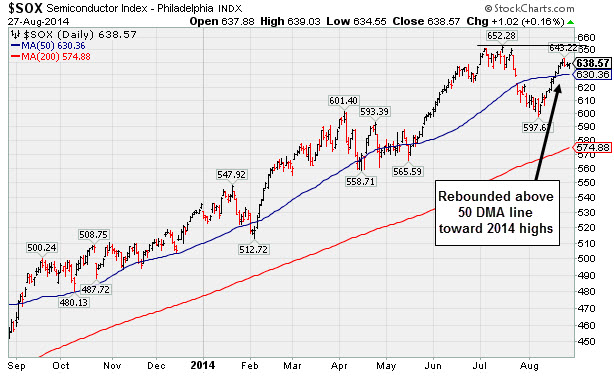
PICTURED: The Semiconductor Index ($SOX +0.16%) recently rebounded above its 50-day moving average (DMA) line toward its 2014 highs.
| Oil Services |
$OSX |
293.40 |
+0.65 |
+0.22% |
+4.40% |
| Integrated Oil |
$XOI |
1,679.06 |
+1.81 |
+0.11% |
+11.70% |
| Semiconductor |
$SOX |
638.57 |
+1.02 |
+0.16% |
+19.35% |
| Networking |
$NWX |
336.29 |
-0.40 |
-0.12% |
+3.81% |
| Broker/Dealer |
$XBD |
166.99 |
-1.61 |
-0.95% |
+4.00% |
| Retail |
$RLX |
956.74 |
+0.81 |
+0.08% |
+1.80% |
| Gold & Silver |
$XAU |
100.07 |
-0.14 |
-0.14% |
+18.92% |
| Bank |
$BKX |
71.52 |
-0.39 |
-0.54% |
+3.26% |
| Biotech |
$BTK |
3,097.42 |
-5.28 |
-0.17% |
+32.91% |
|
|
|
 |
Finished Near Session Low - Noted With Look of "Climax Run"
Kenneth J. Gruneisen - Passed the CAN SLIM® Master's Exam
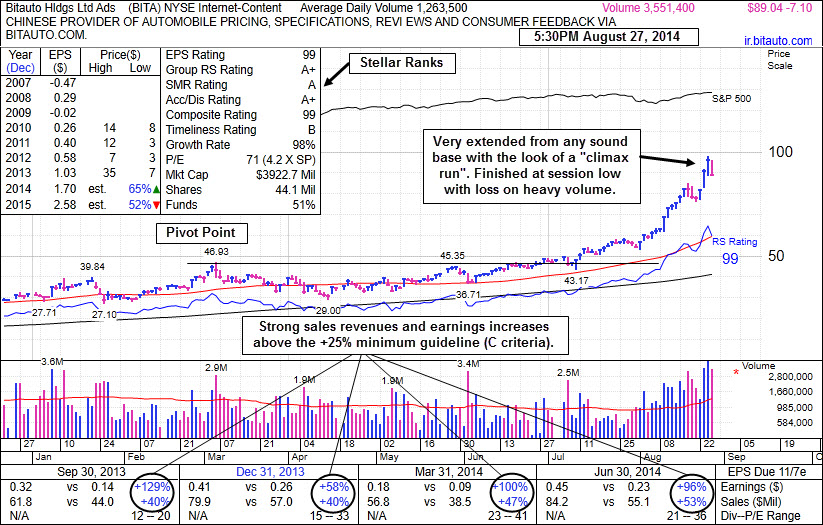
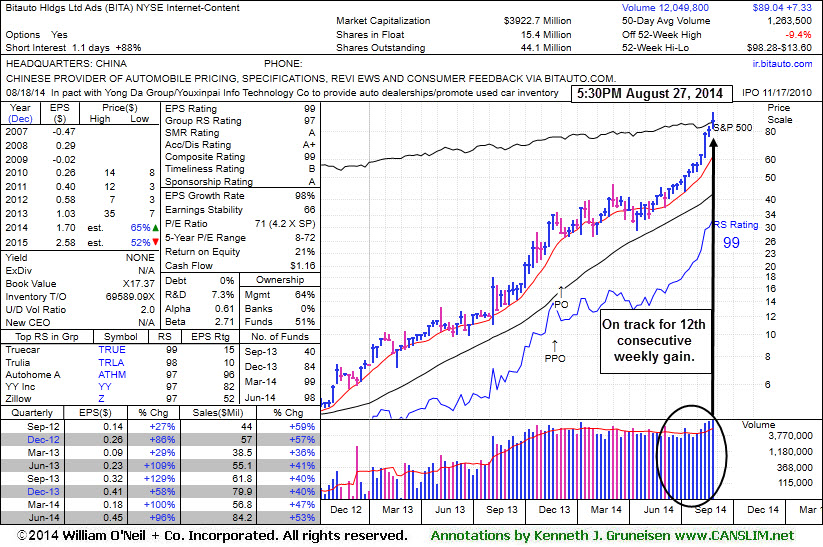
Biotauto Hldgs Ltd Ads (BITA -$7.10 or -7.39% to $89.04) pulled back for a considerable loss with heavy volume today and it finished near the session low. Disciplined investors may look to protect profits in the event of more damaging losses. It has been noted repeatedly with caution - "Has the look of a "climax run" with volume-driven gains getting very extended from its prior base." It is well above its 50-day moving average (DMA) line ($59.41) which is usually an important near-term support level for chart readers.
BITA was last shown in this FSU section on 8/08/14 with an annotated graphs under the headline," Perched at High After 3 Consecutive Volume-Driven Gains", while rallying well above its "max buy" level with no overhead supply to act as resistance. It was highlighted in yellow in the 6/26/14 mid-day report (read here) with pivot point cited based on the 3/06/14 high plus 10 cents. A gain above its pivot point on 6/30/14 backed by +50% above average volume triggered a technical buy signal. It managed a "positive reversal" on 7/10/14 after trading down considerably, likely prompting disciplined investors to sell if it fell more than -7% from their purchase price. Any stock which is sold can be bought back later if strength returns, however rule number one is to always limit losses while they are small.
Fundamentals remain strong with respect to the C and A criteria as it reported earnings +96% on +53% sales revenues for the Jun '14 quarter. It was first highlighted in the 8/07/13 mid-day report in yellow at $12.01 with the prior pivot point based on its 5/08/13 high plus 10 cents (read here). This China-based Internet-Content firm's quarterly and annual earnings (C and A criteria) history has been strong. Its small supply (S criteria) of only 15.4 million shares in the public float can contribute to great volatility in the event of institutional buying or selling. There are 98 top-rated mutual funds as of Jun '14 owning an interest in the company, up from 41 in Sep '13, a reassuring sign concerning the I criteria. Its current Up/Down Volume Ratio is 2.0, an unbiased indication its shares have been under accumulation over the past 50 days.
|
|
|
Color Codes Explained :
Y - Better candidates highlighted by our
staff of experts.
G - Previously featured
in past reports as yellow but may no longer be buyable under the
guidelines.
***Last / Change / Volume data in this table is the closing quote data***
Symbol/Exchange
Company Name
Industry Group |
PRICE |
CHANGE
(%Change) |
Day High |
Volume
(% DAV)
(% 50 day avg vol) |
52 Wk Hi
% From Hi |
Featured
Date |
Price
Featured |
Pivot Featured |
|
Max Buy |
ACT
-
NYSE
Actavis plc
Medical-Generic Drugs
|
$226.31
|
-1.41
-0.62% |
$228.21
|
1,088,610
42.82% of 50 DAV
50 DAV is 2,542,000
|
$230.77
-1.93%
|
6/20/2014
|
$216.53
|
PP = $230.87
|
|
MB = $242.41
|
Most Recent Note - 8/25/2014 3:28:03 PM
Y - Color code is changed to yellow while no new pivot point has been cited. Perched near its 52-week high today following 9 consecutive gains on light to average volume
>>> FEATURED STOCK ARTICLE : Enduring Distributional Pressure While Sputtering Near 50-Day Average - 8/5/2014
View all notes |
Set NEW NOTE alert |
CANSLIM.net Company Profile |
SEC
News |
Chart |
Request a new note
C
A N
S L
I M


|
AFSI
-
NASDAQ
Amtrust Financial Svcs
INSURANCE - Property and; Casualty Insurance
|
$44.25
|
-0.81
-1.80% |
$45.61
|
743,352
156.76% of 50 DAV
50 DAV is 474,200
|
$47.10
-6.05%
|
5/21/2014
|
$44.85
|
PP = $44.85
|
|
MB = $47.09
|
Most Recent Note - 8/22/2014 5:59:19 PM
G - Consolidating above support at its 50 DMA line, still only -6.8% off its 52-week high, however its Relative Strength Rating has slumped to 66, well below the 80+ minimum for buy candidates. Faces resistance due to overhead supply up through the $47 level.
>>> FEATURED STOCK ARTICLE : Relative Strength Rating Slumped While Building Longer Base - 8/18/2014
View all notes |
Set NEW NOTE alert |
CANSLIM.net Company Profile |
SEC
News |
Chart |
Request a new note
C
A N
S L
I M
|
BITA
-
NYSE
Bitauto Hldgs Ltd Ads
Internet-Content
|
$89.04
|
-7.10
-7.39% |
$96.00
|
3,551,342
281.18% of 50 DAV
50 DAV is 1,263,000
|
$98.28
-9.40%
|
6/26/2014
|
$46.20
|
PP = $47.03
|
|
MB = $49.38
|
 Most Recent Note - 8/27/2014 6:02:34 PM
G - Finished near the session low with a loss on heavy volume today. Previously noted with caution - "Has the look of a "climax run" with volume-driven gains getting very extended from its prior base." See the latest FSU analysis for more details and new annotated graphs.
>>> FEATURED STOCK ARTICLE : Finished Near Session Low - Noted With Look of "Climax Run" - 8/27/2014
View all notes |
Set NEW NOTE alert |
CANSLIM.net Company Profile |
SEC
News |
Chart |
Request a new note
C
A N
S L
I M
|
EQM
-
NYSE
E Q T Midstream Partners
ENERGY - Oil and Gas Pipelines
|
$98.14
|
+3.21
3.38% |
$98.36
|
150,753
48.47% of 50 DAV
50 DAV is 311,000
|
$102.51
-4.26%
|
12/12/2013
|
$53.17
|
PP = $56.51
|
|
MB = $59.34
|
Most Recent Note - 8/25/2014 3:29:15 PM
G - Rebounding above its 50 DMA line today helping its technical stance improve. Reported earnings +37% on +21% sales revenues for the Jun '14 quarter, an improvement after 2 sub par quarterly earnings comparisons.
>>> FEATURED STOCK ARTICLE : Following 50-Day Moving Average Violation Gains Lacked Volume - 8/7/2014
View all notes |
Set NEW NOTE alert |
CANSLIM.net Company Profile |
SEC
News |
Chart |
Request a new note
C
A N
S L
I M
|
FB
-
NASDAQ
Facebook Inc Cl A
INTERNET
|
$74.63
|
-1.33
-1.75% |
$75.49
|
36,174,533
93.41% of 50 DAV
50 DAV is 38,727,000
|
$76.74
-2.75%
|
7/24/2014
|
$76.00
|
PP = $72.69
|
|
MB = $76.32
|
Most Recent Note - 8/25/2014 3:30:40 PM
Y - Volume totals have cooled while consolidating in a tight range, stubbornly holding its ground since gapping up on 7/24/14. Prior highs in the $72 area define initial support above its 50 DMA line ($69.93).
>>> FEATURED STOCK ARTICLE : Making Limited Headway But Holding Ground Since Gap Up - 8/20/2014
View all notes |
Set NEW NOTE alert |
CANSLIM.net Company Profile |
SEC
News |
Chart |
Request a new note
C
A N
S L
I M
|
Symbol/Exchange
Company Name
Industry Group |
PRICE |
CHANGE
(%Change) |
Day High |
Volume
(% DAV)
(% 50 day avg vol) |
52 Wk Hi
% From Hi |
Featured
Date |
Price
Featured |
Pivot Featured |
|
Max Buy |
PANW
-
NYSE
Palo Alto Networks
Computer Sftwr-Security
|
$82.41
|
-3.18
-3.72% |
$85.53
|
1,580,566
116.39% of 50 DAV
50 DAV is 1,358,000
|
$87.79
-6.13%
|
7/30/2014
|
$84.21
|
PP = $85.88
|
|
MB = $90.17
|
Most Recent Note - 8/27/2014 5:59:13 PM
Y - Finished near session low with a loss on higher volume today indicating distributional pressure. Its 50 DMA line ($81.15) defines important near-term support where a violation may trigger a technical sell signal. Did not tally volume-driven gains above the new pivot point cited to trigger a proper new (or add-on) technical buy signal. Due to report earnings on 9/09/14.
>>> FEATURED STOCK ARTICLE : Building on New Base Pattern Above 50-Day Average - 8/11/2014
View all notes |
Set NEW NOTE alert |
CANSLIM.net Company Profile |
SEC
News |
Chart |
Request a new note
C
A N
S L
I M
|
STRT
-
NASDAQ
Strattec Security Corp
AUTOMOTIVE - Auto Parts
|
$78.10
|
+1.05
1.36% |
$78.52
|
28,484
98.22% of 50 DAV
50 DAV is 29,000
|
$78.00
0.13%
|
8/22/2014
|
$71.47
|
PP = $73.97
|
|
MB = $77.67
|
Most Recent Note - 8/27/2014 12:38:44 PM
Y - Perched at its 52-week high and rallying further above its pivot point with today's 5th consecutive gain, however recent volume totals have been near average or below average. Gains should be backed by volume at least +40% above average to trigger a proper technical buy signal. Highlighted in yellow with pivot point based on its 6/06/14 high plus 10 cents in the 8/22/14 mid-day report (read here).
>>> FEATURED STOCK ARTICLE : Small Supply of Shares and Perched Near All-Time Highs - 8/22/2014
View all notes |
Set NEW NOTE alert |
CANSLIM.net Company Profile |
SEC
News |
Chart |
Request a new note
C
A N
S L
I M
|
TARO
-
NYSE
Taro Pharmaceutical Inds
DRUGS - Drug Manufacturers - Other
|
$162.12
|
+1.59
0.99% |
$163.95
|
107,403
139.48% of 50 DAV
50 DAV is 77,000
|
$164.00
-1.15%
|
7/30/2014
|
$144.24
|
PP = $149.99
|
|
MB = $157.49
|
Most Recent Note - 8/22/2014 5:55:47 PM
G - Rallied for a new 52-week high with today's volume-driven gain. Recently reported earnings for the Jun '14 quarter below the +25% minimum earnings guideline (C criteria) raising fundamental concerns.
>>> FEATURED STOCK ARTICLE : Still Building on an Advanced Base Pattern - 8/6/2014
View all notes |
Set NEW NOTE alert |
CANSLIM.net Company Profile |
SEC
News |
Chart |
Request a new note
C
A N
S L
I M
|
TRN
-
NYSE
Trinity Industries Inc
TRANSPORTATION - Railroads
|
$48.73
|
+0.28
0.58% |
$48.91
|
1,569,854
59.51% of 50 DAV
50 DAV is 2,638,000
|
$49.17
-0.89%
|
4/30/2014
|
$37.79
|
PP = $38.03
|
|
MB = $39.93
|
Most Recent Note - 8/25/2014 3:32:30 PM
G - Hitting another new 52-week high with today's 6th consecutive gain. It has not formed a sound base.
>>> FEATURED STOCK ARTICLE : Rallying Into New High Territory Without Forming New Base - 8/25/2014
View all notes |
Set NEW NOTE alert |
CANSLIM.net Company Profile |
SEC
News |
Chart |
Request a new note
C
A N
S L
I M
|
UA
-
NYSE
Under Armour Inc Cl A
CONSUMER NON-DURABLES - Textile - Apparel Clothing
|
$70.06
|
-0.76
-1.07% |
$70.84
|
1,799,013
76.13% of 50 DAV
50 DAV is 2,363,000
|
$71.79
-2.41%
|
7/10/2014
|
$58.50
|
PP = $60.79
|
|
MB = $63.83
|
Most Recent Note - 8/25/2014 3:33:55 PM
G - Stubbornly holding its ground near its all-time high and no resistance remains due to overhead supply. Recently reported earnings +0% on +34% sales revenues for the Jun '14 quarter, below the +25% minimum earnings guideline (C criteria), yet the company raised its guidance.
>>> FEATURED STOCK ARTICLE : Holding Ground Near All-Time Highs Despite Fundamental Concerns - 8/26/2014
View all notes |
Set NEW NOTE alert |
CANSLIM.net Company Profile |
SEC
News |
Chart |
Request a new note
C
A N
S L
I M
|
Symbol/Exchange
Company Name
Industry Group |
PRICE |
CHANGE
(%Change) |
Day High |
Volume
(% DAV)
(% 50 day avg vol) |
52 Wk Hi
% From Hi |
Featured
Date |
Price
Featured |
Pivot Featured |
|
Max Buy |
WLK
-
NYSE
Westlake Chemical Corp
CHEMICALS - Specialty Chemicals
|
$95.63
|
+0.71
0.75% |
$95.69
|
238,890
46.21% of 50 DAV
50 DAV is 517,000
|
$95.51
0.13%
|
4/29/2014
|
$72.79
|
PP = $69.31
|
|
MB = $72.78
|
Most Recent Note - 8/26/2014 5:33:32 PM
G - Perched at its 52-week high, and its 50 DMA line defines support where a subsequent violation would raise greater concerns and trigger a technical sell signal. Technical strength has continued despite having reported earnings +11% on +6% sales revenues for the Jun '14 quarter, below the +25% minimum earnings guideline (C criteria), raising fundamental concerns.
>>> FEATURED STOCK ARTICLE : Technically Strong Despite Fundamental Concerns Raised By Most Current Quarterly Earnings - 8/21/2014
View all notes |
Set NEW NOTE alert |
CANSLIM.net Company Profile |
SEC
News |
Chart |
Request a new note
C
A N
S L
I M
|
YY
-
NASDAQ
YY Inc Ads
INTERNET - Internet Service Providers
|
$87.14
|
-2.84
-3.16% |
$90.84
|
1,402,442
95.73% of 50 DAV
50 DAV is 1,465,000
|
$90.93
-4.17%
|
8/19/2014
|
$85.81
|
PP = $91.03
|
|
MB = $95.58
|
Most Recent Note - 8/26/2014 5:35:51 PM
Y - Finished at a best-ever close following today's 3rd consecutive gain on below average volume. Highlighted in yellow in the 8/19/14 mid-day report (read here), and subsequent volume-driven gains for new highs to trigger a new technical buy signal.
>>> FEATURED STOCK ARTICLE : Encountered Distributional Peressure Near Prior High - 8/19/2014
View all notes |
Set NEW NOTE alert |
CANSLIM.net Company Profile |
SEC
News |
Chart |
Request a new note
C
A N
S L
I M
|
|
|
|
THESE ARE NOT BUY RECOMMENDATIONS!
Comments contained in the body of this report are technical
opinions only. The material herein has been obtained
from sources believed to be reliable and accurate, however,
its accuracy and completeness cannot be guaranteed.
This site is not an investment advisor, hence it does
not endorse or recommend any securities or other investments.
Any recommendation contained in this report may not
be suitable for all investors and it is not to be deemed
an offer or solicitation on our part with respect to
the purchase or sale of any securities. All trademarks,
service marks and trade names appearing in this report
are the property of their respective owners, and are
likewise used for identification purposes only.
This report is a service available
only to active Paid Premium Members.
You may opt-out of receiving report notifications
at any time. Questions or comments may be submitted
by writing to Premium Membership Services 665 S.E. 10 Street, Suite 201 Deerfield Beach, FL 33441-5634 or by calling 1-800-965-8307
or 954-785-1121.
|
|
|