You are not logged in.
This means you
CAN ONLY VIEW reports that were published prior to Wednesday, April 9, 2025.
You
MUST UPGRADE YOUR MEMBERSHIP if you want to see any current reports.
AFTER MARKET UPDATE - MONDAY, AUGUST 16TH, 2010
Previous After Market Report Next After Market Report >>>
|
|
|
|
DOW |
-1.14 |
10,302.01 |
-0.01% |
|
Volume |
788,878,840 |
-9% |
|
Volume |
1,585,546,830 |
+1% |
|
NASDAQ |
+8.39 |
2,181.87 |
+0.39% |
|
Advancers |
1,888 |
60% |
|
Advancers |
1,642 |
59% |
|
S&P 500 |
+0.13 |
1,079.38 |
+0.01% |
|
Decliners |
1,102 |
35% |
|
Decliners |
1,021 |
37% |
|
Russell 2000 |
+5.61 |
615.10 |
+0.92% |
|
52 Wk Highs |
186 |
|
|
52 Wk Highs |
34 |
|
|
S&P 600 |
+2.27 |
328.73 |
+0.70% |
|
52 Wk Lows |
75 |
|
|
52 Wk Lows |
137 |
|
|
 |
Breadth Improves While Volume Totals Remain Below Average
Adam Sarhan, Contributing Writer,
The major averages traded in a narrow range and hovered in and out of the black before closing higher as investors digested tepid economic data from the US and Japan. Volume totals on were reported lower on the NYSE and slightly higher on the Nasdaq exchanges versus the prior session, which was a sign that institutional investors were not buying shares aggressively. Advancers led decliners by about a 3-to-2 ratio on the NYSE and Nasdaq exchange as the major averages closed relatively flat for the day. New 52-week highs outnumbered new 52-week lows on the NYSE but trailed new lows by a large margin on the Nasdaq exchange. There were 11 high-ranked companies from the CANSLIM.net Leaders List made a new 52-week high and appeared on the CANSLIM.net BreakOuts Page, up slightly from the 6 issues that appeared on the prior session.
Overnight, Japan said its economy slowed sharply last quarter with GDP missing forecasts. Japan's economy grew by +0.4% on an annualized basis which was less than the Street's estimate. This put pressure on overseas markets and US futures. The global recovery theme encountered more trouble after a weaker-than-expected report from New York manufacturing was released. Since last week's Fed meeting, approximately $1.9 trillion has been wiped from the value of global equities. The benchmark S&P 500 fell over -4% since August 9 which put the latest rally under pressure. It is important to note that since earnings season began in early July, the major averages have enjoyed decent gains on the premise that Q2 earnings topped estimates.
So far, Q2 earnings have topped the average estimate at more than +75% of the 438 companies in the S&P 500 which reported their results. The data shows that earnings grew by +51% while sales rose by +9.3%. Looking forward, investors are now concerned whether or not the healthy results will continue during the later half of the year. Elsewhere, the National Association of Home Builders/Wells Fargo confidence index slid to 13 this month which is the lowest reading since March 2009 and down from July's reading of 14. It was also lower than the Street's estimate for 15 and sharply lower than 50 which means respondents still view conditions as poor.
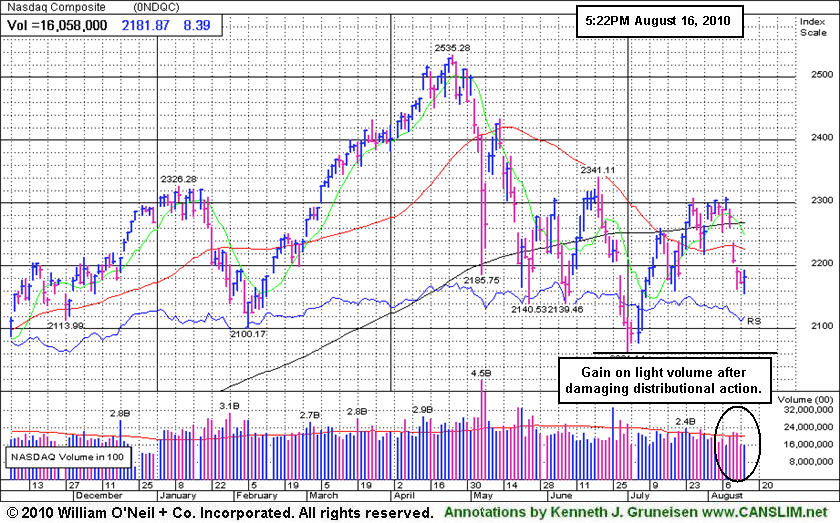
The technical action in the major averages has deteriorated significantly. Not all of the major averages managed to rally above their recent chart highs, and all have now sliced back below their respective 200-day moving average (DMA) lines. It is also worrisome to see the number of distribution days pile up in recent weeks which puts pressure on the current five-week rally. Whenever a market rally becomes under pressure (as it is now), it is usually wise to err on the side of caution and adopt a strong defensive stance until the bulls regain control. Trade accordingly.
Are You Capitalizing On The Current Rally?
Our skilled team of portfolio managers knows how to follow the rules of this fact-based investment system. We do not follow opinion or the "conviction list" of some large Wall Street institution which would have us fully invested even during horrific bear markets. Instead, we remain fluid and only buy the best stocks when they are triggering proper technical buy signals. If you are not completely satisfied with the way your portfolio is being managed, Click here to submit your inquiry. *Accounts over $250,000 please. ** Serious inquires only.
PICTURED: The Nasdaq Composite Index posted a gain on lighter than average volume on Monday after damaging distributional action in the past week.
|
|
|
 |
Gold & Silver Index Rebounding From July Lows
Kenneth J. Gruneisen - Passed the CAN SLIM® Master's Exam
The tech-heavy Nasdaq Composite Index benefited from the tech sector's strength as the Networking Index ($NWX +0.39%), Internet Index ($IIX +0.42%), Semiconductor Index ($SOX +0.47%), and the Biotechnology Index ($BTK +0.72%) ended unanimously higher with modest gains. The Oil Services Index ($OSX +0.57%) and Retail Index ($RLX +0.12%) also posted small gains. Meanwhile, mild losses in the financial groups dragged on the Broker/Dealer Index ($XBD -0.50%) and Bank Index ($BKX -0.11%). The Healthcare Index ($HMO -0.23%) and Integrated Oil Index ($XOI -0.10%) also edged lower.
Charts courtesy www.stockcharts.com
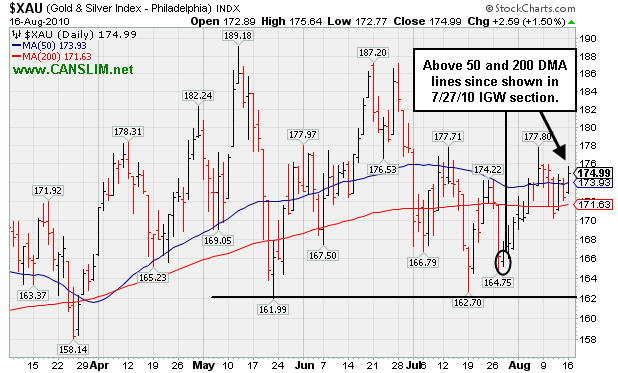
PICTURED: The Gold & Silver Index ($XAU +1.50%) rallied above its 50-day moving average (DMA) line with a solid gain on Monday. It has recovered above its 50 and 200 DMA lines from trading near July lows when last shown in this IGW section on 7/27/10 (read here).
| Oil Services |
$OSX |
178.57 |
+1.01 |
+0.57% |
-8.39% |
| Healthcare |
$HMO |
1,494.61 |
-3.38 |
-0.23% |
+1.47% |
| Integrated Oil |
$XOI |
976.63 |
-0.97 |
-0.10% |
-8.57% |
| Semiconductor |
$SOX |
324.26 |
+1.52 |
+0.47% |
-9.91% |
| Networking |
$NWX |
227.58 |
+0.89 |
+0.39% |
-1.51% |
| Internet |
$IIX |
243.42 |
+1.02 |
+0.42% |
+4.09% |
| Broker/Dealer |
$XBD |
103.14 |
-0.51 |
-0.50% |
-10.35% |
| Retail |
$RLX |
400.46 |
+0.48 |
+0.12% |
-2.59% |
| Gold & Silver |
$XAU |
174.99 |
+2.59 |
+1.50% |
+4.01% |
| Bank |
$BKX |
45.90 |
-0.05 |
-0.11% |
+7.47% |
| Biotech |
$BTK |
1,086.41 |
+7.78 |
+0.72% |
+15.31% |
|
|
|
 |
Consolidating Above Short-Term Average
Kenneth J. Gruneisen - Passed the CAN SLIM® Master's Exam
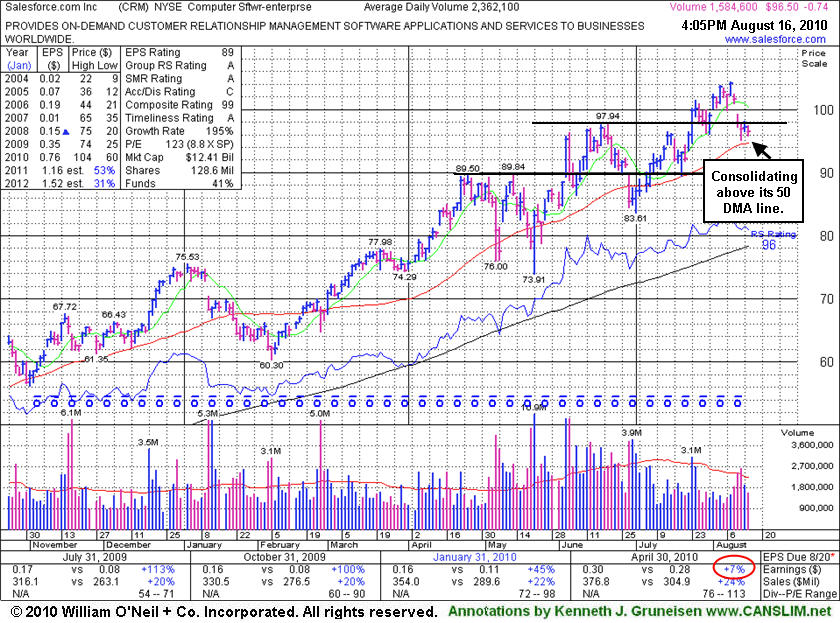
Salesforce.com, Inc. (CRM -$0.61 or -0.63% to $96.63) endured distributional pressure last week and slumped under prior highs near $97 while nearly testing support at its 50-day moving average (DMA) line. A patent infringement suit brought by Microsoft Corp. has been settled since its last appearance in this FSU section on 7/15/10 when we observed - "Those with open positions might choose to give it the benefit of the doubt until a more worrisome technical sell signal might raise greater concerns." Healthy stocks typically find support near their short-term 50-day average as institutional investors add to existing holdings, so any subsequent 50 DMA violation would raise greater concerns and might prompt more investors to lock in hard fought gains.
Concerns were raised by its weaker earnings, now making it a fundamentally questionable candidate for additional buying efforts. For the quarter ended April 30, 2010 it showed only a +7% earnings per share increase, a difficult comparison marking its first increase below the +25% minimum guideline in years. New (or add-on) buying efforts might not be appropriate because of that fundamental flaw for this high-ranked Computer Software - Enterprise firm. The increase in institutional (I criteria) ownership has been encouraging in the past, and the number of top-rated funds owning its shares rose from 283 in Sep '09 to 336 in Jun '10. CRM traded up +121.65% since featured in a Stock Bulletin on 8/16/09 under the headline "Forces Have Been Favorable For Software Services Firm."
|
|
|
Color Codes Explained :
Y - Better candidates highlighted by our
staff of experts.
G - Previously featured
in past reports as yellow but may no longer be buyable under the
guidelines.
***Last / Change / Volume data in this table is the closing quote data***
Symbol/Exchange
Company Name
Industry Group |
PRICE |
CHANGE
(%Change) |
Day High |
Volume
(% DAV)
(% 50 day avg vol) |
52 Wk Hi
% From Hi |
Featured
Date |
Price
Featured |
Pivot Featured |
|
Max Buy |
AAPL
-
NASDAQ
Apple Inc
COMPUTER HARDWARE - Personal Computers
|
$247.64
|
-1.46
-0.59% |
$250.01
|
11,346,219
46.21% of 50 DAV
50 DAV is 24,553,500
|
$279.01
-11.24%
|
6/17/2010
|
$270.95
|
PP = $272.56
|
|
MB = $286.19
|
Most Recent Note - 8/13/2010 4:06:31 PM
G - Slumped below its 50 DMA line this week raising concerns and its color code was changed to green based on the deterioration. A rally above its recent high near $266 is needed for its outlook to improve, meanwhile the recent chart low ($239) defines an important support level.
>>> The latest Featured Stock Update with an annotated graph appeared on 8/9/2010. Click here.
View all notes |
Alert me of new notes |
CANSLIM.net Company Profile |
SEC |
Zacks Reports |
StockTalk |
News |
Chart |
Request a new note
C
A N
S L
I M


|
ABV
-
NYSE
Comp De Bebidas Adr
FOOD and BEVERAGE - Beverages - Brewers
|
$107.18
|
+2.87
2.75% |
$108.25
|
606,517
92.33% of 50 DAV
50 DAV is 656,900
|
$112.60
-4.81%
|
6/29/2010
|
$104.74
|
PP = $109.33
|
|
MB = $114.80
|
 Most Recent Note - 8/16/2010 5:13:48 PM
G - This Brazil-based beverage firm posted a considerable gain today and rallied above its 50 DMA line. For the quarter ended June 30, 2010 it reported +19% earnings on +16% sales revenues, below the +25% guidelines.
>>> The latest Featured Stock Update with an annotated graph appeared on 7/20/2010. Click here.
View all notes |
Alert me of new notes |
CANSLIM.net Company Profile |
SEC |
Zacks Reports |
StockTalk |
News |
Chart |
Request a new note
C
A N
S L
I M
|
BIDU
-
NASDAQ
Baidu Inc Ads
INTERNET - Internet Information Providers
|
$84.35
|
+1.52
1.84% |
$85.27
|
7,411,207
64.23% of 50 DAV
50 DAV is 11,538,500
|
$88.32
-4.50%
|
7/14/2010
|
$75.03
|
PP = $78.59
|
|
MB = $82.52
|
Most Recent Note - 8/13/2010 4:26:50 PM
G - Consolidating above prior highs that define technical support along with its 50 DMA line.
>>> The latest Featured Stock Update with an annotated graph appeared on 8/13/2010. Click here.
View all notes |
Alert me of new notes |
CANSLIM.net Company Profile |
SEC |
Zacks Reports |
StockTalk |
News |
Chart |
Request a new note
C
A N
S L
I M
|
CACC
-
NASDAQ
Credit Acceptance Corp
FINANCIAL SERVICES - Credit Services
|
$59.31
|
+1.42
2.45% |
$59.33
|
65,658
125.78% of 50 DAV
50 DAV is 52,200
|
$59.75
-0.74%
|
7/29/2010
|
$52.04
|
PP = $54.07
|
|
MB = $56.77
|
Most Recent Note - 8/16/2010 12:46:29 PM
G - Stubbornly holding its ground near its 52-week high, slightly extended from its prior base. Previous resistance near $54 defines initial chart support to watch.
>>> The latest Featured Stock Update with an annotated graph appeared on 8/2/2010. Click here.
View all notes |
Alert me of new notes |
CANSLIM.net Company Profile |
SEC |
Zacks Reports |
StockTalk |
News |
Chart |
Request a new note
C
A N
S L
I M
|
CRM
-
NYSE
Salesforce.Com Inc
INTERNET - Internet Software and Services
|
$96.63
|
-0.61
-0.63% |
$97.44
|
1,821,245
77.10% of 50 DAV
50 DAV is 2,362,100
|
$104.44
-7.48%
|
6/2/2010
|
$88.44
|
PP = $89.60
|
|
MB = $94.08
|
Most Recent Note - 8/13/2010 4:38:59 PM
G - Endured distributional pressure this week and slumped near support at prior highs near $97, nearly testing its 50 DMA line.
>>> The latest Featured Stock Update with an annotated graph appeared on 8/16/2010. Click here.
View all notes |
Alert me of new notes |
CANSLIM.net Company Profile |
SEC |
Zacks Reports |
StockTalk |
News |
Chart |
Request a new note
C
A N
S L
I M
|
Symbol/Exchange
Company Name
Industry Group |
PRICE |
CHANGE
(%Change) |
Day High |
Volume
(% DAV)
(% 50 day avg vol) |
52 Wk Hi
% From Hi |
Featured
Date |
Price
Featured |
Pivot Featured |
|
Max Buy |
FFIV
-
NASDAQ
F 5 Networks Inc
INTERNET - Internet Software and Services
|
$83.89
|
+0.01
0.01% |
$85.19
|
806,803
46.61% of 50 DAV
50 DAV is 1,731,000
|
$92.70
-9.50%
|
6/16/2010
|
$74.50
|
PP = $74.10
|
|
MB = $77.81
|
Most Recent Note - 8/13/2010 4:42:44 PM
G - Halted its slide today with a gain on light volume after 2 consecutive damaging gaps down. Recently noted as -"extended from any sound base after recent volume-driven gains, it could go on to produce more climactic gains."
>>> The latest Featured Stock Update with an annotated graph appeared on 8/4/2010. Click here.
View all notes |
Alert me of new notes |
CANSLIM.net Company Profile |
SEC |
Zacks Reports |
StockTalk |
News |
Chart |
Request a new note
C
A N
S L
I M
|
FOSL
-
NASDAQ
Fossil Inc
CONSUMER DURABLES - Recreational Goods, Other
|
$43.83
|
+0.13
0.30% |
$44.38
|
631,554
72.33% of 50 DAV
50 DAV is 873,200
|
$46.30
-5.33%
|
8/10/2010
|
$45.54
|
PP = $42.69
|
|
MB = $44.82
|
Most Recent Note - 8/13/2010 4:46:09 PM
Y - Consolidating quietly below its "max buy" level following a considerable "breakaway gap" this week for a new 52-week high and all-time high.
>>> The latest Featured Stock Update with an annotated graph appeared on 8/11/2010. Click here.
View all notes |
Alert me of new notes |
CANSLIM.net Company Profile |
SEC |
Zacks Reports |
StockTalk |
News |
Chart |
Request a new note
C
A N
S L
I M
|
MELI
-
NASDAQ
Mercadolibre Inc
INTERNET - Internet Software and; Services
|
$67.00
|
+1.47
2.24% |
$67.94
|
549,974
52.69% of 50 DAV
50 DAV is 1,043,800
|
$68.67
-2.43%
|
5/13/2010
|
$54.21
|
PP = $55.85
|
|
MB = $58.64
|
Most Recent Note - 8/16/2010 5:15:10 PM
G - Gain today on light volume. Volume totals have been cooling while consolidating after getting extended from any sound base. Prior highs in the $62 area define initial chart support.
>>> The latest Featured Stock Update with an annotated graph appeared on 7/23/2010. Click here.
View all notes |
Alert me of new notes |
CANSLIM.net Company Profile |
SEC |
Zacks Reports |
StockTalk |
News |
Chart |
Request a new note
C
A N
S L
I M
|
MRX
-
NYSE
Medicis Pharmaceut Cl A
DRUGS - Biotechnology
|
$26.76
|
+0.36
1.36% |
$27.06
|
687,094
61.24% of 50 DAV
50 DAV is 1,121,900
|
$28.15
-4.94%
|
8/12/2010
|
$26.88
|
PP = $26.71
|
|
MB = $28.05
|
Most Recent Note - 8/13/2010 4:51:11 PM
Y - Small gain today with light volume followed a couple of distribution days, pulling back from its 52-week high after its 8/06/10 breakout from a sound base. The high-ranked Medical - Ethical Drugs firm was featured in the mid-day report on 8/12/10 (read here) and noted for its strong quarterly and annual earnings history.
>>> The latest Featured Stock Update with an annotated graph appeared on 8/12/2010. Click here.
View all notes |
Alert me of new notes |
CANSLIM.net Company Profile |
SEC |
Zacks Reports |
StockTalk |
News |
Chart |
Request a new note
C
A N
S L
I M
|
MWIV
-
NASDAQ
M W I Veterinary Supply
HEALTH SERVICES - Medical Instruments and; Supplies
|
$49.20
|
+1.21
2.52% |
$49.21
|
100,180
137.05% of 50 DAV
50 DAV is 73,100
|
$54.48
-9.69%
|
7/29/2010
|
$52.05
|
PP = $52.09
|
|
MB = $54.69
|
Most Recent Note - 8/16/2010 5:18:01 PM
G - Gain today with above average volume, but it remains below its 50 DMA line after a damaging violation on 8/11/10 raised concerns. Recent lows in the $46 area define the next important chart support level.
>>> The latest Featured Stock Update with an annotated graph appeared on 7/30/2010. Click here.
View all notes |
Alert me of new notes |
CANSLIM.net Company Profile |
SEC |
Zacks Reports |
StockTalk |
News |
Chart |
Request a new note
C
A N
S L
I M
|
Symbol/Exchange
Company Name
Industry Group |
PRICE |
CHANGE
(%Change) |
Day High |
Volume
(% DAV)
(% 50 day avg vol) |
52 Wk Hi
% From Hi |
Featured
Date |
Price
Featured |
Pivot Featured |
|
Max Buy |
NEM
-
NYSE
Newmont Mining Corp
METALS and MINING - Gold
|
$57.71
|
+0.99
1.75% |
$57.83
|
3,529,757
43.53% of 50 DAV
50 DAV is 8,107,900
|
$63.38
-8.95%
|
6/22/2010
|
$59.60
|
PP = $59.67
|
|
MB = $62.65
|
Most Recent Note - 8/13/2010 4:53:59 PM
G - Still closing below its 50 DMA line today. Distributional action in recent weeks has been followed by no gains with average or higher volume.
>>> The latest Featured Stock Update with an annotated graph appeared on 8/6/2010. Click here.
View all notes |
Alert me of new notes |
CANSLIM.net Company Profile |
SEC |
Zacks Reports |
StockTalk |
News |
Chart |
Request a new note
C
A N
S L
I M
|
NEOG
-
NASDAQ
Neogen Corp
DRUGS - Diagnostic Substances
|
$27.80
|
+0.30
1.09% |
$27.87
|
43,937
49.53% of 50 DAV
50 DAV is 88,700
|
$30.39
-8.52%
|
7/22/2010
|
$27.19
|
PP = $27.87
|
|
MB = $29.26
|
Most Recent Note - 8/13/2010 4:56:13 PM
G - Halted its slide this week near its 50 DMA line and prior highs in the $27 area defining important technical support. The slump below its pivot point negated its recent breakout raising concerns, and its color code is changed to green
>>> The latest Featured Stock Update with an annotated graph appeared on 7/22/2010. Click here.
View all notes |
Alert me of new notes |
CANSLIM.net Company Profile |
SEC |
Zacks Reports |
StockTalk |
News |
Chart |
Request a new note
C
A N
S L
I M
|
NFLX
-
NASDAQ
Netflix Inc
SPECIALTY RETAIL - Music and Video Stores
|
$137.22
|
+4.96
3.75% |
$137.90
|
6,094,301
146.79% of 50 DAV
50 DAV is 4,151,600
|
$134.37
2.12%
|
8/10/2010
|
$124.05
|
PP = $124.00
|
|
MB = $130.20
|
Most Recent Note - 8/16/2010 5:20:21 PM
G - Hit another new all-time high today with another gain on above average volume, closing near the session high. It is extended from prior highs that define important chart support now in the $124-127 area.
>>> The latest Featured Stock Update with an annotated graph appeared on 8/10/2010. Click here.
View all notes |
Alert me of new notes |
CANSLIM.net Company Profile |
SEC |
Zacks Reports |
StockTalk |
News |
Chart |
Request a new note
C
A N
S L
I M
|
ROVI
-
NASDAQ
Rovi Corp
COMPUTER SOFTWARE andamp; SERVICES - Security Software andamp; Services
|
$42.06
|
+0.27
0.65% |
$42.43
|
995,030
85.84% of 50 DAV
50 DAV is 1,159,200
|
$44.96
-6.45%
|
6/3/2010
|
$38.70
|
PP = $40.16
|
|
MB = $42.17
|
Most Recent Note - 8/13/2010 4:58:17 PM
Y - Losses this week have it dipping under its "max buy" level toward recent chart lows. Color code was changed to yellow. Prior highs in the $40 area and its 50 DMA line define chart support.
>>> The latest Featured Stock Update with an annotated graph appeared on 7/21/2010. Click here.
View all notes |
Alert me of new notes |
CANSLIM.net Company Profile |
SEC |
Zacks Reports |
StockTalk |
News |
Chart |
Request a new note
C
A N
S L
I M
|
SHOO
-
NASDAQ
Steven Madden Limited
CONSUMER NON-DURABLES - Textile - Apparel Footwear
|
$35.05
|
+0.04
0.11% |
$35.48
|
272,778
62.31% of 50 DAV
50 DAV is 437,800
|
$40.98
-14.47%
|
8/5/2010
|
$39.55
|
PP = $41.08
|
|
MB = $43.13
|
Most Recent Note - 8/13/2010 5:02:53 PM
G - Down today on light volume. Slumping near its 50 DMA line with its 6th consecutive loss, its color code is changed to green.
>>> The latest Featured Stock Update with an annotated graph appeared on 8/5/2010. Click here.
View all notes |
Alert me of new notes |
CANSLIM.net Company Profile |
SEC |
Zacks Reports |
StockTalk |
News |
Chart |
Request a new note
C
A N
S L
I M
|
Symbol/Exchange
Company Name
Industry Group |
PRICE |
CHANGE
(%Change) |
Day High |
Volume
(% DAV)
(% 50 day avg vol) |
52 Wk Hi
% From Hi |
Featured
Date |
Price
Featured |
Pivot Featured |
|
Max Buy |
VIT
-
NYSE
Vanceinfo Tech Inc Ads
COMPUTER SOFTWARE and SERVICES - Business Software and Services
|
$26.21
|
-0.19
-0.72% |
$26.69
|
578,039
115.96% of 50 DAV
50 DAV is 498,500
|
$27.96
-6.26%
|
7/8/2010
|
$25.20
|
PP = $26.58
|
|
MB = $27.91
|
Most Recent Note - 8/16/2010 5:40:00 PM
Y - Small loss today on higher volume is indicative of more distributional pressure. Its 7/29/10 low ($24.55) defines initial support above its 50 DMA line.
>>> The latest Featured Stock Update with an annotated graph appeared on 7/26/2010. Click here.
View all notes |
Alert me of new notes |
CANSLIM.net Company Profile |
SEC |
Zacks Reports |
StockTalk |
News |
Chart |
Request a new note
C
A N
S L
I M
|
|
|
|
THESE ARE NOT BUY RECOMMENDATIONS!
Comments contained in the body of this report are technical
opinions only. The material herein has been obtained
from sources believed to be reliable and accurate, however,
its accuracy and completeness cannot be guaranteed.
This site is not an investment advisor, hence it does
not endorse or recommend any securities or other investments.
Any recommendation contained in this report may not
be suitable for all investors and it is not to be deemed
an offer or solicitation on our part with respect to
the purchase or sale of any securities. All trademarks,
service marks and trade names appearing in this report
are the property of their respective owners, and are
likewise used for identification purposes only.
This report is a service available
only to active Paid Premium Members.
You may opt-out of receiving report notifications
at any time. Questions or comments may be submitted
by writing to Premium Membership Services 665 S.E. 10 Street, Suite 201 Deerfield Beach, FL 33441-5634 or by calling 1-800-965-8307
or 954-785-1121.
|
|
|


