You are not logged in.
This means you
CAN ONLY VIEW reports that were published prior to Tuesday, March 25, 2025.
You
MUST UPGRADE YOUR MEMBERSHIP if you want to see any current reports.
AFTER MARKET UPDATE - FRIDAY, AUGUST 13TH, 2010
Previous After Market Report Next After Market Report >>>
|
|
|
|
DOW |
-16.80 |
10,303.15 |
-0.16% |
|
Volume |
871,615,220 |
-13% |
|
Volume |
1,574,487,190 |
-27% |
|
NASDAQ |
-16.79 |
2,173.48 |
-0.77% |
|
Advancers |
1,370 |
44% |
|
Advancers |
798 |
29% |
|
S&P 500 |
-4.36 |
1,079.25 |
-0.40% |
|
Decliners |
1,657 |
53% |
|
Decliners |
1,810 |
66% |
|
Russell 2000 |
-7.49 |
609.49 |
-1.21% |
|
52 Wk Highs |
147 |
|
|
52 Wk Highs |
16 |
|
|
S&P 600 |
-4.35 |
326.46 |
-1.31% |
|
52 Wk Lows |
54 |
|
|
52 Wk Lows |
120 |
|
|
 |
Major Averages Endured Damaging Distribution This Week
Adam Sarhan, Contributing Writer,
For the week, the major averages ended in the red as fear spread that the global economic recovery may begin to wane and the US dollar soared. Volume totals on Friday were reported lower on the NYSE and on the Nasdaq exchanges versus the prior session, which was a sign that institutional investors were not dumping shares aggressively. Decliners narrowly led advancers by approximately an 8-to-7 ratio on the NYSE, yet decliners led advancers by over a 2-to-1 ratio on the Nasdaq exchange. New 52-week highs outnumbered new 52-week lows on the NYSE but trailed new lows by a large margin on the Nasdaq exchange. There were only 6 high-ranked companies from the CANSLIM.net Leaders List made a new 52-week high and appeared on the CANSLIM.net BreakOuts Page, up slightly from the 3 issues that appeared on the prior session.
Stocks closed higher on Monday after McDonald’s Corp. (MCD -0.24%) topped sales estimates and gapped up to a fresh 52-week high and Ebay Inc. (EBAY -0.42%) rallied after its former unit Skype SA filed for an initial public offering for $100 million. Stocks got smacked on Tuesday as investors digested weak economic data from China and the US and the Federal Reserve decided to hold rates steady at 0-.25%. Chinese imports disappointed analysts lofty estimates which led many to question the health of the ongoing recovery. In the US, stocks opened lower after US productivity fell for the first time in 18 months and a decline in small business leaders' optimism led many to question the health of the ongoing global recovery. The Fed held rates steady near record lows but the big news was that they said they will reinvest principle payments on their mortgage holdings into long-term Treasury securities, which is their first attempt to spark economic growth in over a year.
The selling continued on Wednesday after a weaker than expected manufacturing report was released from China and the US trade gap widened. China released a weaker than expected manufacturing report which heretofore has been one of the strongest sectors of China's robust economy. This led many to question whether or not China's strong economy will be able to offset weakness in other areas of the global recovery. In the US, the trade deficit unexpectedly grew in June to the highest level since October 2008. The report showed that consumer goods imports rose to a record level and exports fell. Fears of a global economic slowdown sent the US dollar soaring which also put pressure on a slew of dollar denominated assets (mainly stocks and commodities).
Stocks ended lower on Thursday after after jobless claims rose and the latest round of Q2 earnings fell short of analysts' estimates. The Labor Department said unemployment claims unexpectedly rose to the highest level in five months and several well-known tech stocks got whacked after Cisco Systems (CSCO) released disappointing Q2 results. The sour outlook weighed on the Nasdaq Composite Index where many high profile tech stocks reside. Stocks ended lower on Friday after retail sales edged higher but fell short of the Street's estimates while consumer prices rose which helped ease deflation woes.
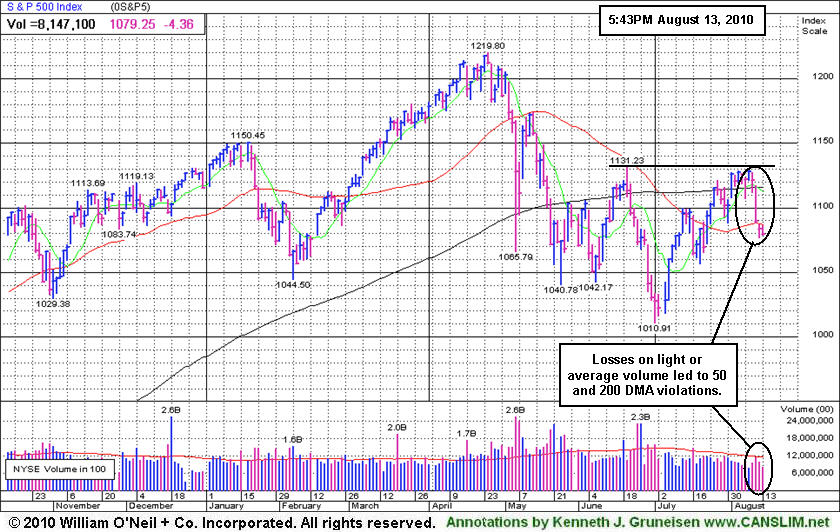
The technical action in the major averages has deteriorated significantly. Not all of the major averages managed to rally above their recent chart highs, and all have now sliced back below their respective 200-day moving average (DMA) lines. It is also worrisome to see the number of distribution days pile up in recent weeks which puts pressure on the current five-week rally. Whenever a market rally becomes under pressure (as it is now), it is usually wise to err on the side of caution and adopt a strong defensive stance until the bulls regain control. Trade accordingly.
Are You Capitalizing On The Current Rally?
Our skilled team of portfolio managers knows how to follow the rules of this fact-based investment system. We do not follow opinion or the "conviction list" of some large Wall Street institution which would have us fully invested even during horrific bear markets. Instead, we remain fluid and only buy the best stocks when they are triggering proper technical buy signals. If you are not completely satisfied with the way your portfolio is being managed, Click here to submit your inquiry. *Accounts over $250,000 please. ** Serious inquires only.
PICTURED: The benchmark S&P 500 Index has slumped below its 50 and 200 MA lines with 4 consecutive losses on light or average volume.
|
|
|
 |
Weakening Financial Indexes Hurting Broader Market Outlook
Kenneth J. Gruneisen - Passed the CAN SLIM® Master's Exam
The Gold & Silver Index ($XAU -1.00%) ended with a loss, and there was mild weakness across the board in the tech sector as the Semiconductor Index ($SOX -0.92%), Internet Index ($IIX -0.51%), Biotechnology Index ($BTK -0.49%), and Networking Index ($NWX -0.25%) drifted lower. Modest losses for the Retail Index ($RLX -1.42%) and Broker/Dealer Index ($XBD -1.08%) contributed to the major averages' negative bias on Friday. Meanwhile, the Bank Index ($BKX -0.22%) and many other groups ended the week quietly. Energy-related shares were quiet as the Integrated Oil Index ($XOI -0.13%) and Oil Services Index ($OSX -0.11%) edged lower. The Healthcare Index ($HMO +0.02%) was a standout on Friday as it simply held its ground.
Charts courtesy www.stockcharts.com
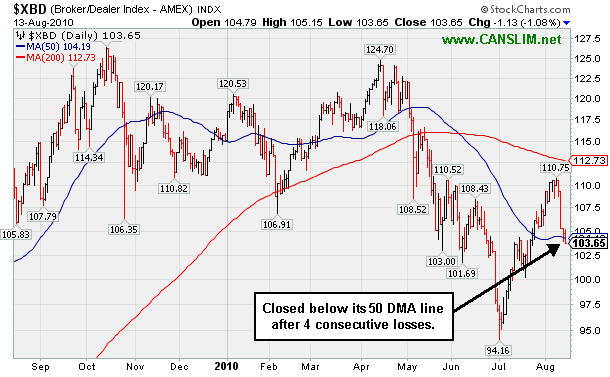
PICTURED 1: The Broker/Dealer Index ($XBD -1.08%) closed below its 50 DMA line after 4 consecutive losses.
Charts courtesy www.stockcharts.com
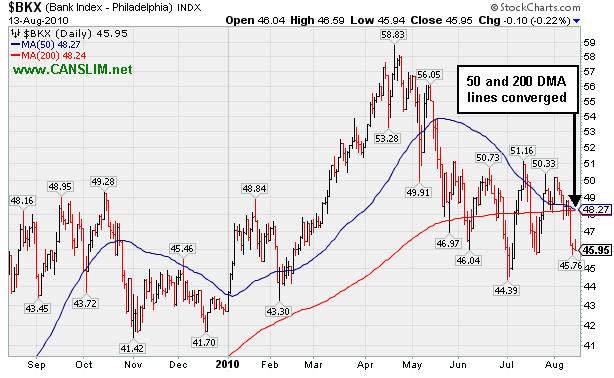
PICTURED 2: The Bank Index ($BKX -0.22%) has been slumping toward its 2010 low and its 50 and 200 DMA lines have converged.
| Oil Services |
$OSX |
177.56 |
-0.20 |
-0.11% |
-8.91% |
| Healthcare |
$HMO |
1,497.98 |
+0.27 |
+0.02% |
+1.70% |
| Integrated Oil |
$XOI |
977.60 |
-1.25 |
-0.13% |
-8.48% |
| Semiconductor |
$SOX |
322.74 |
-3.01 |
-0.92% |
-10.33% |
| Networking |
$NWX |
226.68 |
-0.56 |
-0.25% |
-1.89% |
| Internet |
$IIX |
242.40 |
-1.24 |
-0.51% |
+3.65% |
| Broker/Dealer |
$XBD |
103.65 |
-1.13 |
-1.08% |
-9.91% |
| Retail |
$RLX |
399.98 |
-5.75 |
-1.42% |
-2.71% |
| Gold & Silver |
$XAU |
172.40 |
-1.74 |
-1.00% |
+2.47% |
| Bank |
$BKX |
45.95 |
-0.10 |
-0.22% |
+7.59% |
| Biotech |
$BTK |
1,078.63 |
-5.29 |
-0.49% |
+14.49% |
|
|
|
 |
Consolidation After Wedging To Highs Without Great Volume
Kenneth J. Gruneisen - Passed the CAN SLIM® Master's Exam
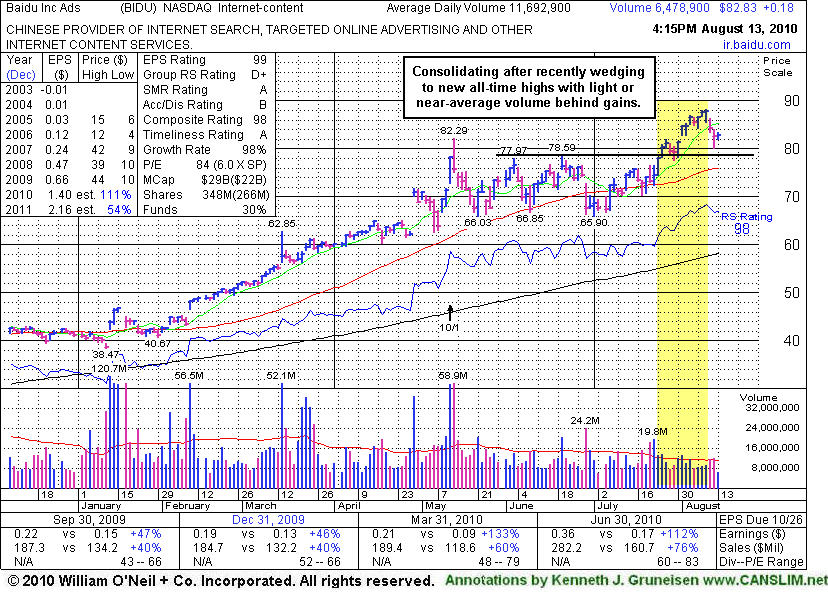
Baidu.com, Inc. (BIDU +$0.18 or +0.22% to $82.83) is consolidating above prior highs that define technical support along with its 50-day moving average (DMA) line. Since its last FSU section appearance on 7/14/10 under the headline "Longer Base Pattern Has Bullish Potential" its gains above resistance in the $78 area were an encouraging sign but they lacked great volume conviction. Now its prior highs define important chart support.
BIDU has a stellar sales and earnings history that satisfies the C & A criteria, and the recently reported quarter ended June 30, 2010 showed sales revenues still accelerating impressively. The number of top-rated funds owning shares is being reported at 202 in Mar '10, and 207 in Jun '10, a slightly positive trend with respect to institutional ownership (I criteria). However, the lack of leadership (L criteria) in the group is of some concern, with the Internet - Content group RS rating a 26 now, very low on the 1-99 scale.
Keep in mind that BIDU has traded up more than 8-fold, and it has not been a smooth ride since it first featured on Monday, October 30, 2006 in the CANSLIM.net Mid Day Breakouts Report (read here). After making great progress it went through a multi-month consolidation under its 50 and 20 DMA lines, then later returned as a noteworthy leader featured in CANSLIM.net reports. An annotated graph showed a vivid picture at the beginning of the stock's period of greatest weakness back on January 11, 2008 under the headline, "Weakness Hurting Chances For Featured Favorite" (read here). Take a look back at that now! Remember that a dropped stock can be featured again in a future CANSLIM.net report if it repairs its technical damage and forms a new pivot point.
 |
|
|
Color Codes Explained :
Y - Better candidates highlighted by our
staff of experts.
G - Previously featured
in past reports as yellow but may no longer be buyable under the
guidelines.
***Last / Change / Volume data in this table is the closing quote data***
Symbol/Exchange
Company Name
Industry Group |
PRICE |
CHANGE
(%Change) |
Day High |
Volume
(% DAV)
(% 50 day avg vol) |
52 Wk Hi
% From Hi |
Featured
Date |
Price
Featured |
Pivot Featured |
|
Max Buy |
AAPL
-
NASDAQ
Apple Inc
COMPUTER HARDWARE - Personal Computers
|
$249.10
|
-2.69
-1.07% |
$251.88
|
12,654,677
50.50% of 50 DAV
50 DAV is 25,057,300
|
$279.01
-10.72%
|
6/17/2010
|
$270.95
|
PP = $272.56
|
|
MB = $286.19
|
 Most Recent Note - 8/13/2010 4:06:31 PM
G - Slumped below its 50 DMA line this week raising concerns and its color code was changed to green based on the deterioration. A rally above its recent high near $266 is needed for its outlook to improve, meanwhile the recent chart low ($239) defines an important support level.
>>> The latest Featured Stock Update with an annotated graph appeared on 8/9/2010. Click here.
View all notes |
Alert me of new notes |
CANSLIM.net Company Profile |
SEC |
Zacks Reports |
StockTalk |
News |
Chart |
Request a new note
C
A N
S L
I M


|
ABV
-
NYSE
Comp De Bebidas Adr
FOOD and BEVERAGE - Beverages - Brewers
|
$104.31
|
-0.14
-0.13% |
$105.50
|
476,196
70.83% of 50 DAV
50 DAV is 672,300
|
$112.60
-7.36%
|
6/29/2010
|
$104.74
|
PP = $109.33
|
|
MB = $114.80
|
Most Recent Note - 8/13/2010 4:10:28 PM
G - This Brazil-based beverage firm slumped under its 50 DMA line this week and its color code was changed to green.
>>> The latest Featured Stock Update with an annotated graph appeared on 7/20/2010. Click here.
View all notes |
Alert me of new notes |
CANSLIM.net Company Profile |
SEC |
Zacks Reports |
StockTalk |
News |
Chart |
Request a new note
C
A N
S L
I M
|
BIDU
-
NASDAQ
Baidu Inc Ads
INTERNET - Internet Information Providers
|
$82.83
|
+0.18
0.22% |
$83.50
|
6,495,086
55.82% of 50 DAV
50 DAV is 11,636,700
|
$88.32
-6.22%
|
7/14/2010
|
$75.03
|
PP = $78.59
|
|
MB = $82.52
|
Most Recent Note - 8/13/2010 4:26:50 PM
G - Consolidating above prior highs that define technical support along with its 50 DMA line.
>>> The latest Featured Stock Update with an annotated graph appeared on 8/13/2010. Click here.
View all notes |
Alert me of new notes |
CANSLIM.net Company Profile |
SEC |
Zacks Reports |
StockTalk |
News |
Chart |
Request a new note
C
A N
S L
I M
|
CACC
-
NASDAQ
Credit Acceptance Corp
FINANCIAL SERVICES - Credit Services
|
$57.89
|
-0.20
-0.34% |
$58.92
|
30,224
57.90% of 50 DAV
50 DAV is 52,200
|
$59.75
-3.11%
|
7/29/2010
|
$52.04
|
PP = $54.07
|
|
MB = $56.77
|
Most Recent Note - 8/13/2010 4:28:22 PM
G - Stubbornly holding its ground this week near its 52-week high after getting extended from its base with recent gains on above average volume. Prior highs in the $54 area define initial chart support to watch.
>>> The latest Featured Stock Update with an annotated graph appeared on 8/2/2010. Click here.
View all notes |
Alert me of new notes |
CANSLIM.net Company Profile |
SEC |
Zacks Reports |
StockTalk |
News |
Chart |
Request a new note
C
A N
S L
I M
|
CRM
-
NYSE
Salesforce.Com Inc
INTERNET - Internet Software and Services
|
$97.24
|
+0.29
0.30% |
$98.20
|
1,942,552
79.82% of 50 DAV
50 DAV is 2,433,600
|
$104.44
-6.89%
|
6/2/2010
|
$88.44
|
PP = $89.60
|
|
MB = $94.08
|
Most Recent Note - 8/13/2010 4:38:59 PM
G - Endured distributional pressure this week and slumped near support at prior highs near $97, nearly testing its 50 DMA line.
>>> The latest Featured Stock Update with an annotated graph appeared on 7/15/2010. Click here.
View all notes |
Alert me of new notes |
CANSLIM.net Company Profile |
SEC |
Zacks Reports |
StockTalk |
News |
Chart |
Request a new note
C
A N
S L
I M
|
Symbol/Exchange
Company Name
Industry Group |
PRICE |
CHANGE
(%Change) |
Day High |
Volume
(% DAV)
(% 50 day avg vol) |
52 Wk Hi
% From Hi |
Featured
Date |
Price
Featured |
Pivot Featured |
|
Max Buy |
DTSI
-
NASDAQ
D T S Inc
CONSUMER DURABLES - Electronic Equipment
|
$33.97
|
-0.66
-1.91% |
$34.88
|
99,448
101.79% of 50 DAV
50 DAV is 97,700
|
$37.60
-9.65%
|
7/27/2010
|
$37.00
|
PP = $36.28
|
|
MB = $38.09
|
Most Recent Note - 8/13/2010 4:41:26 PM
G - Completely negated its recent breakout and violated its 50 DMA line this week. It will be dropped from the Featured Stocks list tonight. The high-ranked Consumer Products - Electronic firm's latest quarter ended June 30, 2010 showed earnings -67% on -28% sales revenues versus the year ago period. The fundamental flaw in its earnings history is very disappointing with respect to the C criteria now, and its color code was changed to green.
>>> The latest Featured Stock Update with an annotated graph appeared on 7/27/2010. Click here.
View all notes |
Alert me of new notes |
CANSLIM.net Company Profile |
SEC |
Zacks Reports |
StockTalk |
News |
Chart |
Request a new note
C
A N
S L
I M
|
FFIV
-
NASDAQ
F 5 Networks Inc
INTERNET - Internet Software and Services
|
$83.88
|
+1.11
1.34% |
$84.96
|
1,451,310
86.35% of 50 DAV
50 DAV is 1,680,800
|
$92.70
-9.51%
|
6/16/2010
|
$74.50
|
PP = $74.10
|
|
MB = $77.81
|
Most Recent Note - 8/13/2010 4:42:44 PM
G - Halted its slide today with a gain on light volume after 2 consecutive damaging gaps down. Recently noted as -"extended from any sound base after recent volume-driven gains, it could go on to produce more climactic gains."
>>> The latest Featured Stock Update with an annotated graph appeared on 8/4/2010. Click here.
View all notes |
Alert me of new notes |
CANSLIM.net Company Profile |
SEC |
Zacks Reports |
StockTalk |
News |
Chart |
Request a new note
C
A N
S L
I M
|
FOSL
-
NASDAQ
Fossil Inc
CONSUMER DURABLES - Recreational Goods, Other
|
$43.70
|
-0.48
-1.09% |
$44.16
|
542,920
62.38% of 50 DAV
50 DAV is 870,400
|
$46.30
-5.62%
|
8/10/2010
|
$45.54
|
PP = $42.69
|
|
MB = $44.82
|
Most Recent Note - 8/13/2010 4:46:09 PM
Y - Consolidating quietly below its "max buy" level following a considerable "breakaway gap" this week for a new 52-week high and all-time high.
>>> The latest Featured Stock Update with an annotated graph appeared on 8/11/2010. Click here.
View all notes |
Alert me of new notes |
CANSLIM.net Company Profile |
SEC |
Zacks Reports |
StockTalk |
News |
Chart |
Request a new note
C
A N
S L
I M
|
MELI
-
NASDAQ
Mercadolibre Inc
INTERNET - Internet Software and; Services
|
$65.53
|
-0.89
-1.34% |
$67.01
|
361,646
34.59% of 50 DAV
50 DAV is 1,045,400
|
$68.67
-4.57%
|
5/13/2010
|
$54.21
|
PP = $55.85
|
|
MB = $58.64
|
Most Recent Note - 8/13/2010 4:47:39 PM
G - Volume totals have been cooling while consolidating after getting extended from any sound base. Prior highs in the $62 area define initial chart support.
>>> The latest Featured Stock Update with an annotated graph appeared on 7/23/2010. Click here.
View all notes |
Alert me of new notes |
CANSLIM.net Company Profile |
SEC |
Zacks Reports |
StockTalk |
News |
Chart |
Request a new note
C
A N
S L
I M
|
MRX
-
NYSE
Medicis Pharmaceut Cl A
DRUGS - Biotechnology
|
$26.60
|
+0.20
0.76% |
$26.83
|
877,240
81.04% of 50 DAV
50 DAV is 1,082,500
|
$28.15
-5.51%
|
8/12/2010
|
$26.88
|
PP = $26.71
|
|
MB = $28.05
|
Most Recent Note - 8/13/2010 4:51:11 PM
Y - Small gain today with light volume followed a couple of distribution days, pulling back from its 52-week high after its 8/06/10 breakout from a sound base. The high-ranked Medical - Ethical Drugs firm was featured in the mid-day report on 8/12/10 (read here) and noted for its strong quarterly and annual earnings history.
>>> The latest Featured Stock Update with an annotated graph appeared on 8/12/2010. Click here.
View all notes |
Alert me of new notes |
CANSLIM.net Company Profile |
SEC |
Zacks Reports |
StockTalk |
News |
Chart |
Request a new note
C
A N
S L
I M
|
Symbol/Exchange
Company Name
Industry Group |
PRICE |
CHANGE
(%Change) |
Day High |
Volume
(% DAV)
(% 50 day avg vol) |
52 Wk Hi
% From Hi |
Featured
Date |
Price
Featured |
Pivot Featured |
|
Max Buy |
MWIV
-
NASDAQ
M W I Veterinary Supply
HEALTH SERVICES - Medical Instruments and; Supplies
|
$47.99
|
-1.19
-2.42% |
$49.72
|
38,213
51.50% of 50 DAV
50 DAV is 74,200
|
$54.48
-11.91%
|
7/29/2010
|
$52.05
|
PP = $52.09
|
|
MB = $54.69
|
Most Recent Note - 8/13/2010 4:52:57 PM
G - A damaging violation of its 50 DMA line this week has raised concerns. Recent lows in the $46 area define the next important chart support level.
>>> The latest Featured Stock Update with an annotated graph appeared on 7/30/2010. Click here.
View all notes |
Alert me of new notes |
CANSLIM.net Company Profile |
SEC |
Zacks Reports |
StockTalk |
News |
Chart |
Request a new note
C
A N
S L
I M
|
NEM
-
NYSE
Newmont Mining Corp
METALS and MINING - Gold
|
$56.72
|
-1.03
-1.78% |
$57.90
|
4,423,473
53.51% of 50 DAV
50 DAV is 8,266,300
|
$63.38
-10.51%
|
6/22/2010
|
$59.60
|
PP = $59.67
|
|
MB = $62.65
|
Most Recent Note - 8/13/2010 4:53:59 PM
G - Still closing below its 50 DMA line today. Distributional action in recent weeks has been followed by no gains with average or higher volume.
>>> The latest Featured Stock Update with an annotated graph appeared on 8/6/2010. Click here.
View all notes |
Alert me of new notes |
CANSLIM.net Company Profile |
SEC |
Zacks Reports |
StockTalk |
News |
Chart |
Request a new note
C
A N
S L
I M
|
NEOG
-
NASDAQ
Neogen
DRUGS - Diagnostic Substances
|
$27.50
|
-0.04
-0.15% |
$27.95
|
85,192
94.24% of 50 DAV
50 DAV is 90,400
|
$30.39
-9.51%
|
7/22/2010
|
$27.19
|
PP = $27.87
|
|
MB = $29.26
|
Most Recent Note - 8/13/2010 4:56:13 PM
G - Halted its slide this week near its 50 DMA line and prior highs in the $27 area defining important technical support. The slump below its pivot point negated its recent breakout raising concerns, and its color code is changed to green
>>> The latest Featured Stock Update with an annotated graph appeared on 7/22/2010. Click here.
View all notes |
Alert me of new notes |
CANSLIM.net Company Profile |
SEC |
Zacks Reports |
StockTalk |
News |
Chart |
Request a new note
C
A N
S L
I M
|
NFLX
-
NASDAQ
Netflix Inc
SPECIALTY RETAIL - Music and Video Stores
|
$132.26
|
-0.79
-0.59% |
$134.37
|
6,746,324
179.54% of 50 DAV
50 DAV is 3,757,500
|
$133.80
-1.15%
|
8/10/2010
|
$124.05
|
PP = $124.00
|
|
MB = $130.20
|
Most Recent Note - 8/13/2010 4:56:37 PM
G - Held its ground today at an all-time high after a streak of big gains with above average volume helped it rally above its "max buy" level. Its prior high at $124 is an important chart support level to watch now.
>>> The latest Featured Stock Update with an annotated graph appeared on 8/10/2010. Click here.
View all notes |
Alert me of new notes |
CANSLIM.net Company Profile |
SEC |
Zacks Reports |
StockTalk |
News |
Chart |
Request a new note
C
A N
S L
I M
|
ROVI
-
NASDAQ
Rovi Corp
COMPUTER SOFTWARE andamp; SERVICES - Security Software andamp; Services
|
$41.79
|
-0.27
-0.64% |
$42.35
|
749,959
62.80% of 50 DAV
50 DAV is 1,194,200
|
$44.96
-7.05%
|
6/3/2010
|
$38.70
|
PP = $40.16
|
|
MB = $42.17
|
Most Recent Note - 8/13/2010 4:58:17 PM
Y - Losses this week have it dipping under its "max buy" level toward recent chart lows. Color code was changed to yellow. Prior highs in the $40 area and its 50 DMA line define chart support.
>>> The latest Featured Stock Update with an annotated graph appeared on 7/21/2010. Click here.
View all notes |
Alert me of new notes |
CANSLIM.net Company Profile |
SEC |
Zacks Reports |
StockTalk |
News |
Chart |
Request a new note
C
A N
S L
I M
|
Symbol/Exchange
Company Name
Industry Group |
PRICE |
CHANGE
(%Change) |
Day High |
Volume
(% DAV)
(% 50 day avg vol) |
52 Wk Hi
% From Hi |
Featured
Date |
Price
Featured |
Pivot Featured |
|
Max Buy |
SHOO
-
NASDAQ
Steven Madden Limited
CONSUMER NON-DURABLES - Textile - Apparel Footwear
|
$35.01
|
-0.87
-2.42% |
$35.78
|
317,302
74.34% of 50 DAV
50 DAV is 426,800
|
$40.98
-14.57%
|
8/5/2010
|
$39.55
|
PP = $41.08
|
|
MB = $43.13
|
Most Recent Note - 8/13/2010 5:02:53 PM
G - Down today on light volume. Slumping near its 50 DMA line with its 6th consecutive loss, its color code is changed to green.
>>> The latest Featured Stock Update with an annotated graph appeared on 8/5/2010. Click here.
View all notes |
Alert me of new notes |
CANSLIM.net Company Profile |
SEC |
Zacks Reports |
StockTalk |
News |
Chart |
Request a new note
C
A N
S L
I M
|
ULTA
-
NASDAQ
Ulta Salon Cosm & Frag
SPECIALTY RETAIL - Specialty Retail, Other
|
$22.18
|
-0.79
-3.44% |
$23.05
|
449,214
62.84% of 50 DAV
50 DAV is 714,900
|
$26.75
-17.08%
|
8/4/2010
|
$24.90
|
PP = $26.85
|
|
MB = $28.19
|
Most Recent Note - 8/13/2010 5:05:27 PM
G - Losses this week led to a 50 DMA line violation and raised concerns. Based on weak action it will be dropped from the Featured Stocks list tonight. Prior lows and its 200 DMA line define important support in the $21-22 area.
>>> The latest Featured Stock Update with an annotated graph appeared on 7/19/2010. Click here.
View all notes |
Alert me of new notes |
CANSLIM.net Company Profile |
SEC |
Zacks Reports |
StockTalk |
News |
Chart |
Request a new note
C
A N
S L
I M
|
VIT
-
NYSE
Vanceinfo Tech Inc Ads
COMPUTER SOFTWARE and SERVICES - Business Software and Services
|
$26.40
|
+0.23
0.88% |
$26.67
|
317,171
65.02% of 50 DAV
50 DAV is 487,800
|
$27.96
-5.58%
|
7/8/2010
|
$25.20
|
PP = $26.58
|
|
MB = $27.91
|
Most Recent Note - 8/13/2010 5:07:13 PM
Y - Halted its slide this week after enduring some distributional pressure. Its 7/29/10 low ($24.55) defines initial support above its 50 DMA line.
>>> The latest Featured Stock Update with an annotated graph appeared on 7/26/2010. Click here.
View all notes |
Alert me of new notes |
CANSLIM.net Company Profile |
SEC |
Zacks Reports |
StockTalk |
News |
Chart |
Request a new note
C
A N
S L
I M
|
|
|
|
THESE ARE NOT BUY RECOMMENDATIONS!
Comments contained in the body of this report are technical
opinions only. The material herein has been obtained
from sources believed to be reliable and accurate, however,
its accuracy and completeness cannot be guaranteed.
This site is not an investment advisor, hence it does
not endorse or recommend any securities or other investments.
Any recommendation contained in this report may not
be suitable for all investors and it is not to be deemed
an offer or solicitation on our part with respect to
the purchase or sale of any securities. All trademarks,
service marks and trade names appearing in this report
are the property of their respective owners, and are
likewise used for identification purposes only.
This report is a service available
only to active Paid Premium Members.
You may opt-out of receiving report notifications
at any time. Questions or comments may be submitted
by writing to Premium Membership Services 665 S.E. 10 Street, Suite 201 Deerfield Beach, FL 33441-5634 or by calling 1-800-965-8307
or 954-785-1121.
|
|
|


