You are not logged in.
This means you
CAN ONLY VIEW reports that were published prior to Thursday, April 10, 2025.
You
MUST UPGRADE YOUR MEMBERSHIP if you want to see any current reports.
AFTER MARKET UPDATE - FRIDAY, AUGUST 8TH, 2014
Previous After Market Report Next After Market Report >>>
|
|
|
|
DOW |
+185.66 |
16,553.93 |
+1.13% |
|
Volume |
615,796,850 |
-6% |
|
Volume |
1,647,435,990 |
-5% |
|
NASDAQ |
+35.93 |
4,370.90 |
+0.83% |
|
Advancers |
2,336 |
74% |
|
Advancers |
1,933 |
67% |
|
S&P 500 |
+22.02 |
1,931.59 |
+1.15% |
|
Decliners |
748 |
24% |
|
Decliners |
842 |
29% |
|
Russell 2000 |
+11.59 |
1,131.35 |
+1.04% |
|
52 Wk Highs |
49 |
|
|
52 Wk Highs |
33 |
|
|
S&P 600 |
+6.11 |
652.14 |
+0.95% |
|
52 Wk Lows |
59 |
|
|
52 Wk Lows |
80 |
|
|
 |
Major Averages Rebounded for Weekly Gains
Kenneth J. Gruneisen - Passed the CAN SLIM® Master's Exam
Thanks to Friday's gains, the major averages finished in positive territory for the week. The Dow posted a weekly gain of +0.4%, the S&P 500 increased +0.3% and the NASDAQ added +0.4%. Volume totals were lighter than Thursday's totals on both major exchanges, however, revealing a lack of institutional buying demand. Breadth was positive as advancers led decliners by more than a 3-1 margin on the NYSE and more than a 2-1 margin on the Nasdaq exchange. There were 13 high-ranked companies from the CANSLIM.net Leaders List that made new 52-week highs and appeared on the CANSLIM.net BreakOuts Page, up from the prior session total of 7 stocks. New 52-week lows outnumbered new 52-week highs on the NYSE and on the Nasdaq exchange. There were gains for 10 of the 11 of the high-ranked companies currently included on the Featured Stocks Page. The market (M criteria) deterioration recently earned the label of a "correction" as the technical damage became significant to chart readers and leadership (stocks hitting new 52-week highs) waned. Disciplined investors limit losses and reduce market exposure during rough market periods by selling any stocks which fall more than -7% from their purchase price.
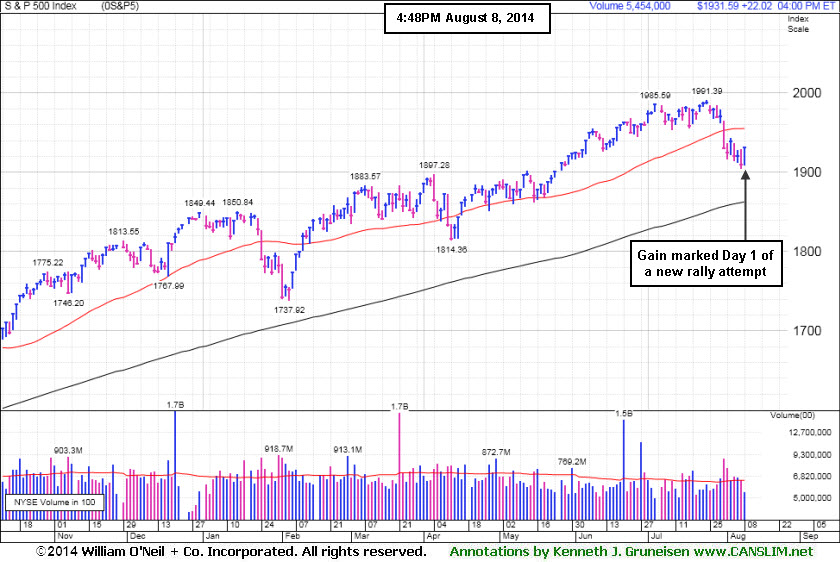
PICTURED: The S&P 500 Index gained 21 points to 1,930. The gain marked Day 1 of a new rally attempt. Confirming gains are needed for the market outlook to turn favorable for any new buying efforts, meanwhile it is an ideal time to keep worthy buy candidates on your watchlist.
Stocks staged a rally on Friday. The Dow Jones Industrial Average finished 185 points higher to 16,553. The NASDAQ rose 36 points to 4,371.
Stocks advanced thanks to a shift in geopolitical sentiment. Reports that Russian officials indicated a willingness to de-escalate tensions with Ukraine helped lift the market. This overshadowed news that the U.S. initiated targeted airstrikes against Iraqi insurgents and Hamas broke its cease-fire with Israel. Earnings were also in focus. CBS (CBS +4.1%) rose after the company reported a new share buyback program, increased its quarterly dividend, and announced a positive profit tally.
At the close all 10 of the sectors in the S&P 500 were higher. Utilities and energy were the best performing groups as Duke Energy (DUK +1.6%) and Exxon Mobil (XOM +1.5%) advanced. Consumer discretionary stocks added to the upside. Disney (DIS +1.6%) was higher, following announced plans to expand their 'Frozen' products.
Treasuries erased earlier gains. The benchmark 10-year note lost 3/32 to yield 2.42%.
|
 Kenneth J. Gruneisen started out as a licensed stockbroker in August 1987, a couple of months prior to the historic stock market crash that took the Dow Jones Industrial Average down -22.6% in a single day. He has published daily fact-based fundamental and technical analysis on high-ranked stocks online for two decades. Through FACTBASEDINVESTING.COM, Kenneth provides educational articles, news, market commentary, and other information regarding proven investment systems that work in good times and bad.
Comments contained in the body of this report are technical opinions only and are not necessarily those of Gruneisen Growth Corp. The material herein has been obtained from sources believed to be reliable and accurate, however, its accuracy and completeness cannot be guaranteed. Our firm, employees, and customers may effect transactions, including transactions contrary to any recommendation herein, or have positions in the securities mentioned herein or options with respect thereto. Any recommendation contained in this report may not be suitable for all investors and it is not to be deemed an offer or solicitation on our part with respect to the purchase or sale of any securities. |
|
 |
Retail, Energy-Related, Tech and Financial Groups Rose
Kenneth J. Gruneisen - Passed the CAN SLIM® Master's Exam
The Retail Index ($RLX +1.85%) was a positive influence on the major averages while it was a standout gainer on Friday. Energy-related shares had a positive bias as the Oil Services Index ($OSX +1.28%) and the Integrated Oil Index ($XOI +1.44%) posted modest gains. The tech sector was strong as the Networking Index ($NWX +0.84%), Biotechnology Index ($BTK +1.06%), and Semiconductor Index ($SOX +1.14%) ended unanimously higher. The Gold & Silver Index ($XAU +0.16%) was a laggard as it finished little changed on the mostly positive session.
Charts courtesy www.stockcharts.com
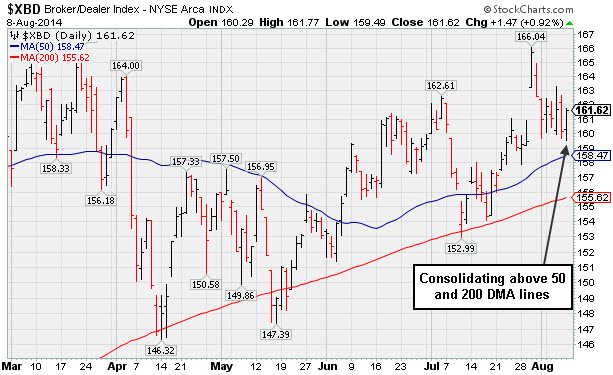
PICTURED 1: The Broker/Dealer Index ($XBD +0.92%) is consolidating above its 50-day and 200-day moving average (DMA) lines.
Charts courtesy www.stockcharts.com
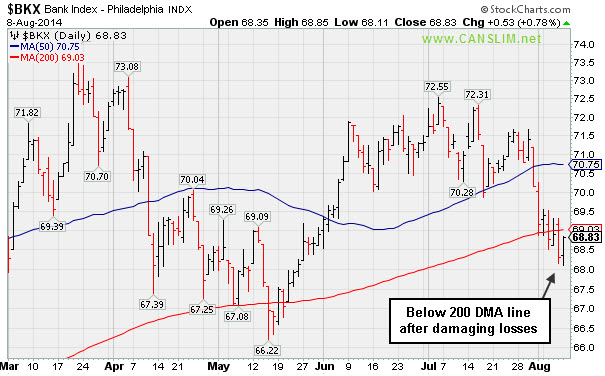
PICTURED 2: The Bank Index ($BKX +0.78%) recently slumped below its 200 DMA line after damaging losses.
| Oil Services |
$OSX |
288.86 |
+3.65 |
+1.28% |
+2.79% |
| Integrated Oil |
$XOI |
1,648.55 |
+23.46 |
+1.44% |
+9.67% |
| Semiconductor |
$SOX |
606.23 |
+6.85 |
+1.14% |
+13.31% |
| Networking |
$NWX |
323.50 |
+2.68 |
+0.84% |
-0.14% |
| Broker/Dealer |
$XBD |
161.62 |
+1.47 |
+0.92% |
+0.66% |
| Retail |
$RLX |
902.84 |
+16.39 |
+1.85% |
-3.93% |
| Gold & Silver |
$XAU |
101.26 |
+0.16 |
+0.16% |
+20.33% |
| Bank |
$BKX |
68.83 |
+0.53 |
+0.78% |
-0.62% |
| Biotech |
$BTK |
2,785.46 |
+29.21 |
+1.06% |
+19.53% |
|
|
|
 |
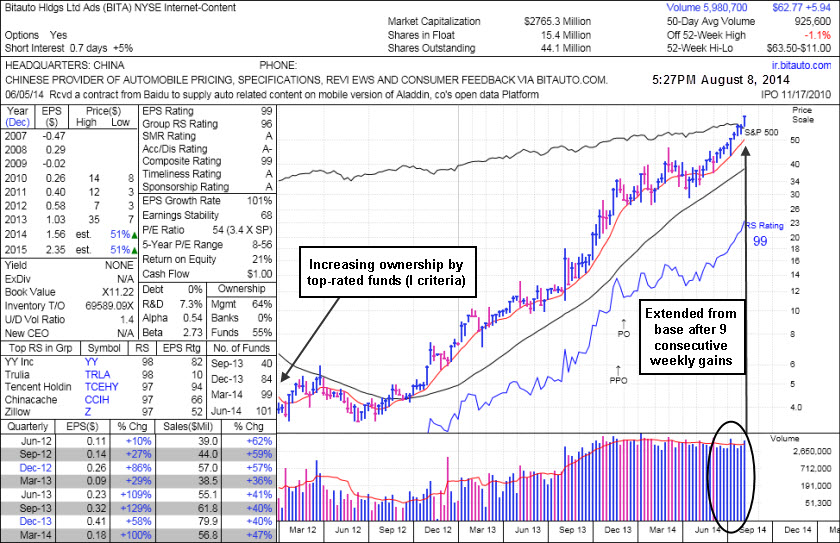
Perched at High After 3 Consecutive Volume-Driven Gains
Kenneth J. Gruneisen - Passed the CAN SLIM® Master's Exam
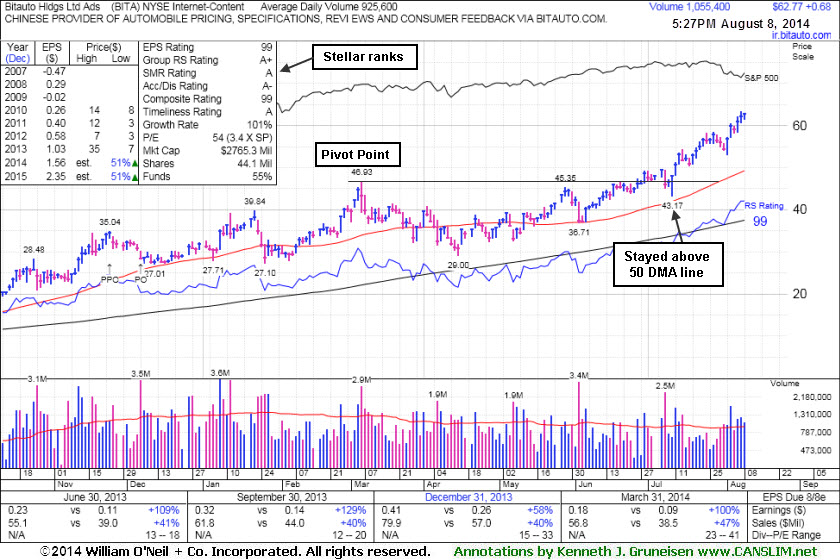
Biotauto Hldgs Ltd Ads (BITA +$0.68 +1.10% to $62.77) is perched at its 52-week high after today's 3rd consecutive gain, getting more extended from its prior base. It is well above its "max buy" level, extended from its prior base, rallying with no overhead supply to act as resistance. Its 50-day moving average (DMA) line ($49.28) defines important near-term support to watch on pullbacks.
BITA was last shown in this FSU section on 7/21/14 with an annotated graphs under the headline,"Strength Returned After Shake-Out and Positive Reversal". It was highlighted in yellow in the 6/26/14 mid-day report (read here) with pivot point cited based on the 3/06/14 high plus 10 cents. A gain above its pivot point on 6/30/14 backed by +50% above average volume triggered a technical buy signal. It managed a "positive reversal" on 7/10/14 after trading down considerably, likely prompting disciplined investors to sell if it fell more than -7% from their purchase price. Any stock which is sold can be bought back later if strength returns, however rule number one is to always limit losses while they are small. Note that it stayed well above its 50-day moving average (DMA) line which defines important support for chart readers.
Fundamentals remain strong with respect to the C and A criteria as it reported earnings +100% on +47% sales revenues for the Mar '14 quarter. It was first highlighted in the 8/07/13 mid-day report in yellow at $12.01 with the prior pivot point based on its 5/08/13 high plus 10 cents (read here). This China-based Internet-Content firm's quarterly and annual earnings (C and A criteria) history has been strong. Its small supply (S criteria) of only 15.4 million shares in the public float can contribute to great volatility in the event of institutional buying or selling. There are 101 top-rated mutual funds as of Jun '14 owning an interest in the company, up from 41 in Sep '13, a reassuring sign concerning the I criteria. Its current Up/Down Volume Ratio is 1.4, an unbiased indication its shares have been under accumulation over the past 50 days.
|
|
|
Color Codes Explained :
Y - Better candidates highlighted by our
staff of experts.
G - Previously featured
in past reports as yellow but may no longer be buyable under the
guidelines.
***Last / Change / Volume data in this table is the closing quote data***
Symbol/Exchange
Company Name
Industry Group |
PRICE |
CHANGE
(%Change) |
Day High |
Volume
(% DAV)
(% 50 day avg vol) |
52 Wk Hi
% From Hi |
Featured
Date |
Price
Featured |
Pivot Featured |
|
Max Buy |
ACT
-
NYSE
Actavis plc
Medical-Generic Drugs
|
$205.79
|
+1.85
0.91% |
$205.94
|
2,149,840
85.21% of 50 DAV
50 DAV is 2,523,000
|
$230.77
-10.82%
|
6/20/2014
|
$216.53
|
PP = $230.87
|
|
MB = $242.41
|
Most Recent Note - 8/6/2014 12:03:39 PM
G - Small gap down today and its color code is changed to green while slumping below its 50 DMA line and enduring distributional pressure. A rebound above the 50 DMA line is needed for its outlook to improve. Reported earnings +70% on +34% sales revenues for the Jun '14 quarter. See the latest FSU analysis for more details and new annotated graphs.
>>> FEATURED STOCK ARTICLE : Enduring Distributional Pressure While Sputtering Near 50-Day Average - 8/5/2014
View all notes |
Set NEW NOTE alert |
CANSLIM.net Company Profile |
SEC
News |
Chart |
Request a new note
C
A N
S L
I M


|
AFSI
-
NASDAQ
Amtrust Financial Svcs
INSURANCE - Property and; Casualty Insurance
|
$43.63
|
+0.97
2.27% |
$44.15
|
483,231
91.21% of 50 DAV
50 DAV is 529,800
|
$47.10
-7.37%
|
5/21/2014
|
$44.85
|
PP = $44.85
|
|
MB = $47.09
|
Most Recent Note - 8/7/2014 11:55:47 AM
G - Reversed into the red after gapping up today following Jun '14 earnings news. Previously noted with caution - "Consolidating just above its 50 DMA line, facing resistance due to overhead supply up through the $47 level."
>>> FEATURED STOCK ARTICLE : 50-Day Moving Average Line Acted as Recent Resistance - 7/23/2014
View all notes |
Set NEW NOTE alert |
CANSLIM.net Company Profile |
SEC
News |
Chart |
Request a new note
C
A N
S L
I M
|
BITA
-
NYSE
Bitauto Hldgs Ltd Ads
Internet-Content
|
$62.77
|
+0.68
1.10% |
$62.91
|
1,056,045
114.17% of 50 DAV
50 DAV is 925,000
|
$63.50
-1.15%
|
6/26/2014
|
$46.20
|
PP = $47.03
|
|
MB = $49.38
|
 Most Recent Note - 8/8/2014 7:40:40 PM
G - Perched at its 52-week high after today's 3rd consecutive gain, getting more extended from its prior base. Its 50 DMA line ($49.27) defines important near-term support to watch on pullbacks. See the latest FSU analysis for more details and new annotated graphs.
>>> FEATURED STOCK ARTICLE : Perched at High After 3 Consecutive Volume-Driven Gains - 8/8/2014
View all notes |
Set NEW NOTE alert |
CANSLIM.net Company Profile |
SEC
News |
Chart |
Request a new note
C
A N
S L
I M
|
EQM
-
NYSE
E Q T Midstream Partners
ENERGY - Oil and Gas Pipelines
|
$84.43
|
+0.81
0.97% |
$85.69
|
152,247
43.50% of 50 DAV
50 DAV is 350,000
|
$102.51
-17.64%
|
12/12/2013
|
$53.17
|
PP = $56.51
|
|
MB = $59.34
|
Most Recent Note - 8/7/2014 5:53:01 PM
G - Gains have lacked volume conviction since violating its 50 DMA line. Reported earnings +37% on +21% sales revenues for the Jun '14 quarter, an improvement after 2 sub par quarterly earnings comparisons. See latest FSU analysis for more details and new annotated graphs.
>>> FEATURED STOCK ARTICLE : Following 50-Day Moving Average Violation Gains Lacked Volume - 8/7/2014
View all notes |
Set NEW NOTE alert |
CANSLIM.net Company Profile |
SEC
News |
Chart |
Request a new note
C
A N
S L
I M
|
FB
-
NASDAQ
Facebook Inc Cl A
INTERNET
|
$73.06
|
-0.11
-0.15% |
$73.43
|
27,153,729
62.90% of 50 DAV
50 DAV is 43,167,000
|
$76.74
-4.80%
|
7/24/2014
|
$76.00
|
PP = $72.69
|
|
MB = $76.32
|
Most Recent Note - 8/8/2014 4:06:39 PM
Y - Volume totals have been cooling while consolidating near its pivot point, stubbornly holding its ground after gapping up on 7/24/14. Prior highs in the $72 area define initial support above its 50 DMA line.
>>> FEATURED STOCK ARTICLE : Breakaway Gap May Signal Beginning of Meaningful Rally - 7/24/2014
View all notes |
Set NEW NOTE alert |
CANSLIM.net Company Profile |
SEC
News |
Chart |
Request a new note
C
A N
S L
I M
|
Symbol/Exchange
Company Name
Industry Group |
PRICE |
CHANGE
(%Change) |
Day High |
Volume
(% DAV)
(% 50 day avg vol) |
52 Wk Hi
% From Hi |
Featured
Date |
Price
Featured |
Pivot Featured |
|
Max Buy |
ICON
-
NASDAQ
Iconix Brand Group Inc
CONSUMER NON-DURABLES - Textile - Apparel Footwear
|
$42.14
|
+0.46
1.10% |
$42.33
|
248,529
54.09% of 50 DAV
50 DAV is 459,500
|
$44.81
-5.96%
|
6/5/2014
|
$43.54
|
PP = $43.44
|
|
MB = $45.61
|
Most Recent Note - 8/6/2014 6:44:43 PM
G - Reported earnings +4% on +3% sales revenues for the Jun '14 quarter, below the +25% minimum earnings guideline (C criteria) raising fundamental concerns. There was a "negative reversal" on 7/29/14 as its 50 DMA line acted as resistance and it Relative Strength rating fell below 80+ minimum guideline.
>>> FEATURED STOCK ARTICLE : Fundamental and Technical Deterioration Hurts Outlook - 7/31/2014
View all notes |
Set NEW NOTE alert |
CANSLIM.net Company Profile |
SEC
News |
Chart |
Request a new note
C
A N
S L
I M
|
PANW
-
NYSE
Palo Alto Networks
Computer Sftwr-Security
|
$80.19
|
+0.23
0.29% |
$80.86
|
672,156
39.38% of 50 DAV
50 DAV is 1,707,000
|
$85.78
-6.52%
|
7/30/2014
|
$84.21
|
PP = $85.88
|
|
MB = $90.17
|
Most Recent Note - 8/6/2014 6:46:52 PM
Y - Subsequent volume-driven gains to new high territory may trigger a new (or add-on) technical buy signal. Its 50 DMA line ($78.98) and recent low ($76.86 on 8/01/14) define important near-term support where subsequent violations would raise serious concerns and trigger technical sell signals.
>>> FEATURED STOCK ARTICLE : Found Support Above 50-Day Average Near Prior Highs - 7/22/2014
View all notes |
Set NEW NOTE alert |
CANSLIM.net Company Profile |
SEC
News |
Chart |
Request a new note
C
A N
S L
I M
|
TARO
-
NYSE
Taro Pharmaceutical Inds
DRUGS - Drug Manufacturers - Other
|
$145.42
|
+6.97
5.03% |
$149.00
|
192,542
267.42% of 50 DAV
50 DAV is 72,000
|
$149.89
-2.98%
|
7/30/2014
|
$144.24
|
PP = $149.99
|
|
MB = $157.49
|
Most Recent Note - 8/8/2014 12:53:00 PM
G - Erased early losses and found support at its 50 DMA line today while still building on an advanced base pattern. Reported earnings -18% on -15% sales revenues for the Jun '14 quarter, below the +25% minimum earnings guideline (C criteria) raising fundamental concerns and its color code is changed to green.
>>> FEATURED STOCK ARTICLE : Still Building on an Advanced Base Pattern - 8/6/2014
View all notes |
Set NEW NOTE alert |
CANSLIM.net Company Profile |
SEC
News |
Chart |
Request a new note
C
A N
S L
I M
|
TRN
-
NYSE
Trinity Industries Inc
TRANSPORTATION - Railroads
|
$42.52
|
+0.96
2.31% |
$42.57
|
2,148,197
69.86% of 50 DAV
50 DAV is 3,075,000
|
$47.83
-11.10%
|
4/30/2014
|
$37.79
|
PP = $38.03
|
|
MB = $39.93
|
Most Recent Note - 8/6/2014 6:42:45 PM
G - Gapped down and violated its 50 DMA line ($43.26) raising concerns and triggering a technical sell signal. Only a prompt rebound above the 50 DMA line would help its outlook improve. Reported earnings +91% on +39% sales for the Jun '14 quarter.
>>> FEATURED STOCK ARTICLE : Earnings News Due Following Tuesday's Close - 7/28/2014
View all notes |
Set NEW NOTE alert |
CANSLIM.net Company Profile |
SEC
News |
Chart |
Request a new note
C
A N
S L
I M
|
UA
-
NYSE
Under Armour Inc Cl A
CONSUMER NON-DURABLES - Textile - Apparel Clothing
|
$68.49
|
+0.75
1.11% |
$68.59
|
1,522,689
55.65% of 50 DAV
50 DAV is 2,736,000
|
$70.94
-3.45%
|
7/10/2014
|
$58.50
|
PP = $60.79
|
|
MB = $63.83
|
Most Recent Note - 8/6/2014 6:48:24 PM
G - Recently reported earnings +0% on +34% sales revenues for the Jun '14 quarter, below the +25% minimum earnings guideline (C criteria), yet the company raised its guidance. Hold its ground stubbornly near all-time highs with no resistance remaining due to overhead supply.
>>> FEATURED STOCK ARTICLE : Bullish Action Despite Latest Earnings Below +25% Minimum Guideline - 7/30/2014
View all notes |
Set NEW NOTE alert |
CANSLIM.net Company Profile |
SEC
News |
Chart |
Request a new note
C
A N
S L
I M
|
Symbol/Exchange
Company Name
Industry Group |
PRICE |
CHANGE
(%Change) |
Day High |
Volume
(% DAV)
(% 50 day avg vol) |
52 Wk Hi
% From Hi |
Featured
Date |
Price
Featured |
Pivot Featured |
|
Max Buy |
WLK
-
NYSE
Westlake Chemical Corp
CHEMICALS - Specialty Chemicals
|
$87.76
|
+0.69
0.79% |
$87.89
|
233,650
40.15% of 50 DAV
50 DAV is 582,000
|
$91.97
-4.58%
|
4/29/2014
|
$72.79
|
PP = $69.31
|
|
MB = $72.78
|
Most Recent Note - 8/8/2014 4:08:52 PM
G - Reported earnings +11% on +6% sales revenues for the Jun '14 quarter, below the +25% minimum earnings guideline (C criteria), raising fundamental concerns. Found support this week at its 50 DMA line ($85.05) where a subsequent violation would raise greater concerns and trigger a technical sell signal.
>>> FEATURED STOCK ARTICLE : Extended From Prior Base After Streak of 8 Consecutive Gains - 7/25/2014
View all notes |
Set NEW NOTE alert |
CANSLIM.net Company Profile |
SEC
News |
Chart |
Request a new note
C
A N
S L
I M
|
|
|
|
THESE ARE NOT BUY RECOMMENDATIONS!
Comments contained in the body of this report are technical
opinions only. The material herein has been obtained
from sources believed to be reliable and accurate, however,
its accuracy and completeness cannot be guaranteed.
This site is not an investment advisor, hence it does
not endorse or recommend any securities or other investments.
Any recommendation contained in this report may not
be suitable for all investors and it is not to be deemed
an offer or solicitation on our part with respect to
the purchase or sale of any securities. All trademarks,
service marks and trade names appearing in this report
are the property of their respective owners, and are
likewise used for identification purposes only.
This report is a service available
only to active Paid Premium Members.
You may opt-out of receiving report notifications
at any time. Questions or comments may be submitted
by writing to Premium Membership Services 665 S.E. 10 Street, Suite 201 Deerfield Beach, FL 33441-5634 or by calling 1-800-965-8307
or 954-785-1121.
|
|
|

