You are not logged in.
This means you
CAN ONLY VIEW reports that were published prior to Thursday, April 10, 2025.
You
MUST UPGRADE YOUR MEMBERSHIP if you want to see any current reports.
AFTER MARKET UPDATE - MONDAY, AUGUST 11TH, 2014
Previous After Market Report Next After Market Report >>>
|
|
|
|
DOW |
+16.05 |
16,569.98 |
+0.10% |
|
Volume |
583,103,660 |
-5% |
|
Volume |
1,429,067,470 |
-13% |
|
NASDAQ |
+30.43 |
4,401.33 |
+0.70% |
|
Advancers |
2,253 |
71% |
|
Advancers |
2,025 |
71% |
|
S&P 500 |
+5.33 |
1,936.92 |
+0.28% |
|
Decliners |
805 |
25% |
|
Decliners |
736 |
26% |
|
Russell 2000 |
+10.58 |
1,141.93 |
+0.94% |
|
52 Wk Highs |
85 |
|
|
52 Wk Highs |
65 |
|
|
S&P 600 |
+5.61 |
657.75 |
+0.86% |
|
52 Wk Lows |
21 |
|
|
52 Wk Lows |
39 |
|
|
 |
Major Averages Rose Again With Lighter Volume Totals
Kenneth J. Gruneisen - Passed the CAN SLIM® Master's Exam
Stocks rose on Monday's session. The Dow was up 16 points to 16,569. The S&P 500 added 5 points to close at 1,936. The NASDAQ climbed 30 points to 4,401. Volume totals were lower on both major exchanges, however, revealing a lack of institutional buying demand. Breadth was positive as advancers led decliners by nearly a 3-1 margin on the NYSE and on the Nasdaq exchange. There were 26 high-ranked companies from the CANSLIM.net Leaders List that made new 52-week highs and appeared on the CANSLIM.net BreakOuts Page, doubling the prior session total of 13 stocks. New 52-week highs made a meaningful improvement and outnumbered new 52-week lows on the NYSE and on the Nasdaq exchange. There were gains for 10 of the 11 of the high-ranked companies currently included on the Featured Stocks Page. The market (M criteria) deterioration recently earned the label of a "correction" as the technical damage became significant to chart readers and leadership (stocks hitting new 52-week highs) waned. Disciplined investors limit losses and reduce market exposure during rough market periods by selling any stocks which fall more than -7% from their purchase price.
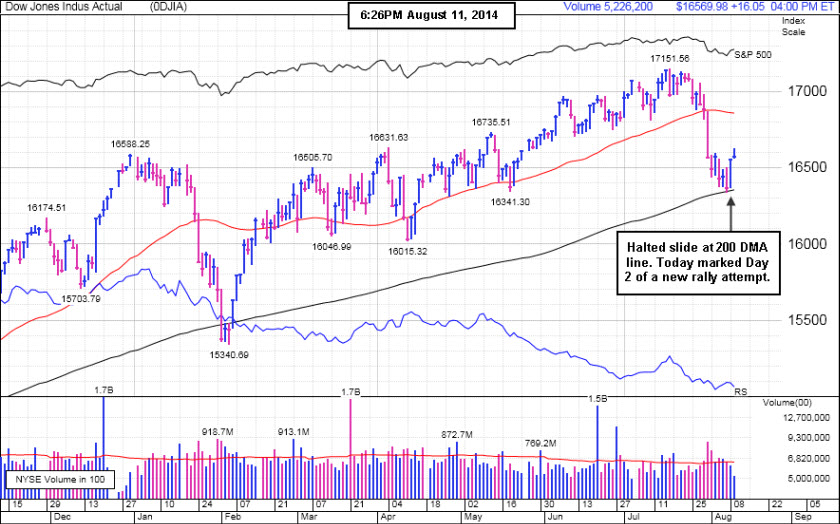
PICTURED 1: The Dow Jones Industrial Average halted its slide at its 200-day moving average (DMA) line. Monday's gain marked Day 2 of a new rally attempt. Confirming gains are needed for the market outlook to turn favorable for any new buying efforts, meanwhile it is an ideal time to keep worthy buy candidates on your watchlist.
The major averages finished higher attributed to easing geopolitical concerns. U.S. equities advanced after Russian President Putin said the country is coordinating with the Red Cross to provide humanitarian aid to Ukraine. Investors also appeared cautiously optimistic that airstrikes against Islamist militants in Iraq and negotiations between Israel and Palestine will stem conflicts in the Middle East.
It was quiet on the data front with no scheduled economic releases today. Among earnings, Sysco (SYY +3.2%) after posting in-line quarterly results. Priceline (PCLN +2.2%) rose as bookings in the most recent period topped projections. Dean Foods (DF-3.9%) as the milk producer's profits missed estimates. In other news, Kinder Morgan (KMI +9%) rose after announcing it would consolidate its energy businesses in a deal valued at $70 billion.
Consumer staples were the best performing sector in the S&P 500 as Pepsi (PEP +1.7%) paced the group's advance. Utilities were down the most on the session as Southern Company (SO -1.1%) fell.
Treasuries were little changed. The benchmark 10-year note was flat to yield 2.42%.
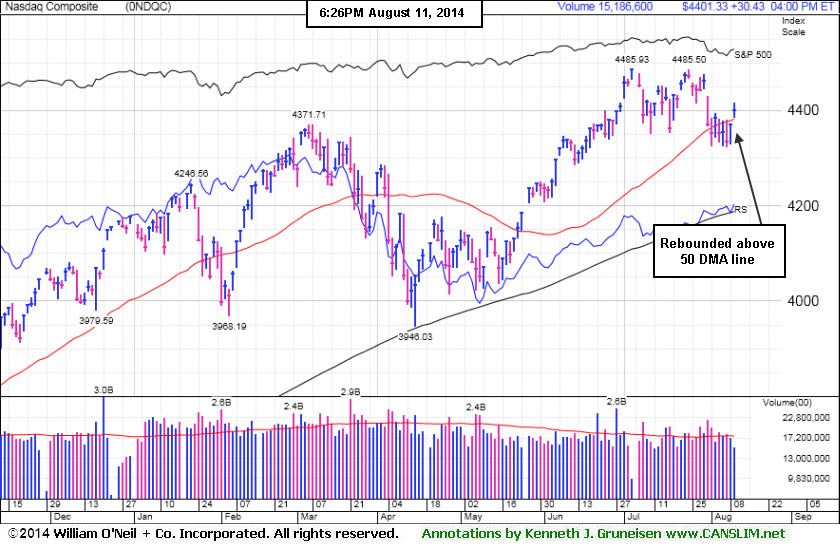
PICTURED 2: The Nasdaq Composite Index's gain helped it rebound above its 50-day moving average (DMA) line, helping the tech-heavy index's technical stance improve.
|
 Kenneth J. Gruneisen started out as a licensed stockbroker in August 1987, a couple of months prior to the historic stock market crash that took the Dow Jones Industrial Average down -22.6% in a single day. He has published daily fact-based fundamental and technical analysis on high-ranked stocks online for two decades. Through FACTBASEDINVESTING.COM, Kenneth provides educational articles, news, market commentary, and other information regarding proven investment systems that work in good times and bad.
Comments contained in the body of this report are technical opinions only and are not necessarily those of Gruneisen Growth Corp. The material herein has been obtained from sources believed to be reliable and accurate, however, its accuracy and completeness cannot be guaranteed. Our firm, employees, and customers may effect transactions, including transactions contrary to any recommendation herein, or have positions in the securities mentioned herein or options with respect thereto. Any recommendation contained in this report may not be suitable for all investors and it is not to be deemed an offer or solicitation on our part with respect to the purchase or sale of any securities. |
|
 |
Tech, Retail, and Broker/Dealer Indexes Rose
Kenneth J. Gruneisen - Passed the CAN SLIM® Master's Exam
The Broker/Dealer Index ($XBD +0.95%) roe on Monday while the Bank Index ($BKX -0.25%) edged lower. The Retail Index ($RLX +0.35%) had a slightly positive bias which added to the major averages' gains. energy-related shares edged lower as the Integrated Oil Index ($XOI -0.24%) and Oil Services Index ($OSX -0.08%) ended slightly lower. The tech sector had a positive bias as the Networking Index ($NWX +0.64%), Biotechnology Index ($BTK +0.88%), and the Semiconductor Index ($SOX +0.96%) tallied unanimous gains. The Gold & Silver Index ($XAU +1.14%) also rose.
Charts courtesy www.stockcharts.com
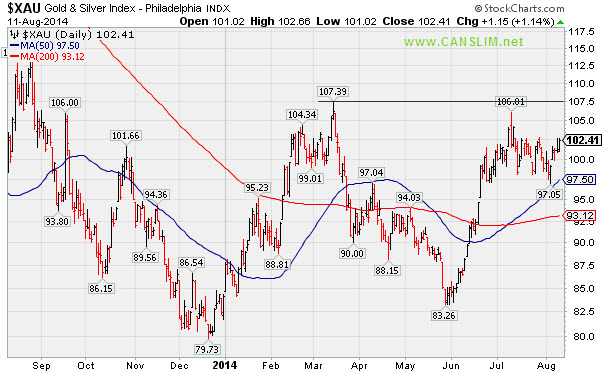
PICTURED: The Gold & Silver Index ($XAU +1.14%) is consolidating above its 50-day and 200-day moving average (DMA) lines, perched within striking distance of its 2014 highs.
| Oil Services |
$OSX |
288.64 |
-0.22 |
-0.08% |
+2.71% |
| Integrated Oil |
$XOI |
1,644.61 |
-3.94 |
-0.24% |
+9.41% |
| Semiconductor |
$SOX |
612.02 |
+5.79 |
+0.96% |
+14.39% |
| Networking |
$NWX |
325.57 |
+2.07 |
+0.64% |
+0.50% |
| Broker/Dealer |
$XBD |
163.16 |
+1.54 |
+0.95% |
+1.62% |
| Retail |
$RLX |
905.98 |
+3.14 |
+0.35% |
-3.60% |
| Gold & Silver |
$XAU |
102.41 |
+1.15 |
+1.14% |
+21.70% |
| Bank |
$BKX |
68.66 |
-0.17 |
-0.25% |
-0.87% |
| Biotech |
$BTK |
2,810.05 |
+24.59 |
+0.88% |
+20.58% |
|
|
|
 |
Building on New Base Pattern Above 50-Day Average
Kenneth J. Gruneisen - Passed the CAN SLIM® Master's Exam
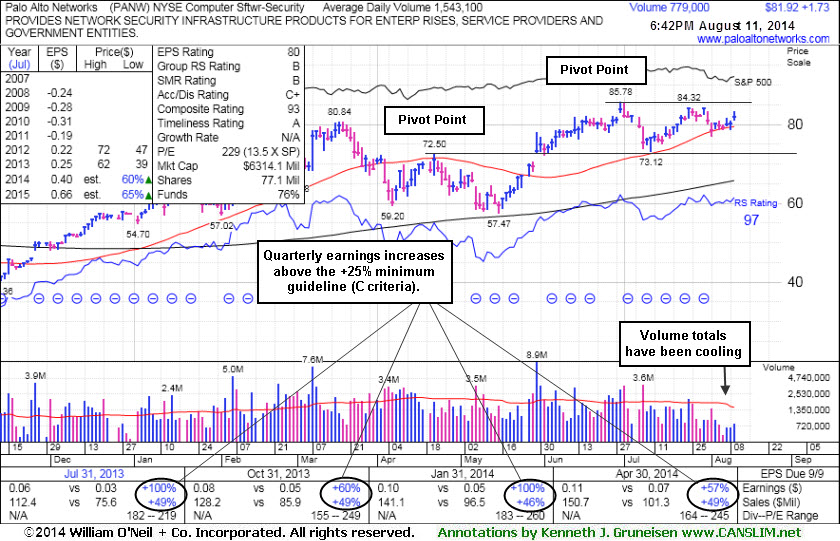
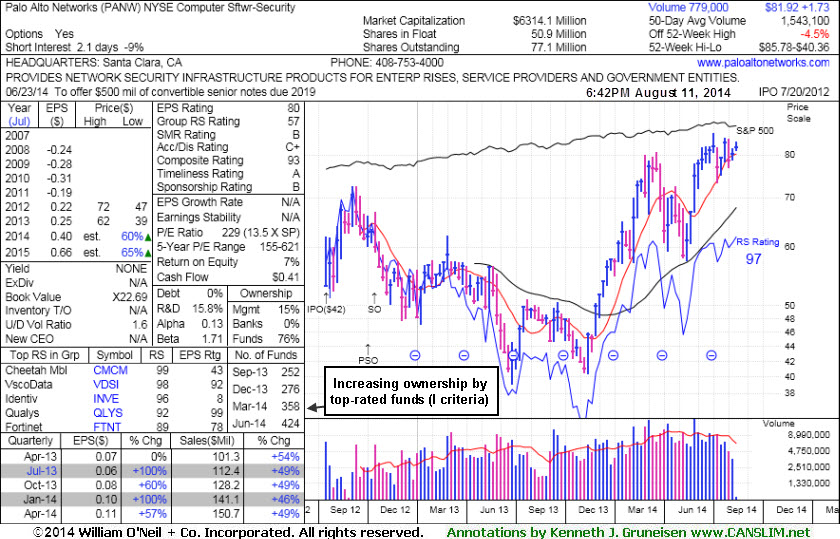
Palo Alto Networks (PANW +$1.73 or +2.16% to $81.92) is perched within close striking distance of its 52-week high. Subsequent volume-driven gains to new high (N criteria) territory may trigger a new (or add-on) technical buy signal. Its 50 DMA line ($78.98) and recent low ($76.86 on 8/01/14) define important near-term support where subsequent violations would raise serious concerns and trigger technical sell signals.
The high-ranked leader hailing from the Computer Software - Security industry group has been building a base-on-base pattern since last shown in this FSU section with annotated graphs on 7/22/14 under the headline, "Found Support Above 50-Day Average Near Prior Highs". The Group Relative Strength rating is currently a mediocre 57, however leadership from other stocks in the group is reassuring concerning the L criteria). PANW was first highlighted in yellow at $75.95 with pivot point cited based on its 4/22/14 high in the 5/29/14 mid-day report (read here). Strong sales revenues increases and earnings through the Apr '14 quarter above the +25% minimum guideline satisfy the C criteria. Its annual earnings (A criteria) history is a bit limited, but growth has been strong since its July 2012 IPO at $42. The number of top-rated funds owning its shares rose from 246 in Jun '13 to 424 in Jun '14, a reassuring sign concerning the I criteria. Its small supply (S criteria) of only 50.9 million shares in the public float is another favorable characteristic.
|
|
|
Color Codes Explained :
Y - Better candidates highlighted by our
staff of experts.
G - Previously featured
in past reports as yellow but may no longer be buyable under the
guidelines.
***Last / Change / Volume data in this table is the closing quote data***
Symbol/Exchange
Company Name
Industry Group |
PRICE |
CHANGE
(%Change) |
Day High |
Volume
(% DAV)
(% 50 day avg vol) |
52 Wk Hi
% From Hi |
Featured
Date |
Price
Featured |
Pivot Featured |
|
Max Buy |
ACT
-
NYSE
Actavis plc
Medical-Generic Drugs
|
$202.72
|
-3.07
-1.49% |
$206.56
|
2,413,181
95.01% of 50 DAV
50 DAV is 2,540,000
|
$230.77
-12.15%
|
6/20/2014
|
$216.53
|
PP = $230.87
|
|
MB = $242.41
|
Most Recent Note - 8/6/2014 12:03:39 PM
G - Small gap down today and its color code is changed to green while slumping below its 50 DMA line and enduring distributional pressure. A rebound above the 50 DMA line is needed for its outlook to improve. Reported earnings +70% on +34% sales revenues for the Jun '14 quarter. See the latest FSU analysis for more details and new annotated graphs.
>>> FEATURED STOCK ARTICLE : Enduring Distributional Pressure While Sputtering Near 50-Day Average - 8/5/2014
View all notes |
Set NEW NOTE alert |
CANSLIM.net Company Profile |
SEC
News |
Chart |
Request a new note
C
A N
S L
I M


|
AFSI
-
NASDAQ
Amtrust Financial Svcs
INSURANCE - Property and; Casualty Insurance
|
$44.14
|
+0.51
1.17% |
$44.61
|
368,887
69.96% of 50 DAV
50 DAV is 527,300
|
$47.10
-6.28%
|
5/21/2014
|
$44.85
|
PP = $44.85
|
|
MB = $47.09
|
Most Recent Note - 8/7/2014 11:55:47 AM
G - Reversed into the red after gapping up today following Jun '14 earnings news. Previously noted with caution - "Consolidating just above its 50 DMA line, facing resistance due to overhead supply up through the $47 level."
>>> FEATURED STOCK ARTICLE : 50-Day Moving Average Line Acted as Recent Resistance - 7/23/2014
View all notes |
Set NEW NOTE alert |
CANSLIM.net Company Profile |
SEC
News |
Chart |
Request a new note
C
A N
S L
I M
|
BITA
-
NYSE
Bitauto Hldgs Ltd Ads
Internet-Content
|
$68.99
|
+6.22
9.91% |
$69.04
|
2,229,976
239.52% of 50 DAV
50 DAV is 931,000
|
$63.50
8.65%
|
6/26/2014
|
$46.20
|
PP = $47.03
|
|
MB = $49.38
|
 Most Recent Note - 8/11/2014 1:22:33 PM
G - Powering to another new 52-week high with today's 4th consecutive gain, getting more extended from its prior base. Its 50 DMA line ($49.79) defines important near-term support to watch on pullbacks. See the latest FSU analysis for more details and annotated graphs.
>>> FEATURED STOCK ARTICLE : Perched at High After 3 Consecutive Volume-Driven Gains - 8/8/2014
View all notes |
Set NEW NOTE alert |
CANSLIM.net Company Profile |
SEC
News |
Chart |
Request a new note
C
A N
S L
I M
|
EQM
-
NYSE
E Q T Midstream Partners
ENERGY - Oil and Gas Pipelines
|
$88.43
|
+4.00
4.74% |
$89.10
|
280,165
80.05% of 50 DAV
50 DAV is 350,000
|
$102.51
-13.74%
|
12/12/2013
|
$53.17
|
PP = $56.51
|
|
MB = $59.34
|
Most Recent Note - 8/11/2014 6:22:06 PM
G - Rebounded toward its 50 DMA line with today's solid gain. That short-term average may now act as a resistance level. Reported earnings +37% on +21% sales revenues for the Jun '14 quarter, an improvement after 2 sub par quarterly earnings comparisons.
>>> FEATURED STOCK ARTICLE : Following 50-Day Moving Average Violation Gains Lacked Volume - 8/7/2014
View all notes |
Set NEW NOTE alert |
CANSLIM.net Company Profile |
SEC
News |
Chart |
Request a new note
C
A N
S L
I M
|
FB
-
NASDAQ
Facebook Inc Cl A
INTERNET
|
$73.44
|
+0.38
0.52% |
$73.91
|
24,543,205
57.27% of 50 DAV
50 DAV is 42,857,000
|
$76.74
-4.30%
|
7/24/2014
|
$76.00
|
PP = $72.69
|
|
MB = $76.32
|
Most Recent Note - 8/8/2014 4:06:39 PM
Y - Volume totals have been cooling while consolidating near its pivot point, stubbornly holding its ground after gapping up on 7/24/14. Prior highs in the $72 area define initial support above its 50 DMA line.
>>> FEATURED STOCK ARTICLE : Breakaway Gap May Signal Beginning of Meaningful Rally - 7/24/2014
View all notes |
Set NEW NOTE alert |
CANSLIM.net Company Profile |
SEC
News |
Chart |
Request a new note
C
A N
S L
I M
|
Symbol/Exchange
Company Name
Industry Group |
PRICE |
CHANGE
(%Change) |
Day High |
Volume
(% DAV)
(% 50 day avg vol) |
52 Wk Hi
% From Hi |
Featured
Date |
Price
Featured |
Pivot Featured |
|
Max Buy |
ICON
-
NASDAQ
Iconix Brand Group Inc
CONSUMER NON-DURABLES - Textile - Apparel Footwear
|
$42.70
|
+0.56
1.33% |
$43.14
|
417,296
90.91% of 50 DAV
50 DAV is 459,000
|
$44.81
-4.71%
|
6/5/2014
|
$43.54
|
PP = $43.44
|
|
MB = $45.61
|
Most Recent Note - 8/6/2014 6:44:43 PM
G - Reported earnings +4% on +3% sales revenues for the Jun '14 quarter, below the +25% minimum earnings guideline (C criteria) raising fundamental concerns. There was a "negative reversal" on 7/29/14 as its 50 DMA line acted as resistance and it Relative Strength rating fell below 80+ minimum guideline.
>>> FEATURED STOCK ARTICLE : Fundamental and Technical Deterioration Hurts Outlook - 7/31/2014
View all notes |
Set NEW NOTE alert |
CANSLIM.net Company Profile |
SEC
News |
Chart |
Request a new note
C
A N
S L
I M
|
PANW
-
NYSE
Palo Alto Networks
Computer Sftwr-Security
|
$81.92
|
+1.73
2.16% |
$83.28
|
779,040
50.49% of 50 DAV
50 DAV is 1,543,000
|
$85.78
-4.50%
|
7/30/2014
|
$84.21
|
PP = $85.88
|
|
MB = $90.17
|
Most Recent Note - 8/11/2014 6:41:52 PM
Y - Subsequent volume-driven gains to new high territory may trigger a new (or add-on) technical buy signal. Found support at its 50 DMA line ($79.47). That important short-term average and its recent low ($76.86 on 8/01/14) define important near-term support.
>>> FEATURED STOCK ARTICLE : Building on New Base Pattern Above 50-Day Average - 8/11/2014
View all notes |
Set NEW NOTE alert |
CANSLIM.net Company Profile |
SEC
News |
Chart |
Request a new note
C
A N
S L
I M
|
TARO
-
NYSE
Taro Pharmaceutical Inds
DRUGS - Drug Manufacturers - Other
|
$146.54
|
+1.12
0.77% |
$148.46
|
53,171
71.85% of 50 DAV
50 DAV is 74,000
|
$149.89
-2.23%
|
7/30/2014
|
$144.24
|
PP = $149.99
|
|
MB = $157.49
|
Most Recent Note - 8/8/2014 12:53:00 PM
G - Erased early losses and found support at its 50 DMA line today while still building on an advanced base pattern. Reported earnings -18% on -15% sales revenues for the Jun '14 quarter, below the +25% minimum earnings guideline (C criteria) raising fundamental concerns and its color code is changed to green.
>>> FEATURED STOCK ARTICLE : Still Building on an Advanced Base Pattern - 8/6/2014
View all notes |
Set NEW NOTE alert |
CANSLIM.net Company Profile |
SEC
News |
Chart |
Request a new note
C
A N
S L
I M
|
TRN
-
NYSE
Trinity Industries Inc
TRANSPORTATION - Railroads
|
$43.34
|
+0.82
1.93% |
$43.78
|
1,957,882
64.15% of 50 DAV
50 DAV is 3,052,000
|
$47.83
-9.39%
|
4/30/2014
|
$37.79
|
PP = $38.03
|
|
MB = $39.93
|
Most Recent Note - 8/6/2014 6:42:45 PM
G - Gapped down and violated its 50 DMA line ($43.26) raising concerns and triggering a technical sell signal. Only a prompt rebound above the 50 DMA line would help its outlook improve. Reported earnings +91% on +39% sales for the Jun '14 quarter.
>>> FEATURED STOCK ARTICLE : Earnings News Due Following Tuesday's Close - 7/28/2014
View all notes |
Set NEW NOTE alert |
CANSLIM.net Company Profile |
SEC
News |
Chart |
Request a new note
C
A N
S L
I M
|
UA
-
NYSE
Under Armour Inc Cl A
CONSUMER NON-DURABLES - Textile - Apparel Clothing
|
$68.90
|
+0.41
0.60% |
$69.40
|
1,623,517
60.20% of 50 DAV
50 DAV is 2,697,000
|
$70.94
-2.88%
|
7/10/2014
|
$58.50
|
PP = $60.79
|
|
MB = $63.83
|
Most Recent Note - 8/6/2014 6:48:24 PM
G - Recently reported earnings +0% on +34% sales revenues for the Jun '14 quarter, below the +25% minimum earnings guideline (C criteria), yet the company raised its guidance. Hold its ground stubbornly near all-time highs with no resistance remaining due to overhead supply.
>>> FEATURED STOCK ARTICLE : Bullish Action Despite Latest Earnings Below +25% Minimum Guideline - 7/30/2014
View all notes |
Set NEW NOTE alert |
CANSLIM.net Company Profile |
SEC
News |
Chart |
Request a new note
C
A N
S L
I M
|
Symbol/Exchange
Company Name
Industry Group |
PRICE |
CHANGE
(%Change) |
Day High |
Volume
(% DAV)
(% 50 day avg vol) |
52 Wk Hi
% From Hi |
Featured
Date |
Price
Featured |
Pivot Featured |
|
Max Buy |
WLK
-
NYSE
Westlake Chemical Corp
CHEMICALS - Specialty Chemicals
|
$87.78
|
+0.02
0.02% |
$89.20
|
572,163
100.38% of 50 DAV
50 DAV is 570,000
|
$91.97
-4.56%
|
4/29/2014
|
$72.79
|
PP = $69.31
|
|
MB = $72.78
|
Most Recent Note - 8/8/2014 4:08:52 PM
G - Reported earnings +11% on +6% sales revenues for the Jun '14 quarter, below the +25% minimum earnings guideline (C criteria), raising fundamental concerns. Found support this week at its 50 DMA line ($85.05) where a subsequent violation would raise greater concerns and trigger a technical sell signal.
>>> FEATURED STOCK ARTICLE : Extended From Prior Base After Streak of 8 Consecutive Gains - 7/25/2014
View all notes |
Set NEW NOTE alert |
CANSLIM.net Company Profile |
SEC
News |
Chart |
Request a new note
C
A N
S L
I M
|
|
|
|
THESE ARE NOT BUY RECOMMENDATIONS!
Comments contained in the body of this report are technical
opinions only. The material herein has been obtained
from sources believed to be reliable and accurate, however,
its accuracy and completeness cannot be guaranteed.
This site is not an investment advisor, hence it does
not endorse or recommend any securities or other investments.
Any recommendation contained in this report may not
be suitable for all investors and it is not to be deemed
an offer or solicitation on our part with respect to
the purchase or sale of any securities. All trademarks,
service marks and trade names appearing in this report
are the property of their respective owners, and are
likewise used for identification purposes only.
This report is a service available
only to active Paid Premium Members.
You may opt-out of receiving report notifications
at any time. Questions or comments may be submitted
by writing to Premium Membership Services 665 S.E. 10 Street, Suite 201 Deerfield Beach, FL 33441-5634 or by calling 1-800-965-8307
or 954-785-1121.
|
|
|