You are not logged in.
This means you
CAN ONLY VIEW reports that were published prior to Monday, April 14, 2025.
You
MUST UPGRADE YOUR MEMBERSHIP if you want to see any current reports.
AFTER MARKET UPDATE - FRIDAY, JULY 25TH, 2014
Previous After Market Report Next After Market Report >>>
|
|
|
|
DOW |
-123.23 |
16,960.57 |
-0.72% |
|
Volume |
557,687,630 |
-10% |
|
Volume |
1,581,173,710 |
-10% |
|
NASDAQ |
-22.55 |
4,449.56 |
-0.50% |
|
Advancers |
1,018 |
32% |
|
Advancers |
879 |
30% |
|
S&P 500 |
-9.64 |
1,978.34 |
-0.48% |
|
Decliners |
2,019 |
64% |
|
Decliners |
1,897 |
66% |
|
Russell 2000 |
-11.54 |
1,144.72 |
-1.00% |
|
52 Wk Highs |
93 |
|
|
52 Wk Highs |
56 |
|
|
S&P 600 |
-6.58 |
659.58 |
-0.99% |
|
52 Wk Lows |
46 |
|
|
52 Wk Lows |
58 |
|
|
 |
Indices Fell With Lighter Volume Ending a Negative Week
Kenneth J. Gruneisen - Passed the CAN SLIM® Master's Exam
For the week, the Dow fell -0.8%. The S&P 500 finished virtually unchanged on the week while the NASDAQ rose +0.4%. Behind Friday's losses the volume totals were lighter than the prior session volume totals on the NYSE and on the Nasdaq exchange, a slightly reassuring sign that the institutional crowd did not increase their selling efforts. Breadth was negative as decliners led advancers by a 2-1 margin on the NYSE and on the Nasdaq exchange. Leadership contracted as there were 26 high-ranked companies from the CANSLIM.net Leaders List that made new 52-week highs and appeared on the CANSLIM.net BreakOuts Page, down from the prior session total of 57 stocks. New 52-week highs outnumbered new 52-week lows on the NYSE, but new lows had a slight lead over new highs on the Nasdaq exchange. There were gains for 5 of the 14 of the high-ranked companies currently included on the Featured Stocks Page. The market (M criteria) uptrend recently faced pressure, however a healthy level of leadership has been reassuring. Disciplined investors limit losses and reduce market exposure during rough market periods by selling any stocks which fall more than -7% from their purchase price.
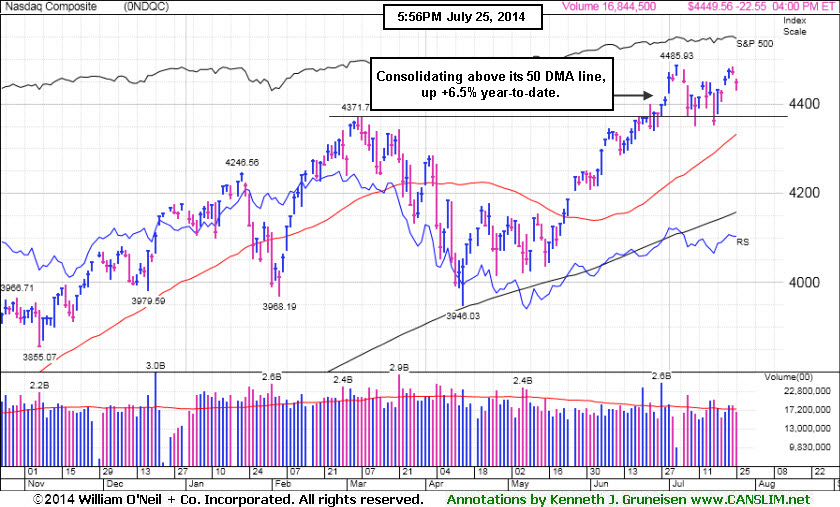
PICTURED: The Nasdaq Composite Index was down 22 points to 4,449. The tech heavy index is consolidating above prior highs, perched up +6.5% year-to-date.
The Dow lost 123 points to 16,960. The S&P 500 fell from a fresh record high as it declined 9 points to 1,978. Some disappointing earnings results weighed on the major averages, overshadowing a report that showed durable goods orders increased for the fourth time five months. Consumer discretionary led the market lower as Amazon.com (AMZN -10%) dropped after reporting its widest quarterly loss since 2012. Starbucks (SBUX -2.3%) was also under pressure, falling amid disappoint surrounding the company's forward looking profit margins. Utilities and energy also weighed on the market as Exelon (EXC -1.2%) fell and Exxon Mobil (XOM -1.1%) also fell ahead of the company's profit tally next week.
The more defensive telecommunications sector advanced, led by Verizon's (VZ +0.6%) gain. Materials also finished higher. LyondellBasell Industries jumped (LYB +4.95%) after posting record quarterly sales and earnings.
Treasuries staged a rally amid continued concerns over escalating violence in Gaza and before next week's all-important FOMC meeting. The 10-year note gained 10/32 to yield 2.46%. The 30-year bond rose by a full point to yield 3.24%.
|
 Kenneth J. Gruneisen started out as a licensed stockbroker in August 1987, a couple of months prior to the historic stock market crash that took the Dow Jones Industrial Average down -22.6% in a single day. He has published daily fact-based fundamental and technical analysis on high-ranked stocks online for two decades. Through FACTBASEDINVESTING.COM, Kenneth provides educational articles, news, market commentary, and other information regarding proven investment systems that work in good times and bad.
Comments contained in the body of this report are technical opinions only and are not necessarily those of Gruneisen Growth Corp. The material herein has been obtained from sources believed to be reliable and accurate, however, its accuracy and completeness cannot be guaranteed. Our firm, employees, and customers may effect transactions, including transactions contrary to any recommendation herein, or have positions in the securities mentioned herein or options with respect thereto. Any recommendation contained in this report may not be suitable for all investors and it is not to be deemed an offer or solicitation on our part with respect to the purchase or sale of any securities. |
|
 |
Retail and Tech Indices Fell; Gold & Silver Index Rose
Kenneth J. Gruneisen - Passed the CAN SLIM® Master's Exam
The Retail Index ($RLX -2.36%) slumped and was a negative influence in the major averages on Friday while the Broker/Dealer Index ($XBD -0.76%) suffered a smaller loss and the Bank Index ($BKX +0.17%) eked out a small gain. The Semiconductor Index ($SOX -1.98%) led the tech sector lower while the Biotechnology Index ($BTK -0.65%) and the Networking Index ($NWX -0.65%) both ended with modest losses. Weakness in energy-related shares led the Integrated Oil Index ($XOI -0.70%) and the Oil Services Index ($OSX -0.40%) slightly lower. The Gold & Silver Index ($XAU +3.07%) was a standout gainer.
Charts courtesy www.stockcharts.com
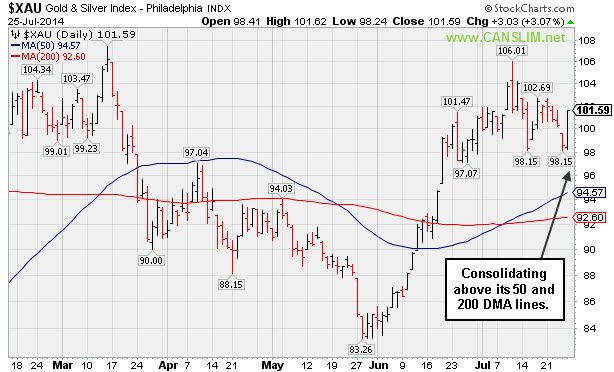
PICTURED: The Gold & Silver Index ($XAU +3.07%) was a standout gainer, consolidating above its 50-day and 200-day moving average (DMA) lines.
| Oil Services |
$OSX |
300.80 |
-1.22 |
-0.40% |
+7.03% |
| Integrated Oil |
$XOI |
1,686.25 |
-11.92 |
-0.70% |
+12.18% |
| Semiconductor |
$SOX |
616.65 |
-12.48 |
-1.98% |
+15.26% |
| Networking |
$NWX |
333.46 |
-2.18 |
-0.65% |
+2.94% |
| Broker/Dealer |
$XBD |
159.01 |
-1.22 |
-0.76% |
-0.96% |
| Retail |
$RLX |
887.12 |
-21.46 |
-2.36% |
-5.61% |
| Gold & Silver |
$XAU |
101.59 |
+3.03 |
+3.07% |
+20.72% |
| Bank |
$BKX |
71.60 |
+0.12 |
+0.17% |
+3.38% |
| Biotech |
$BTK |
2,747.18 |
-17.94 |
-0.65% |
+17.88% |
|
|
|
 |
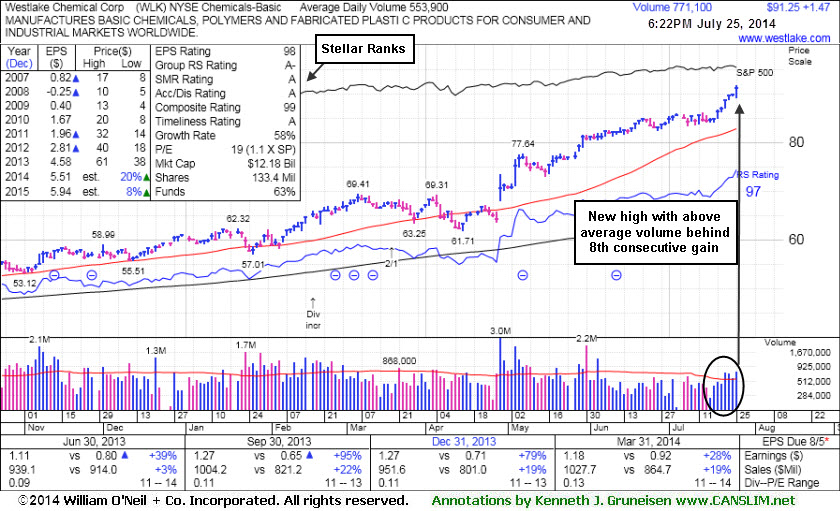
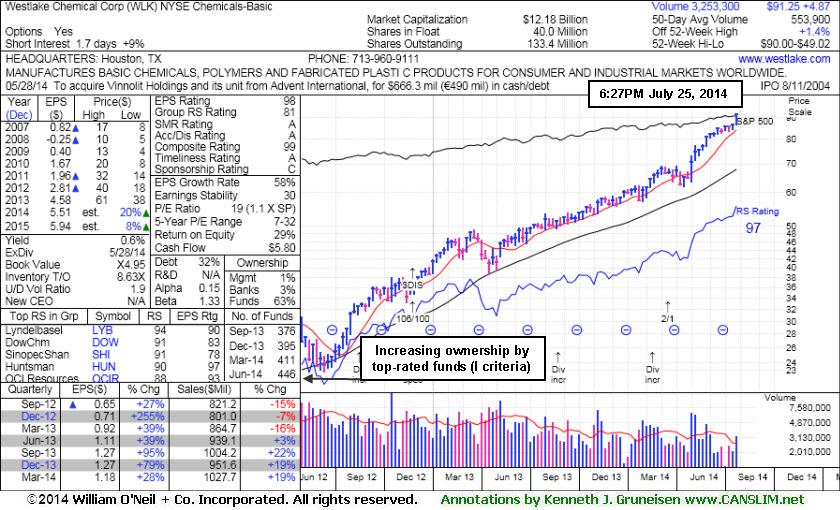
Extended From Prior Base After Streak of 8 Consecutive Gains
Kenneth J. Gruneisen - Passed the CAN SLIM® Master's Exam
Westlake Chemical Corp (WLK +$1.47 or +1.64% to $91.25) hit another new 52-week high with above average volume behind today's 8th consecutive gain, getting more extended from any sound base pattern. Its 50-day moving average (DMA) line ($82.79) defines important near-term support to watch on pullbacks. It is up +25.4% from when it was first featured in yellow at $72.79 rallying from a "double bottom" base in the 4/29/14 mid-day report (read here).
It was last shown in this FSU section on 7/07/14 under the headline, "Great Ranks and Reassuring Leadership in Chemical Group". The Chemicals - Basic industry group has a Group Relative Strength rating of 81 and strong action and leadership from others in the group is a reassuring sign concerning the L criteria. It reported +28% earnings on +19% sales for the Mar '14 quarter, and it has earned great ranks as its quarterly earnings increases have been above the +25% minimum (C criteria). Its annual earnings growth rate (A criteria) has also been strong after a downturn in FY '08 and '09. The number of top-rated funds owning its shares rose from 381 in Sep '13 to 446 in Jun '14, a reassuring trend concerning the I criteria. The small supply of only 40 million shares (S criteria) in the public float is ideal, while it can contribute to greater price volatility in the event of new institutional buying or selling.
|
|
|
Color Codes Explained :
Y - Better candidates highlighted by our
staff of experts.
G - Previously featured
in past reports as yellow but may no longer be buyable under the
guidelines.
***Last / Change / Volume data in this table is the closing quote data***
Symbol/Exchange
Company Name
Industry Group |
PRICE |
CHANGE
(%Change) |
Day High |
Volume
(% DAV)
(% 50 day avg vol) |
52 Wk Hi
% From Hi |
Featured
Date |
Price
Featured |
Pivot Featured |
|
Max Buy |
ACT
-
NYSE
Actavis plc
Medical-Generic Drugs
|
$217.45
|
-1.23
-0.56% |
$219.59
|
1,361,871
63.79% of 50 DAV
50 DAV is 2,135,000
|
$230.77
-5.77%
|
6/20/2014
|
$216.53
|
PP = $230.87
|
|
MB = $242.41
|
Most Recent Note - 7/22/2014 7:17:36 PM
Y - Found support while consolidating above its 50 DMA line ($214.40), still hovering within close striking distance of its 52-week high. Subsequent volume-driven gains to new highs may trigger a technical buy signal.
>>> FEATURED STOCK ARTICLE : Disciplined Investors Still Awaiting Technical Breakout - 7/16/2014
View all notes |
Set NEW NOTE alert |
CANSLIM.net Company Profile |
SEC
News |
Chart |
Request a new note
C
A N
S L
I M


|
AFSI
-
NASDAQ
Amtrust Financial Svcs
INSURANCE - Property and; Casualty Insurance
|
$42.29
|
-0.06
-0.14% |
$42.43
|
352,387
60.03% of 50 DAV
50 DAV is 587,000
|
$47.10
-10.21%
|
5/21/2014
|
$44.85
|
PP = $44.85
|
|
MB = $47.09
|
Most Recent Note - 7/23/2014 5:49:03 PM
G - Still sputtering below its 50 DMA line which recently acted as resistance. Faces resistance due to overhead supply up through the $47 level. See the latest FSU analysis for more details and new annotated graphs.
>>> FEATURED STOCK ARTICLE : 50-Day Moving Average Line Acted as Recent Resistance - 7/23/2014
View all notes |
Set NEW NOTE alert |
CANSLIM.net Company Profile |
SEC
News |
Chart |
Request a new note
C
A N
S L
I M
|
BITA
-
NYSE
Bitauto Hldgs Ltd Ads
Internet-Content
|
$56.71
|
+0.35
0.62% |
$57.00
|
483,400
53.71% of 50 DAV
50 DAV is 900,000
|
$58.23
-2.61%
|
6/26/2014
|
$46.20
|
PP = $47.03
|
|
MB = $49.38
|
Most Recent Note - 7/23/2014 4:29:08 PM
G - Hit another new high with below average volume behind today's 4th consecutive gain, getting more extended from its prior base while wedging higher.
>>> FEATURED STOCK ARTICLE : Strength Returned After Shake-Out and Positive Reversal - 7/21/2014
View all notes |
Set NEW NOTE alert |
CANSLIM.net Company Profile |
SEC
News |
Chart |
Request a new note
C
A N
S L
I M
|
BWLD
-
NASDAQ
Buffalo Wild Wings Inc
LEISURE - Restaurants
|
$162.36
|
+1.38
0.86% |
$162.68
|
389,286
105.50% of 50 DAV
50 DAV is 369,000
|
$167.36
-2.99%
|
6/19/2014
|
$158.52
|
PP = $159.91
|
|
MB = $167.91
|
Most Recent Note - 7/22/2014 12:54:24 PM
Y - Rallying with higher volume after finding prompt support at its 50 DMA line, and its color code is changed to yellow. Faces some resistance due to overhead supply up through the $167 level.
>>> FEATURED STOCK ARTICLE : Slump Into Prior Base Negated Recent Breakout - 7/14/2014
View all notes |
Set NEW NOTE alert |
CANSLIM.net Company Profile |
SEC
News |
Chart |
Request a new note
C
A N
S L
I M
|
EQM
-
NYSE
E Q T Midstream Partners
ENERGY - Oil and Gas Pipelines
|
$92.36
|
-1.27
-1.36% |
$93.70
|
251,602
78.87% of 50 DAV
50 DAV is 319,000
|
$102.51
-9.90%
|
12/12/2013
|
$53.17
|
PP = $56.51
|
|
MB = $59.34
|
Most Recent Note - 7/23/2014 4:11:34 PM
G - Still consolidating in an orderly fashion well above its 50 DMA line. Strength has continued despite fundamental flaws repeatedly noted.
>>> FEATURED STOCK ARTICLE : Volume Totals Cooling While Consolidating Near Highs - 7/17/2014
View all notes |
Set NEW NOTE alert |
CANSLIM.net Company Profile |
SEC
News |
Chart |
Request a new note
C
A N
S L
I M
|
Symbol/Exchange
Company Name
Industry Group |
PRICE |
CHANGE
(%Change) |
Day High |
Volume
(% DAV)
(% 50 day avg vol) |
52 Wk Hi
% From Hi |
Featured
Date |
Price
Featured |
Pivot Featured |
|
Max Buy |
FB
-
NASDAQ
Facebook Inc Cl A
INTERNET
|
$75.19
|
+0.21
0.28% |
$75.67
|
45,779,618
100.65% of 50 DAV
50 DAV is 45,485,000
|
$76.74
-2.02%
|
7/24/2014
|
$76.00
|
PP = $72.69
|
|
MB = $76.32
|
Most Recent Note - 7/24/2014 6:19:31 PM
Y - Finished strong after highlighted in yellow with pivot point cited based on its 3/11/14 high plus 10 cents in the earlier mid-day report (read here). The "breakaway gap" with nearly 3 times average volume followed strong earnings news for the Jun '14 quarter and triggered a technical buy signal. See the latest FSU analysis for more details and new annotated graphs.
>>> FEATURED STOCK ARTICLE : Breakaway Gap May Signal Beginning of Meaningful Rally - 7/24/2014
View all notes |
Set NEW NOTE alert |
CANSLIM.net Company Profile |
SEC
News |
Chart |
Request a new note
C
A N
S L
I M
|
GRFS
-
NASDAQ
Grifols Sa Cl B Ads
Medical-Ethical Drugs
|
$42.05
|
-0.02
-0.05% |
$42.58
|
283,766
42.23% of 50 DAV
50 DAV is 672,000
|
$46.66
-9.88%
|
5/15/2014
|
$41.14
|
PP = $43.55
|
|
MB = $45.73
|
Most Recent Note - 7/22/2014 7:16:10 PM
G - Encountered resistance at its 50 DMA line, and a rebound above that important short-term average is needed for its outlook to improve. A subsequent violation of its recent low ($39.86 on 7/10/14) would raise more serious concerns and trigger more worrisome sell signals. Faces resistance due to overhead supply up through the $46 area.
>>> FEATURED STOCK ARTICLE : Violation of 50-Day Moving Average Triggered Technical Sell Signal - 7/9/2014
View all notes |
Set NEW NOTE alert |
CANSLIM.net Company Profile |
SEC
News |
Chart |
Request a new note
C
A N
S L
I M
|
HF
-
NYSE
H F F Inc Cl A
REAL ESTATE - Property Management/Developmen
|
$34.61
|
-0.33
-0.94% |
$34.76
|
133,069
68.95% of 50 DAV
50 DAV is 193,000
|
$38.23
-9.47%
|
6/20/2014
|
$34.60
|
PP = $36.16
|
|
MB = $37.97
|
Most Recent Note - 7/23/2014 4:17:02 PM
Y - Still testing support at its 50 DMA line ($34.21) and recent lows ($33.91 on 7/18/14) where further deterioration would raise greater concerns.
>>> FEATURED STOCK ARTICLE : Slump Into Prior Base Negated Recent Breakout - 7/15/2014
View all notes |
Set NEW NOTE alert |
CANSLIM.net Company Profile |
SEC
News |
Chart |
Request a new note
C
A N
S L
I M
|
ICON
-
NASDAQ
Iconix Brand Group Inc
CONSUMER NON-DURABLES - Textile - Apparel Footwear
|
$42.68
|
+0.02
0.05% |
$43.62
|
583,734
122.89% of 50 DAV
50 DAV is 475,000
|
$44.81
-4.75%
|
6/5/2014
|
$43.54
|
PP = $43.44
|
|
MB = $45.61
|
Most Recent Note - 7/23/2014 4:25:27 PM
G - Up today with heavy volume, rising to its 50 DMA line. Faces some additional resistance due to overhead supply up through the $44 level.
>>> FEATURED STOCK ARTICLE : Slump Below 50-Day Moving Average Line Hurt Outlook - 7/11/2014
View all notes |
Set NEW NOTE alert |
CANSLIM.net Company Profile |
SEC
News |
Chart |
Request a new note
C
A N
S L
I M
|
PANW
-
NYSE
Palo Alto Networks
Computer Sftwr-Security
|
$83.04
|
-1.09
-1.30% |
$84.04
|
1,750,432
97.25% of 50 DAV
50 DAV is 1,800,000
|
$85.78
-3.19%
|
5/29/2014
|
$75.95
|
PP = $72.50
|
|
MB = $76.13
|
Most Recent Note - 7/24/2014 6:22:59 PM
G - Finished at a best-ever close and near the session higher with today's gain on higher volume. Its 50 DMA line and prior highs define important support where subsequent violations would raise serious concerns and trigger technical sell signals.
>>> FEATURED STOCK ARTICLE : Found Support Above 50-Day Average Near Prior Highs - 7/22/2014
View all notes |
Set NEW NOTE alert |
CANSLIM.net Company Profile |
SEC
News |
Chart |
Request a new note
C
A N
S L
I M
|
Symbol/Exchange
Company Name
Industry Group |
PRICE |
CHANGE
(%Change) |
Day High |
Volume
(% DAV)
(% 50 day avg vol) |
52 Wk Hi
% From Hi |
Featured
Date |
Price
Featured |
Pivot Featured |
|
Max Buy |
TARO
-
NYSE
Taro Pharmaceutical Inds
DRUGS - Drug Manufacturers - Other
|
$143.44
|
-1.27
-0.88% |
$145.46
|
32,323
46.84% of 50 DAV
50 DAV is 69,000
|
$149.89
-4.30%
|
6/26/2014
|
$117.31
|
PP = $118.90
|
|
MB = $124.85
|
Most Recent Note - 7/23/2014 4:27:29 PM
G - Stubbornly holding its ground after tallying big gains following its recent breakout, an encouraging sign. Disciplined investors avoid chasing stocks more than +5% above prior highs.
>>> FEATURED STOCK ARTICLE : Big Gains in First 2-3 Weeks After Breakout an Encouraging Sign - 7/18/2014
View all notes |
Set NEW NOTE alert |
CANSLIM.net Company Profile |
SEC
News |
Chart |
Request a new note
C
A N
S L
I M
|
TRN
-
NYSE
Trinity Industries Inc
TRANSPORTATION - Railroads
|
$45.35
|
-0.13
-0.29% |
$45.70
|
2,133,877
70.92% of 50 DAV
50 DAV is 3,009,000
|
$46.29
-2.03%
|
4/30/2014
|
$37.79
|
PP = $38.03
|
|
MB = $39.93
|
Most Recent Note - 7/23/2014 4:31:08 PM
G - Touched a new 52-week high today then erased most of its gain to close near the session low. It is extended from its prior base. Its 50 DMA line defines important near-term support to watch.
>>> FEATURED STOCK ARTICLE : Bullish Up/Down Volume and Increasing Institutional Ownership - 7/8/2014
View all notes |
Set NEW NOTE alert |
CANSLIM.net Company Profile |
SEC
News |
Chart |
Request a new note
C
A N
S L
I M
|
UA
-
NYSE
Under Armour Inc Cl A
CONSUMER NON-DURABLES - Textile - Apparel Clothing
|
$69.11
|
-0.44
-0.63% |
$70.94
|
4,191,639
155.02% of 50 DAV
50 DAV is 2,704,000
|
$70.25
-1.62%
|
7/10/2014
|
$58.50
|
PP = $60.79
|
|
MB = $63.83
|
 Most Recent Note - 7/25/2014 12:48:38 PM
G - Color code is changed to green. Reported earnings +0% on +34% sales revenues for the Jun '14 quarter, below the +25% minimum earnings guideline (C criteria), yet the company raised its guidance. Holding its ground at its 52-week high today following a considerable "breakaway gap" on the prior session with more than 4 times average volume. A breakaway gap is the one noted exception where investors may chase a stock more than +5% above prior highs, however risk increases.
>>> FEATURED STOCK ARTICLE : Forming Handle on Cup-With-Handle Base Pattern - 7/10/2014
View all notes |
Set NEW NOTE alert |
CANSLIM.net Company Profile |
SEC
News |
Chart |
Request a new note
C
A N
S L
I M
|
WLK
-
NYSE
Westlake Chemical Corp
CHEMICALS - Specialty Chemicals
|
$91.25
|
+1.47
1.64% |
$91.80
|
771,502
139.51% of 50 DAV
50 DAV is 553,000
|
$90.00
1.39%
|
4/29/2014
|
$72.79
|
PP = $69.31
|
|
MB = $72.78
|
Most Recent Note - 7/25/2014 6:39:03 PM
G - Hit another new 52-week high with today's 8th consecutive gain, getting more extended from any sound base pattern. Its 50 DMA line defines important near-term support to watch on pullbacks. See the latest FSU analysis for more details and new annotated graphs.
>>> FEATURED STOCK ARTICLE : Extended From Prior Base After Streak of 8 Consecutive Gains - 7/25/2014
View all notes |
Set NEW NOTE alert |
CANSLIM.net Company Profile |
SEC
News |
Chart |
Request a new note
C
A N
S L
I M
|
|
|
|
THESE ARE NOT BUY RECOMMENDATIONS!
Comments contained in the body of this report are technical
opinions only. The material herein has been obtained
from sources believed to be reliable and accurate, however,
its accuracy and completeness cannot be guaranteed.
This site is not an investment advisor, hence it does
not endorse or recommend any securities or other investments.
Any recommendation contained in this report may not
be suitable for all investors and it is not to be deemed
an offer or solicitation on our part with respect to
the purchase or sale of any securities. All trademarks,
service marks and trade names appearing in this report
are the property of their respective owners, and are
likewise used for identification purposes only.
This report is a service available
only to active Paid Premium Members.
You may opt-out of receiving report notifications
at any time. Questions or comments may be submitted
by writing to Premium Membership Services 665 S.E. 10 Street, Suite 201 Deerfield Beach, FL 33441-5634 or by calling 1-800-965-8307
or 954-785-1121.
|
|
|

