You are not logged in.
This means you
CAN ONLY VIEW reports that were published prior to Monday, April 14, 2025.
You
MUST UPGRADE YOUR MEMBERSHIP if you want to see any current reports.
AFTER MARKET UPDATE - MONDAY, JULY 28TH, 2014
Previous After Market Report Next After Market Report >>>
|
|
|
|
DOW |
+22.02 |
16,982.59 |
+0.13% |
|
Volume |
576,378,790 |
+3% |
|
Volume |
1,664,821,720 |
+5% |
|
NASDAQ |
-4.65 |
4,444.91 |
-0.10% |
|
Advancers |
1,323 |
42% |
|
Advancers |
999 |
35% |
|
S&P 500 |
+0.57 |
1,978.91 |
+0.03% |
|
Decliners |
1,720 |
54% |
|
Decliners |
1,755 |
61% |
|
Russell 2000 |
-5.22 |
1,139.50 |
-0.46% |
|
52 Wk Highs |
90 |
|
|
52 Wk Highs |
55 |
|
|
S&P 600 |
-2.26 |
657.32 |
-0.34% |
|
52 Wk Lows |
58 |
|
|
52 Wk Lows |
76 |
|
|
 |
Major Averages Ended Flat After Early Weakness
Kenneth J. Gruneisen - Passed the CAN SLIM® Master's Exam
Stocks finished flat on Monday. The Dow rose 22 points to 16,982. The S&P 500 closed virtually unchanged at 1,978. The NASDAQ was down 4 points to 4,444. The volume totals were higher than the prior session volume totals on the NYSE and on the Nasdaq exchange. Breadth was negative as decliners led advancers by a 7-5 margin on the NYSE and 9-5 on the Nasdaq exchange. Leadership contracted as there were 21 high-ranked companies from the CANSLIM.net Leaders List that made new 52-week highs and appeared on the CANSLIM.net BreakOuts Page, versus the prior session total of 26 stocks. New 52-week highs outnumbered new 52-week lows on the NYSE, but new lows outnumbered new highs on the Nasdaq exchange. There were gains for 9 of the 14 of the high-ranked companies currently included on the Featured Stocks Page. The market (M criteria) uptrend recently faced pressure, however a healthy level of leadership has been reassuring. Disciplined investors limit losses and reduce market exposure during rough market periods by selling any stocks which fall more than -7% from their purchase price.
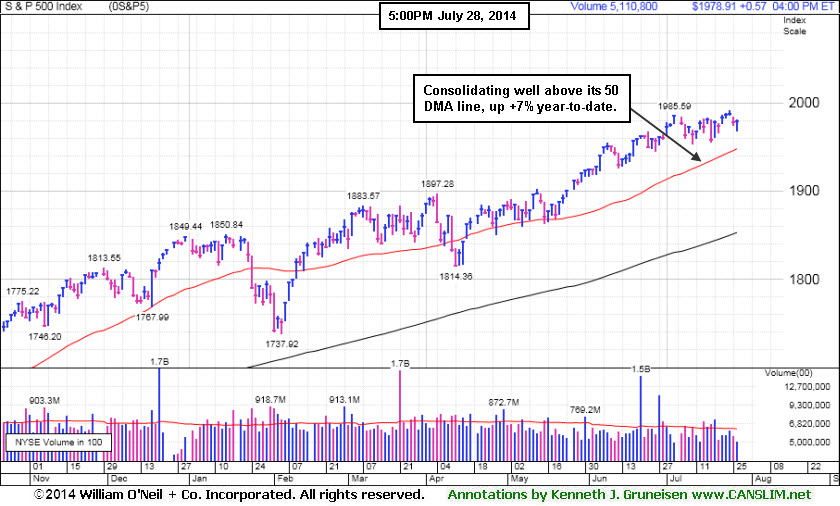
PICTURED: The S&P 500 Index is consolidating well above its 50-day moving average (DMA) line, up +7% year-to-date.
The major averages spent the day toggling between gains and losses as M&A activity helped overshadow disappointing housing data. Family Dollar rallied (FDO +24.86%) rallied as Dollar Tree (DLTR +1.20%) agreed to buy the company for $8.5 billion. Trulia (TRLA +15.42%) rose after Zillow (Z +0.92%) announced it will purchase its rival for $3.5 billion. On the economic front, pending home sales unexpectedly fell the most since last November as purchases declined by -1.1% in June. Other data was positive. Manufacturing in the region covered by the Dallas Fed rose to the best level since last September while a gauge showed activity in the U.S. services sector held at its highest level in 4-1/2 years in July.
Overall, seven of the 10 S&P 500 sectors advanced. Utilities and telecom were the best performing groups as investors turned to defensive issues. American Electric Power (AEP +2.69) and Verizon (VZ +0.59%). Industrials and consumer staples lagged behind. Cummins (CMI -3.20%) despite posting better-than-expected earnings results. Shares of Walgreen (WAG -2.51%) declined.
Treasuries fell and the government sold $29 billion of two-year notes at the highest yield since May 2011. The 10-year note declined 5/32 to yield 2.48%.
|
 Kenneth J. Gruneisen started out as a licensed stockbroker in August 1987, a couple of months prior to the historic stock market crash that took the Dow Jones Industrial Average down -22.6% in a single day. He has published daily fact-based fundamental and technical analysis on high-ranked stocks online for two decades. Through FACTBASEDINVESTING.COM, Kenneth provides educational articles, news, market commentary, and other information regarding proven investment systems that work in good times and bad.
Comments contained in the body of this report are technical opinions only and are not necessarily those of Gruneisen Growth Corp. The material herein has been obtained from sources believed to be reliable and accurate, however, its accuracy and completeness cannot be guaranteed. Our firm, employees, and customers may effect transactions, including transactions contrary to any recommendation herein, or have positions in the securities mentioned herein or options with respect thereto. Any recommendation contained in this report may not be suitable for all investors and it is not to be deemed an offer or solicitation on our part with respect to the purchase or sale of any securities. |
|
 |
Little Decisiveness on Session Among Various Industry Groups
Kenneth J. Gruneisen - Passed the CAN SLIM® Master's Exam
There was no decisiveness among various industry groups on Monday as the Bank Index ($BKX -0.70%) lost ground while the Broker/Dealer Index ($XBD +0.16%) and the Retail Index ($RLX +0.19%) eked out small gains. Commodity-linked groups were mixed as the Oil Services Index ($OSX -0.57%) and the Integrated Oil Index ($XOI -0.22%) both edged lower while the Gold & Silver Index ($XAU +0.59%) posted a modest gain. The Biotechnology Index ($BTK -0.54%) and the Semiconductor Index ($SOX -0.11%) both finished in slightly in the red while the Networking Index ($NWX +0.19%) managed a tiny gain.
Charts courtesy www.stockcharts.com
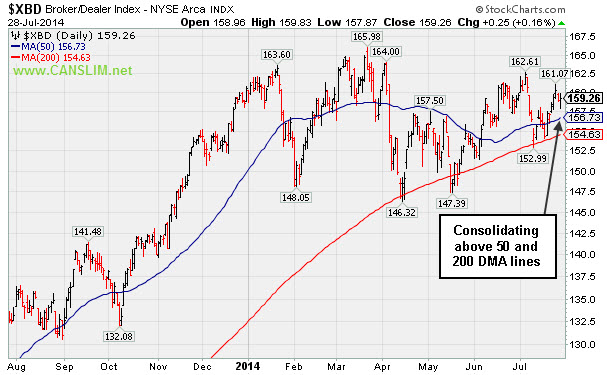
PICTURED: The Broker/Dealer Index ($XBD +0.16%) is consolidating above its 50-day and 200-day moving average (DMA) lines.
| Oil Services |
$OSX |
299.08 |
-1.72 |
-0.57% |
+6.42% |
| Integrated Oil |
$XOI |
1,682.59 |
-3.66 |
-0.22% |
+11.94% |
| Semiconductor |
$SOX |
616.00 |
-0.65 |
-0.11% |
+15.13% |
| Networking |
$NWX |
334.10 |
+0.64 |
+0.19% |
+3.14% |
| Broker/Dealer |
$XBD |
159.26 |
+0.25 |
+0.16% |
-0.81% |
| Retail |
$RLX |
888.77 |
+1.65 |
+0.19% |
-5.43% |
| Gold & Silver |
$XAU |
102.19 |
+0.60 |
+0.59% |
+21.44% |
| Bank |
$BKX |
71.10 |
-0.50 |
-0.70% |
+2.66% |
| Biotech |
$BTK |
2,732.37 |
-14.81 |
-0.54% |
+17.25% |
|
|
|
 |
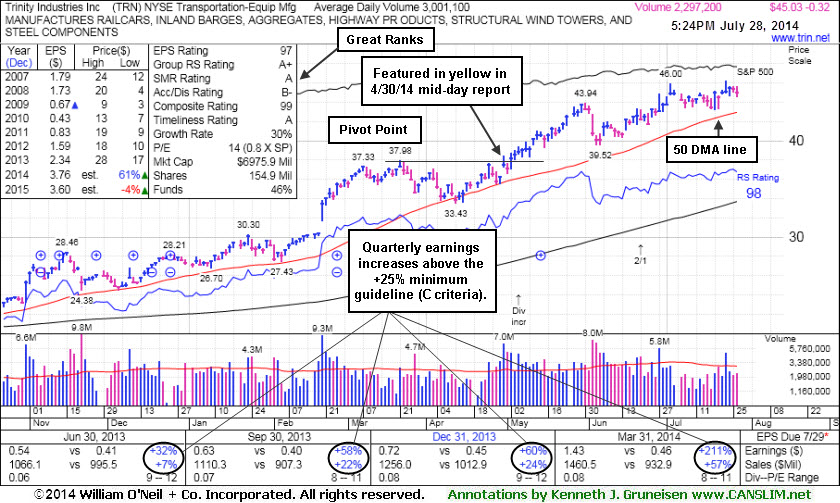
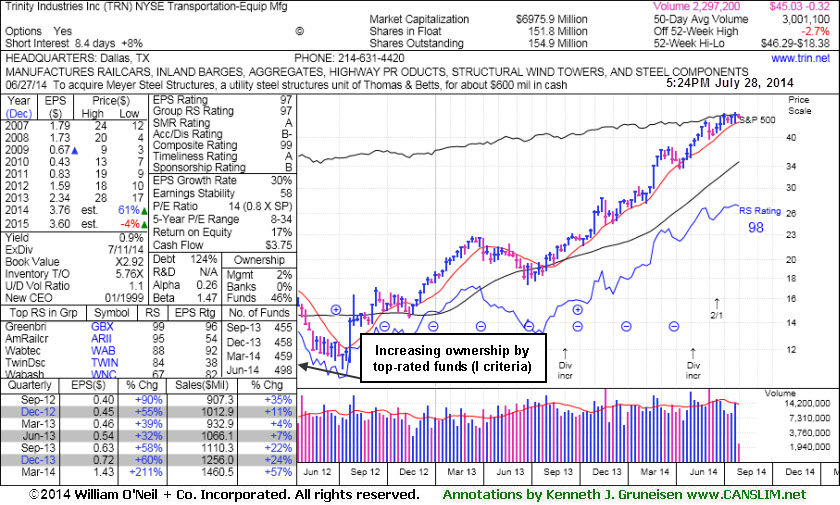
Earnings News Due Following Tuesday's Close
Kenneth J. Gruneisen - Passed the CAN SLIM® Master's Exam
Trinity Industries Inc (TRN -$0.32 or -0.71% to $45.03) is perched within close striking distance of a new 52-week high. It is extended from its prior base, and its 50-day moving average (DMA) line ($42.95) defines near-term support to watch. Subsequent deterioration below that important short-term average would raise concerns and trigger technical sell signals.
Keep in mind that volume and volatility often increase near earnings news and it is due to report Jun '14 quarterly results after the close on Tuesday. It has earned high ranks and reported earnings +213% on +57% sales revenues for the Mar '14 quarter. Prior quarterly comparisons were above the +25% minimum earnings guideline (C criteria). Annual earnings (A criteria) have improved following a downturn in FY '08-10.
The high-ranked Transportation - Equipment Manufacturing firm was last shown in this FSU section on 7/08/14 with annotated graphs under the headline, "Bullish Up/Down Volume and Increasing Institutional Ownership". TRN traded up as much as +22.59% since first highlighted in yellow in the 4/30/14 mid-day report report (read here). Disciplined investors avoid chasing stocks extended more than +5% above prior highs and they always limit losses by selling any stock that falls more than -7% from their purchase price.
The number of top-rated funds owning its shares rose from 455 in Sep '13 to 498 in Jun '14, a reassuring sign concerning the I criteria. Its supply of shares outstanding (S criteria) was doubled as a 2:1 split was effective as of 6/20/14.
|
|
|
Color Codes Explained :
Y - Better candidates highlighted by our
staff of experts.
G - Previously featured
in past reports as yellow but may no longer be buyable under the
guidelines.
***Last / Change / Volume data in this table is the closing quote data***
Symbol/Exchange
Company Name
Industry Group |
PRICE |
CHANGE
(%Change) |
Day High |
Volume
(% DAV)
(% 50 day avg vol) |
52 Wk Hi
% From Hi |
Featured
Date |
Price
Featured |
Pivot Featured |
|
Max Buy |
ACT
-
NYSE
Actavis plc
Medical-Generic Drugs
|
$214.94
|
-2.51
-1.15% |
$218.26
|
1,529,319
71.73% of 50 DAV
50 DAV is 2,132,000
|
$230.77
-6.86%
|
6/20/2014
|
$216.53
|
PP = $230.87
|
|
MB = $242.41
|
Most Recent Note - 7/22/2014 7:17:36 PM
Y - Found support while consolidating above its 50 DMA line ($214.40), still hovering within close striking distance of its 52-week high. Subsequent volume-driven gains to new highs may trigger a technical buy signal.
>>> FEATURED STOCK ARTICLE : Disciplined Investors Still Awaiting Technical Breakout - 7/16/2014
View all notes |
Set NEW NOTE alert |
CANSLIM.net Company Profile |
SEC
News |
Chart |
Request a new note
C
A N
S L
I M


|
AFSI
-
NASDAQ
Amtrust Financial Svcs
INSURANCE - Property and; Casualty Insurance
|
$42.90
|
+0.61
1.44% |
$42.97
|
340,292
58.17% of 50 DAV
50 DAV is 585,000
|
$47.10
-8.92%
|
5/21/2014
|
$44.85
|
PP = $44.85
|
|
MB = $47.09
|
Most Recent Note - 7/23/2014 5:49:03 PM
G - Still sputtering below its 50 DMA line which recently acted as resistance. Faces resistance due to overhead supply up through the $47 level. See the latest FSU analysis for more details and new annotated graphs.
>>> FEATURED STOCK ARTICLE : 50-Day Moving Average Line Acted as Recent Resistance - 7/23/2014
View all notes |
Set NEW NOTE alert |
CANSLIM.net Company Profile |
SEC
News |
Chart |
Request a new note
C
A N
S L
I M
|
BITA
-
NYSE
Bitauto Hldgs Ltd Ads
Internet-Content
|
$57.79
|
+1.08
1.90% |
$58.50
|
551,384
61.75% of 50 DAV
50 DAV is 893,000
|
$58.23
-0.76%
|
6/26/2014
|
$46.20
|
PP = $47.03
|
|
MB = $49.38
|
Most Recent Note - 7/23/2014 4:29:08 PM
G - Hit another new high with below average volume behind today's 4th consecutive gain, getting more extended from its prior base while wedging higher.
>>> FEATURED STOCK ARTICLE : Strength Returned After Shake-Out and Positive Reversal - 7/21/2014
View all notes |
Set NEW NOTE alert |
CANSLIM.net Company Profile |
SEC
News |
Chart |
Request a new note
C
A N
S L
I M
|
BWLD
-
NASDAQ
Buffalo Wild Wings Inc
LEISURE - Restaurants
|
$164.73
|
+2.37
1.46% |
$165.64
|
572,608
155.60% of 50 DAV
50 DAV is 368,000
|
$167.36
-1.57%
|
6/19/2014
|
$158.52
|
PP = $159.91
|
|
MB = $167.91
|
 Most Recent Note - 7/28/2014 12:06:13 PM
Y - Small gap up today for a 5th consecutive gain after finding prompt support at its 50 DMA line. Little resistance remains due to overhead supply up through the $167 level.
>>> FEATURED STOCK ARTICLE : Slump Into Prior Base Negated Recent Breakout - 7/14/2014
View all notes |
Set NEW NOTE alert |
CANSLIM.net Company Profile |
SEC
News |
Chart |
Request a new note
C
A N
S L
I M
|
EQM
-
NYSE
E Q T Midstream Partners
ENERGY - Oil and Gas Pipelines
|
$93.75
|
+1.39
1.50% |
$94.45
|
219,227
68.30% of 50 DAV
50 DAV is 321,000
|
$102.51
-8.55%
|
12/12/2013
|
$53.17
|
PP = $56.51
|
|
MB = $59.34
|
Most Recent Note - 7/23/2014 4:11:34 PM
G - Still consolidating in an orderly fashion well above its 50 DMA line. Strength has continued despite fundamental flaws repeatedly noted.
>>> FEATURED STOCK ARTICLE : Volume Totals Cooling While Consolidating Near Highs - 7/17/2014
View all notes |
Set NEW NOTE alert |
CANSLIM.net Company Profile |
SEC
News |
Chart |
Request a new note
C
A N
S L
I M
|
Symbol/Exchange
Company Name
Industry Group |
PRICE |
CHANGE
(%Change) |
Day High |
Volume
(% DAV)
(% 50 day avg vol) |
52 Wk Hi
% From Hi |
Featured
Date |
Price
Featured |
Pivot Featured |
|
Max Buy |
FB
-
NASDAQ
Facebook Inc Cl A
INTERNET
|
$74.92
|
-0.27
-0.36% |
$75.50
|
41,556,091
91.42% of 50 DAV
50 DAV is 45,454,000
|
$76.74
-2.37%
|
7/24/2014
|
$76.00
|
PP = $72.69
|
|
MB = $76.32
|
Most Recent Note - 7/24/2014 6:19:31 PM
Y - Finished strong after highlighted in yellow with pivot point cited based on its 3/11/14 high plus 10 cents in the earlier mid-day report (read here). The "breakaway gap" with nearly 3 times average volume followed strong earnings news for the Jun '14 quarter and triggered a technical buy signal. See the latest FSU analysis for more details and new annotated graphs.
>>> FEATURED STOCK ARTICLE : Breakaway Gap May Signal Beginning of Meaningful Rally - 7/24/2014
View all notes |
Set NEW NOTE alert |
CANSLIM.net Company Profile |
SEC
News |
Chart |
Request a new note
C
A N
S L
I M
|
GRFS
-
NASDAQ
Grifols Sa Cl B Ads
Medical-Ethical Drugs
|
$42.41
|
+0.36
0.86% |
$42.55
|
426,663
63.78% of 50 DAV
50 DAV is 669,000
|
$46.66
-9.11%
|
5/15/2014
|
$41.14
|
PP = $43.55
|
|
MB = $45.73
|
Most Recent Note - 7/22/2014 7:16:10 PM
G - Encountered resistance at its 50 DMA line, and a rebound above that important short-term average is needed for its outlook to improve. A subsequent violation of its recent low ($39.86 on 7/10/14) would raise more serious concerns and trigger more worrisome sell signals. Faces resistance due to overhead supply up through the $46 area.
>>> FEATURED STOCK ARTICLE : Violation of 50-Day Moving Average Triggered Technical Sell Signal - 7/9/2014
View all notes |
Set NEW NOTE alert |
CANSLIM.net Company Profile |
SEC
News |
Chart |
Request a new note
C
A N
S L
I M
|
HF
-
NYSE
H F F Inc Cl A
REAL ESTATE - Property Management/Developmen
|
$34.75
|
+0.14
0.40% |
$34.97
|
134,392
70.00% of 50 DAV
50 DAV is 192,000
|
$38.23
-9.10%
|
6/20/2014
|
$34.60
|
PP = $36.16
|
|
MB = $37.97
|
Most Recent Note - 7/23/2014 4:17:02 PM
Y - Still testing support at its 50 DMA line ($34.21) and recent lows ($33.91 on 7/18/14) where further deterioration would raise greater concerns.
>>> FEATURED STOCK ARTICLE : Slump Into Prior Base Negated Recent Breakout - 7/15/2014
View all notes |
Set NEW NOTE alert |
CANSLIM.net Company Profile |
SEC
News |
Chart |
Request a new note
C
A N
S L
I M
|
ICON
-
NASDAQ
Iconix Brand Group Inc
CONSUMER NON-DURABLES - Textile - Apparel Footwear
|
$42.71
|
+0.03
0.07% |
$42.90
|
534,636
117.24% of 50 DAV
50 DAV is 456,000
|
$44.81
-4.69%
|
6/5/2014
|
$43.54
|
PP = $43.44
|
|
MB = $45.61
|
Most Recent Note - 7/23/2014 4:25:27 PM
G - Up today with heavy volume, rising to its 50 DMA line. Faces some additional resistance due to overhead supply up through the $44 level.
>>> FEATURED STOCK ARTICLE : Slump Below 50-Day Moving Average Line Hurt Outlook - 7/11/2014
View all notes |
Set NEW NOTE alert |
CANSLIM.net Company Profile |
SEC
News |
Chart |
Request a new note
C
A N
S L
I M
|
PANW
-
NYSE
Palo Alto Networks
Computer Sftwr-Security
|
$82.11
|
-0.93
-1.12% |
$83.49
|
937,350
51.67% of 50 DAV
50 DAV is 1,814,000
|
$85.78
-4.28%
|
5/29/2014
|
$75.95
|
PP = $72.50
|
|
MB = $76.13
|
Most Recent Note - 7/24/2014 6:22:59 PM
G - Finished at a best-ever close and near the session higher with today's gain on higher volume. Its 50 DMA line and prior highs define important support where subsequent violations would raise serious concerns and trigger technical sell signals.
>>> FEATURED STOCK ARTICLE : Found Support Above 50-Day Average Near Prior Highs - 7/22/2014
View all notes |
Set NEW NOTE alert |
CANSLIM.net Company Profile |
SEC
News |
Chart |
Request a new note
C
A N
S L
I M
|
Symbol/Exchange
Company Name
Industry Group |
PRICE |
CHANGE
(%Change) |
Day High |
Volume
(% DAV)
(% 50 day avg vol) |
52 Wk Hi
% From Hi |
Featured
Date |
Price
Featured |
Pivot Featured |
|
Max Buy |
TARO
-
NYSE
Taro Pharmaceutical Inds
DRUGS - Drug Manufacturers - Other
|
$141.86
|
-1.58
-1.10% |
$144.81
|
59,813
86.69% of 50 DAV
50 DAV is 69,000
|
$149.89
-5.36%
|
6/26/2014
|
$117.31
|
PP = $118.90
|
|
MB = $124.85
|
Most Recent Note - 7/23/2014 4:27:29 PM
G - Stubbornly holding its ground after tallying big gains following its recent breakout, an encouraging sign. Disciplined investors avoid chasing stocks more than +5% above prior highs.
>>> FEATURED STOCK ARTICLE : Big Gains in First 2-3 Weeks After Breakout an Encouraging Sign - 7/18/2014
View all notes |
Set NEW NOTE alert |
CANSLIM.net Company Profile |
SEC
News |
Chart |
Request a new note
C
A N
S L
I M
|
TRN
-
NYSE
Trinity Industries Inc
TRANSPORTATION - Railroads
|
$45.03
|
-0.32
-0.71% |
$45.69
|
2,298,459
76.59% of 50 DAV
50 DAV is 3,001,000
|
$46.29
-2.72%
|
4/30/2014
|
$37.79
|
PP = $38.03
|
|
MB = $39.93
|
Most Recent Note - 7/28/2014 5:45:14 PM
G - Perched near its 52-week high and consolidating above its 50 DMA line defining important near-term support to watch. Due to report Jun '14 quarterly earnings after the close on Tuesday. See the latest FSU analysis for more details and new annotated graphs.
>>> FEATURED STOCK ARTICLE : Earnings News Due Following Tuesday's Close - 7/28/2014
View all notes |
Set NEW NOTE alert |
CANSLIM.net Company Profile |
SEC
News |
Chart |
Request a new note
C
A N
S L
I M
|
UA
-
NYSE
Under Armour Inc Cl A
CONSUMER NON-DURABLES - Textile - Apparel Clothing
|
$69.63
|
+0.52
0.75% |
$70.09
|
2,385,554
86.72% of 50 DAV
50 DAV is 2,751,000
|
$70.94
-1.85%
|
7/10/2014
|
$58.50
|
PP = $60.79
|
|
MB = $63.83
|
Most Recent Note - 7/25/2014 12:48:38 PM
G - Color code is changed to green. Reported earnings +0% on +34% sales revenues for the Jun '14 quarter, below the +25% minimum earnings guideline (C criteria), yet the company raised its guidance. Holding its ground at its 52-week high today following a considerable "breakaway gap" on the prior session with more than 4 times average volume. A breakaway gap is the one noted exception where investors may chase a stock more than +5% above prior highs, however risk increases.
>>> FEATURED STOCK ARTICLE : Forming Handle on Cup-With-Handle Base Pattern - 7/10/2014
View all notes |
Set NEW NOTE alert |
CANSLIM.net Company Profile |
SEC
News |
Chart |
Request a new note
C
A N
S L
I M
|
WLK
-
NYSE
Westlake Chemical Corp
CHEMICALS - Specialty Chemicals
|
$91.58
|
+0.33
0.36% |
$91.97
|
771,910
138.58% of 50 DAV
50 DAV is 557,000
|
$91.80
-0.24%
|
4/29/2014
|
$72.79
|
PP = $69.31
|
|
MB = $72.78
|
Most Recent Note - 7/25/2014 6:39:03 PM
G - Hit another new 52-week high with today's 8th consecutive gain, getting more extended from any sound base pattern. Its 50 DMA line defines important near-term support to watch on pullbacks. See the latest FSU analysis for more details and new annotated graphs.
>>> FEATURED STOCK ARTICLE : Extended From Prior Base After Streak of 8 Consecutive Gains - 7/25/2014
View all notes |
Set NEW NOTE alert |
CANSLIM.net Company Profile |
SEC
News |
Chart |
Request a new note
C
A N
S L
I M
|
|
|
|
THESE ARE NOT BUY RECOMMENDATIONS!
Comments contained in the body of this report are technical
opinions only. The material herein has been obtained
from sources believed to be reliable and accurate, however,
its accuracy and completeness cannot be guaranteed.
This site is not an investment advisor, hence it does
not endorse or recommend any securities or other investments.
Any recommendation contained in this report may not
be suitable for all investors and it is not to be deemed
an offer or solicitation on our part with respect to
the purchase or sale of any securities. All trademarks,
service marks and trade names appearing in this report
are the property of their respective owners, and are
likewise used for identification purposes only.
This report is a service available
only to active Paid Premium Members.
You may opt-out of receiving report notifications
at any time. Questions or comments may be submitted
by writing to Premium Membership Services 665 S.E. 10 Street, Suite 201 Deerfield Beach, FL 33441-5634 or by calling 1-800-965-8307
or 954-785-1121.
|
|
|

