You are not logged in.
This means you
CAN ONLY VIEW reports that were published prior to Tuesday, April 15, 2025.
You
MUST UPGRADE YOUR MEMBERSHIP if you want to see any current reports.
AFTER MARKET UPDATE - THURSDAY, JULY 24TH, 2014
Previous After Market Report Next After Market Report >>>
|
|
|
|
DOW |
-2.83 |
17,083.80 |
-0.02% |
|
Volume |
619,322,160 |
+9% |
|
Volume |
1,752,898,860 |
+0% |
|
NASDAQ |
-1.59 |
4,472.11 |
-0.04% |
|
Advancers |
1,420 |
45% |
|
Advancers |
1,258 |
44% |
|
S&P 500 |
+0.97 |
1,987.98 |
+0.05% |
|
Decliners |
1,604 |
51% |
|
Decliners |
1,475 |
52% |
|
Russell 2000 |
-1.85 |
1,156.26 |
-0.16% |
|
52 Wk Highs |
210 |
|
|
52 Wk Highs |
75 |
|
|
S&P 600 |
-0.02 |
665.98 |
-0.00% |
|
52 Wk Lows |
21 |
|
|
52 Wk Lows |
33 |
|
|
 |
Major Averages Erased Early Gains to Finish Flat
Kenneth J. Gruneisen - Passed the CAN SLIM® Master's Exam
Wall Street retreated from early highs to close mixed on Thursday. The volume totals were slightly higher than the prior session volume totals on the NYSE and on the Nasdaq exchange. Breadth was tilted slightly to the negative side as decliners led advancers by about a 7-6 margin on the NYSE and on the Nasdaq exchange. There were 57 high-ranked companies from the CANSLIM.net Leaders List that made new 52-week highs and appeared on the CANSLIM.net BreakOuts Page, up from the prior session total of 47 stocks. New 52-week highs outnumbered new 52-week lows on the NYSE and on the Nasdaq exchange. There were gains for 10 of the 14 of the high-ranked companies currently included on the Featured Stocks Page. The market (M criteria) uptrend recently faced pressure, however the latest expansion in leadership has been reassuring. Disciplined investors limit losses and reduce market exposure during rough market periods by selling any stocks which fall more than -7% from their purchase price.
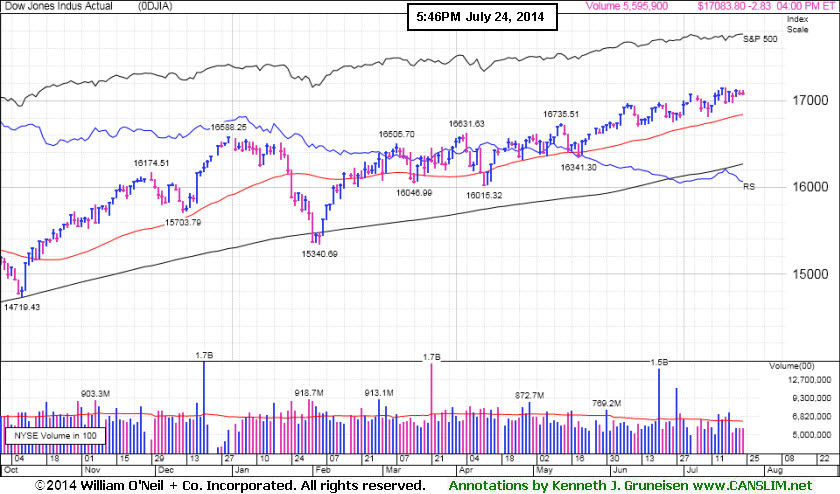
PICTURED: The Dow Jones Industrials lost 3 point to 17,083.
The S&P 500 Index gained 1 point to 1,988, eking out another new record high while the NASDAQ Composite lost 2 points to 4,472. Stocks saw some early gains but stumbled slightly in the afternoon session to close essentially flat. Mixed economic reports weighed on investors' minds. New home sales declined by -8.1% last month following the largest increase on record back in May. Aiding and abetting was a manufacturing report that showed activity fell in July from a four-year high. Additionally, the European Union issued further sanctions against Russia, which bred some market uncertainty. Falling jobless claims were not enough to draw the major averages higher however.
Overall, six of the 10 S&P 500 sectors advanced meagerly. Consumer discretionary and consumer staples were up the most as Philip Morris International (PM +0.54%) and CVS Caremark (CVS +0.97%) rose. Amazon.com (AMZN +0.13%) rallied on the day ahead of its earnings report. After the negative new home sales data and negative earnings, DR Horton (DHI -11.53%). Telecom was lower on the day. Shares of AT&T (T -1.06%) fell after the wireless carrier reported disappointing earnings.
The benchmark 10-year treasury lost 14/32 to yield 2.50%.
The CANSLIM.net Featured Stocks Page shows the most action-worthy candidates and their latest notes and a Headline Link directs members to the latest detailed analysis with data-packed graphs annotated by a Certified expert along with links to additional resources. The Premium Member Homepage includes "dynamic archives" to all prior pay reports published. Watch for an announcement via email concerning the next WEBCAST.
|
 Kenneth J. Gruneisen started out as a licensed stockbroker in August 1987, a couple of months prior to the historic stock market crash that took the Dow Jones Industrial Average down -22.6% in a single day. He has published daily fact-based fundamental and technical analysis on high-ranked stocks online for two decades. Through FACTBASEDINVESTING.COM, Kenneth provides educational articles, news, market commentary, and other information regarding proven investment systems that work in good times and bad.
Comments contained in the body of this report are technical opinions only and are not necessarily those of Gruneisen Growth Corp. The material herein has been obtained from sources believed to be reliable and accurate, however, its accuracy and completeness cannot be guaranteed. Our firm, employees, and customers may effect transactions, including transactions contrary to any recommendation herein, or have positions in the securities mentioned herein or options with respect thereto. Any recommendation contained in this report may not be suitable for all investors and it is not to be deemed an offer or solicitation on our part with respect to the purchase or sale of any securities. |
|
 |
Retail, Financial, and Networking Indexes Rose
Kenneth J. Gruneisen - Passed the CAN SLIM® Master's Exam
Commodity-linked groups had a negative bias as the Gold & Silver Index ($XAU -1.74%) and Oil Services Index ($OSX -2.02%) slumped while the Integrated Oil Index ($XOI +0.26%) eked out a small gain. The tech sector was mixed as the Biotechnology Index ($BTK -1.53%) and Semiconductor Index ($SOX -0.84%) fell while the Networking Index ($NWX +1.39%) rose. The Retail Index ($RLX +0.39%) has a positive influence on the major averages and financial shares also helped as the Broker/Dealer Index ($XBD +0.52%) and the Bank Index ($BKX +0.87%) rose.
Charts courtesy www.stockcharts.com
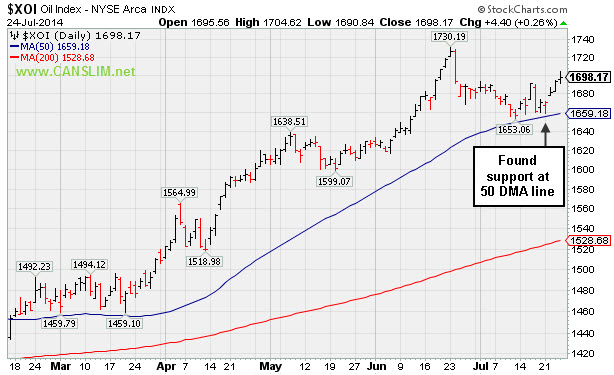
PICTURED: The Integrated Oil Index ($XOI +0.26%) recently found support at its 50-day moving average (DMA) line.
| Oil Services |
$OSX |
302.02 |
-6.23 |
-2.02% |
+7.47% |
| Integrated Oil |
$XOI |
1,698.17 |
+4.40 |
+0.26% |
+12.97% |
| Semiconductor |
$SOX |
629.13 |
-5.32 |
-0.84% |
+17.59% |
| Networking |
$NWX |
335.64 |
+4.62 |
+1.39% |
+3.61% |
| Broker/Dealer |
$XBD |
160.23 |
+0.84 |
+0.52% |
-0.20% |
| Retail |
$RLX |
908.58 |
+3.49 |
+0.39% |
-3.32% |
| Gold & Silver |
$XAU |
98.56 |
-1.75 |
-1.74% |
+17.12% |
| Bank |
$BKX |
71.48 |
+0.62 |
+0.87% |
+3.21% |
| Biotech |
$BTK |
2,765.11 |
-42.92 |
-1.53% |
+18.65% |
|
|
|
 |
Breakaway Gap May Signal Beginning of Meaningful Rally
Kenneth J. Gruneisen - Passed the CAN SLIM® Master's Exam
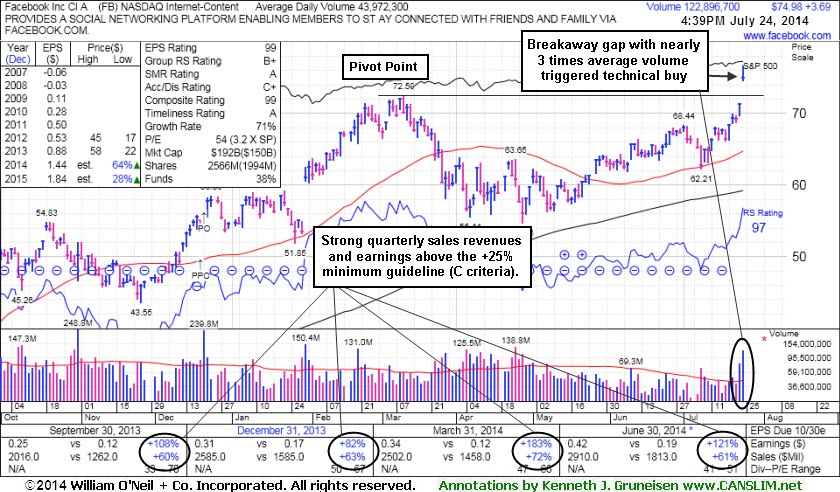
Facebook Inc (FB +$3.69 or +5.18% to $74.98) was highlighted in yellow with pivot point cited based on its 3/11/14 high plus 10 cents in the earlier breakouts report (read here). The "breakaway gap" with nearly 3 times average volume triggered a technical buy signal after reporting earnings +121% on +61% sales revenues for the Jun '14 quarter, its 5th consecutive quarterly comparison with earnings increasing well above the +25% minimum (C criteria). It found support at its 50-day moving average (DMA) line during its latest consolidation.
Facebook was last shown in this FSU section on 4/04/14 with annotated graphs under the headline, "Facebook Unfriended After Technical Weakness (See More Comments)". At the time it was triggering a more worrisome technical sell signal, slumping below prior highs in the $58 area. It stayed well above its 200 DMA line during its consolidation after dropped from the Featured Stocks list on 4/04/14 due to weakness. Members were reminded - "Remember that any stock that is sold can always be bought back again later if strength returns."
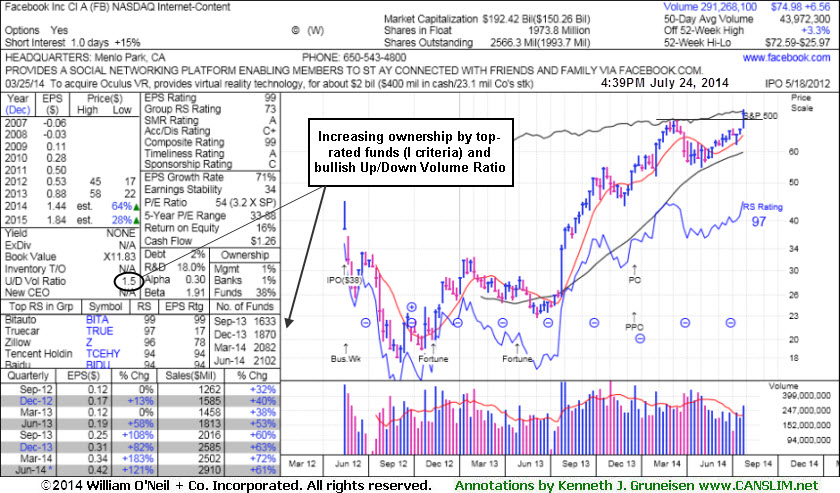
Its current Up/Down Volume Ratio of 1.5 is an unbiased bullish indication its shares have been under accumulation over the past 50 days. The high-ranked Internet - Content group leader has seen the number of top-rated funds owning its shares rise from 1,116 in Dec '12 to 2,102 in Jun '14, a reassuring sign concerning the I criteria. However, members were previously warned - "Keep in mind that its large supply of 2.54 billion shares in the public float makes it an unlikely sprinter, especially as it is already well known by the institutional crowd and the general public."
|
|
|
Color Codes Explained :
Y - Better candidates highlighted by our
staff of experts.
G - Previously featured
in past reports as yellow but may no longer be buyable under the
guidelines.
***Last / Change / Volume data in this table is the closing quote data***
Symbol/Exchange
Company Name
Industry Group |
PRICE |
CHANGE
(%Change) |
Day High |
Volume
(% DAV)
(% 50 day avg vol) |
52 Wk Hi
% From Hi |
Featured
Date |
Price
Featured |
Pivot Featured |
|
Max Buy |
ACT
-
NYSE
Actavis plc
Medical-Generic Drugs
|
$218.68
|
-0.95
-0.43% |
$219.75
|
1,753,482
81.98% of 50 DAV
50 DAV is 2,139,000
|
$230.77
-5.24%
|
6/20/2014
|
$216.53
|
PP = $230.87
|
|
MB = $242.41
|
Most Recent Note - 7/22/2014 7:17:36 PM
Y - Found support while consolidating above its 50 DMA line ($214.40), still hovering within close striking distance of its 52-week high. Subsequent volume-driven gains to new highs may trigger a technical buy signal.
>>> FEATURED STOCK ARTICLE : Disciplined Investors Still Awaiting Technical Breakout - 7/16/2014
View all notes |
Set NEW NOTE alert |
CANSLIM.net Company Profile |
SEC
News |
Chart |
Request a new note
C
A N
S L
I M


|
AFSI
-
NASDAQ
Amtrust Financial Svcs
INSURANCE - Property and; Casualty Insurance
|
$42.35
|
+0.94
2.27% |
$42.41
|
410,907
69.29% of 50 DAV
50 DAV is 593,000
|
$47.10
-10.08%
|
5/21/2014
|
$44.85
|
PP = $44.85
|
|
MB = $47.09
|
Most Recent Note - 7/23/2014 5:49:03 PM
G - Still sputtering below its 50 DMA line which recently acted as resistance. Faces resistance due to overhead supply up through the $47 level. See the latest FSU analysis for more details and new annotated graphs.
>>> FEATURED STOCK ARTICLE : 50-Day Moving Average Line Acted as Recent Resistance - 7/23/2014
View all notes |
Set NEW NOTE alert |
CANSLIM.net Company Profile |
SEC
News |
Chart |
Request a new note
C
A N
S L
I M
|
BITA
-
NYSE
Bitauto Hldgs Ltd Ads
Internet-Content
|
$56.36
|
-0.35
-0.62% |
$58.23
|
789,619
86.96% of 50 DAV
50 DAV is 908,000
|
$57.05
-1.20%
|
6/26/2014
|
$46.20
|
PP = $47.03
|
|
MB = $49.38
|
Most Recent Note - 7/23/2014 4:29:08 PM
G - Hit another new high with below average volume behind today's 4th consecutive gain, getting more extended from its prior base while wedging higher.
>>> FEATURED STOCK ARTICLE : Strength Returned After Shake-Out and Positive Reversal - 7/21/2014
View all notes |
Set NEW NOTE alert |
CANSLIM.net Company Profile |
SEC
News |
Chart |
Request a new note
C
A N
S L
I M
|
BWLD
-
NASDAQ
Buffalo Wild Wings Inc
LEISURE - Restaurants
|
$160.98
|
+2.42
1.53% |
$161.77
|
358,716
97.21% of 50 DAV
50 DAV is 369,000
|
$167.36
-3.81%
|
6/19/2014
|
$158.52
|
PP = $159.91
|
|
MB = $167.91
|
Most Recent Note - 7/22/2014 12:54:24 PM
Y - Rallying with higher volume after finding prompt support at its 50 DMA line, and its color code is changed to yellow. Faces some resistance due to overhead supply up through the $167 level.
>>> FEATURED STOCK ARTICLE : Slump Into Prior Base Negated Recent Breakout - 7/14/2014
View all notes |
Set NEW NOTE alert |
CANSLIM.net Company Profile |
SEC
News |
Chart |
Request a new note
C
A N
S L
I M
|
EQM
-
NYSE
E Q T Midstream Partners
ENERGY - Oil and Gas Pipelines
|
$93.63
|
-1.46
-1.54% |
$94.36
|
227,412
71.74% of 50 DAV
50 DAV is 317,000
|
$102.51
-8.66%
|
12/12/2013
|
$53.17
|
PP = $56.51
|
|
MB = $59.34
|
Most Recent Note - 7/23/2014 4:11:34 PM
G - Still consolidating in an orderly fashion well above its 50 DMA line. Strength has continued despite fundamental flaws repeatedly noted.
>>> FEATURED STOCK ARTICLE : Volume Totals Cooling While Consolidating Near Highs - 7/17/2014
View all notes |
Set NEW NOTE alert |
CANSLIM.net Company Profile |
SEC
News |
Chart |
Request a new note
C
A N
S L
I M
|
Symbol/Exchange
Company Name
Industry Group |
PRICE |
CHANGE
(%Change) |
Day High |
Volume
(% DAV)
(% 50 day avg vol) |
52 Wk Hi
% From Hi |
Featured
Date |
Price
Featured |
Pivot Featured |
|
Max Buy |
FB
-
NASDAQ
Facebook Inc Cl A
INTERNET
|
$74.98
|
+3.69
5.18% |
$76.74
|
122,825,247
279.33% of 50 DAV
50 DAV is 43,972,000
|
$72.59
3.29%
|
7/24/2014
|
$76.00
|
PP = $72.69
|
|
MB = $76.32
|
 Most Recent Note - 7/24/2014 6:19:31 PM
Y - Finished strong after highlighted in yellow with pivot point cited based on its 3/11/14 high plus 10 cents in the earlier mid-day report (read here). The "breakaway gap" with nearly 3 times average volume followed strong earnings news for the Jun '14 quarter and triggered a technical buy signal. See the latest FSU analysis for more details and new annotated graphs.
>>> FEATURED STOCK ARTICLE : Breakaway Gap May Signal Beginning of Meaningful Rally - 7/24/2014
View all notes |
Set NEW NOTE alert |
CANSLIM.net Company Profile |
SEC
News |
Chart |
Request a new note
C
A N
S L
I M
|
GRFS
-
NASDAQ
Grifols Sa Cl B Ads
Medical-Ethical Drugs
|
$42.07
|
+0.28
0.67% |
$42.27
|
349,753
51.97% of 50 DAV
50 DAV is 673,000
|
$46.66
-9.84%
|
5/15/2014
|
$41.14
|
PP = $43.55
|
|
MB = $45.73
|
Most Recent Note - 7/22/2014 7:16:10 PM
G - Encountered resistance at its 50 DMA line, and a rebound above that important short-term average is needed for its outlook to improve. A subsequent violation of its recent low ($39.86 on 7/10/14) would raise more serious concerns and trigger more worrisome sell signals. Faces resistance due to overhead supply up through the $46 area.
>>> FEATURED STOCK ARTICLE : Violation of 50-Day Moving Average Triggered Technical Sell Signal - 7/9/2014
View all notes |
Set NEW NOTE alert |
CANSLIM.net Company Profile |
SEC
News |
Chart |
Request a new note
C
A N
S L
I M
|
HF
-
NYSE
H F F Inc Cl A
REAL ESTATE - Property Management/Developmen
|
$34.94
|
+0.44
1.28% |
$35.07
|
178,909
92.22% of 50 DAV
50 DAV is 194,000
|
$38.23
-8.61%
|
6/20/2014
|
$34.60
|
PP = $36.16
|
|
MB = $37.97
|
Most Recent Note - 7/23/2014 4:17:02 PM
Y - Still testing support at its 50 DMA line ($34.21) and recent lows ($33.91 on 7/18/14) where further deterioration would raise greater concerns.
>>> FEATURED STOCK ARTICLE : Slump Into Prior Base Negated Recent Breakout - 7/15/2014
View all notes |
Set NEW NOTE alert |
CANSLIM.net Company Profile |
SEC
News |
Chart |
Request a new note
C
A N
S L
I M
|
ICON
-
NASDAQ
Iconix Brand Group Inc
CONSUMER NON-DURABLES - Textile - Apparel Footwear
|
$42.66
|
+0.12
0.28% |
$43.38
|
270,295
56.31% of 50 DAV
50 DAV is 480,000
|
$44.81
-4.80%
|
6/5/2014
|
$43.54
|
PP = $43.44
|
|
MB = $45.61
|
Most Recent Note - 7/23/2014 4:25:27 PM
G - Up today with heavy volume, rising to its 50 DMA line. Faces some additional resistance due to overhead supply up through the $44 level.
>>> FEATURED STOCK ARTICLE : Slump Below 50-Day Moving Average Line Hurt Outlook - 7/11/2014
View all notes |
Set NEW NOTE alert |
CANSLIM.net Company Profile |
SEC
News |
Chart |
Request a new note
C
A N
S L
I M
|
PANW
-
NYSE
Palo Alto Networks
Computer Sftwr-Security
|
$84.13
|
+2.64
3.24% |
$84.32
|
1,977,533
110.91% of 50 DAV
50 DAV is 1,783,000
|
$85.78
-1.92%
|
5/29/2014
|
$75.95
|
PP = $72.50
|
|
MB = $76.13
|
Most Recent Note - 7/24/2014 6:22:59 PM
G - Finished at a best-ever close and near the session higher with today's gain on higher volume. Its 50 DMA line and prior highs define important support where subsequent violations would raise serious concerns and trigger technical sell signals.
>>> FEATURED STOCK ARTICLE : Found Support Above 50-Day Average Near Prior Highs - 7/22/2014
View all notes |
Set NEW NOTE alert |
CANSLIM.net Company Profile |
SEC
News |
Chart |
Request a new note
C
A N
S L
I M
|
Symbol/Exchange
Company Name
Industry Group |
PRICE |
CHANGE
(%Change) |
Day High |
Volume
(% DAV)
(% 50 day avg vol) |
52 Wk Hi
% From Hi |
Featured
Date |
Price
Featured |
Pivot Featured |
|
Max Buy |
TARO
-
NYSE
Taro Pharmaceutical Inds
DRUGS - Drug Manufacturers - Other
|
$144.71
|
-1.09
-0.75% |
$146.99
|
35,328
51.20% of 50 DAV
50 DAV is 69,000
|
$149.89
-3.46%
|
6/26/2014
|
$117.31
|
PP = $118.90
|
|
MB = $124.85
|
Most Recent Note - 7/23/2014 4:27:29 PM
G - Stubbornly holding its ground after tallying big gains following its recent breakout, an encouraging sign. Disciplined investors avoid chasing stocks more than +5% above prior highs.
>>> FEATURED STOCK ARTICLE : Big Gains in First 2-3 Weeks After Breakout an Encouraging Sign - 7/18/2014
View all notes |
Set NEW NOTE alert |
CANSLIM.net Company Profile |
SEC
News |
Chart |
Request a new note
C
A N
S L
I M
|
TRN
-
NYSE
Trinity Industries Inc
TRANSPORTATION - Railroads
|
$45.48
|
+0.36
0.80% |
$45.72
|
2,408,899
79.53% of 50 DAV
50 DAV is 3,029,000
|
$46.29
-1.75%
|
4/30/2014
|
$37.79
|
PP = $38.03
|
|
MB = $39.93
|
Most Recent Note - 7/23/2014 4:31:08 PM
G - Touched a new 52-week high today then erased most of its gain to close near the session low. It is extended from its prior base. Its 50 DMA line defines important near-term support to watch.
>>> FEATURED STOCK ARTICLE : Bullish Up/Down Volume and Increasing Institutional Ownership - 7/8/2014
View all notes |
Set NEW NOTE alert |
CANSLIM.net Company Profile |
SEC
News |
Chart |
Request a new note
C
A N
S L
I M
|
UA
-
NYSE
Under Armour Inc Cl A
CONSUMER NON-DURABLES - Textile - Apparel Clothing
|
$69.55
|
+8.92
14.71% |
$70.25
|
12,536,556
501.46% of 50 DAV
50 DAV is 2,500,000
|
$62.40
11.47%
|
7/10/2014
|
$58.50
|
PP = $60.79
|
|
MB = $63.83
|
Most Recent Note - 7/24/2014 6:14:23 PM
Y - Reported Jun '14 quarterly results and raised guidance. Hit a new 52-week high with today's "breakaway gap" and 5th consecutive gain on heavy volume, rallying from the previously noted "cup-with-handle" base. A breakaway gap is the one noted exception where investors may chase a stock more than +5% above prior highs, however risk increases.
>>> FEATURED STOCK ARTICLE : Forming Handle on Cup-With-Handle Base Pattern - 7/10/2014
View all notes |
Set NEW NOTE alert |
CANSLIM.net Company Profile |
SEC
News |
Chart |
Request a new note
C
A N
S L
I M
|
WLK
-
NYSE
Westlake Chemical Corp
CHEMICALS - Specialty Chemicals
|
$89.78
|
+0.10
0.11% |
$90.00
|
586,596
106.46% of 50 DAV
50 DAV is 551,000
|
$89.75
0.03%
|
4/29/2014
|
$72.79
|
PP = $69.31
|
|
MB = $72.78
|
Most Recent Note - 7/21/2014 6:21:09 PM
G - Hit another new 52-week high with today's 4th consecutive gain, getting more extended from any sound base pattern. Its 50 DMA line ($81.60) defines important near-term support to watch on pullbacks.
>>> FEATURED STOCK ARTICLE : Great Ranks and Reassuring Leadership in Chemical Group - 7/7/2014
View all notes |
Set NEW NOTE alert |
CANSLIM.net Company Profile |
SEC
News |
Chart |
Request a new note
C
A N
S L
I M
|
|
|
|
THESE ARE NOT BUY RECOMMENDATIONS!
Comments contained in the body of this report are technical
opinions only. The material herein has been obtained
from sources believed to be reliable and accurate, however,
its accuracy and completeness cannot be guaranteed.
This site is not an investment advisor, hence it does
not endorse or recommend any securities or other investments.
Any recommendation contained in this report may not
be suitable for all investors and it is not to be deemed
an offer or solicitation on our part with respect to
the purchase or sale of any securities. All trademarks,
service marks and trade names appearing in this report
are the property of their respective owners, and are
likewise used for identification purposes only.
This report is a service available
only to active Paid Premium Members.
You may opt-out of receiving report notifications
at any time. Questions or comments may be submitted
by writing to Premium Membership Services 665 S.E. 10 Street, Suite 201 Deerfield Beach, FL 33441-5634 or by calling 1-800-965-8307
or 954-785-1121.
|
|
|

