You are not logged in.
This means you
CAN ONLY VIEW reports that were published prior to Thursday, April 17, 2025.
You
MUST UPGRADE YOUR MEMBERSHIP if you want to see any current reports.
AFTER MARKET UPDATE - WEDNESDAY, JULY 20TH, 2016
Previous After Market Report Next After Market Report >>>
|
|
|
|
DOW |
+36.02 |
18,595.03 |
+0.19% |
|
Volume |
732,394,770 |
-0% |
|
Volume |
1,699,896,190 |
+11% |
|
NASDAQ |
+53.56 |
5,089.93 |
+1.06% |
|
Advancers |
2,026 |
68% |
|
Advancers |
1,973 |
69% |
|
S&P 500 |
+9.24 |
2,173.02 |
+0.43% |
|
Decliners |
957 |
32% |
|
Decliners |
900 |
31% |
|
Russell 2000 |
+9.30 |
1,209.74 |
+0.77% |
|
52 Wk Highs |
195 |
|
|
52 Wk Highs |
136 |
|
|
S&P 600 |
+4.58 |
741.33 |
+0.62% |
|
52 Wk Lows |
3 |
|
|
52 Wk Lows |
27 |
|
|
 |
Major Averages Rose With Better Leadership
Kenneth J. Gruneisen - Passed the CAN SLIM® Master's Exam
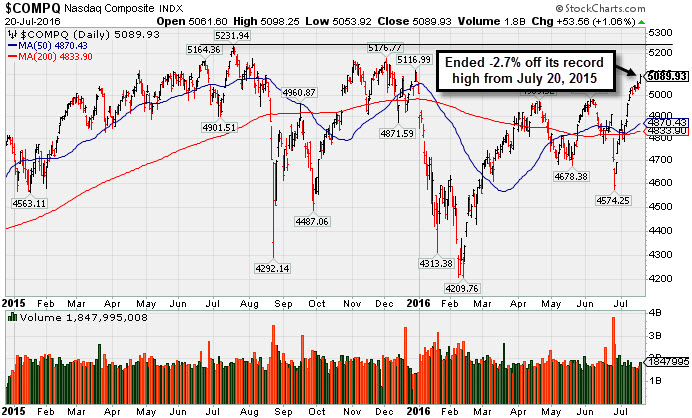
Stocks finished higher on Wednesday. The Dow was up 36 points to 18595. The S&P 500 gained 9 points to 2173 and the Nasdaq Composite added 53 points to 5089. The benchmark S&P 500 Index and the Dow Jones Industrial Average both remain perched at record highs. Big gains for the major indices were noted in prior commentaries and that bullish action signaled a new "confirmed uptrend" for the market (M criteria). Volume totals were slightly lower higher than the prior session on the NYSE and yet higher on the Nasdaq exchange. Breadth was positive as advancers led decliners by a 2-1 margin on the NYSE and on the Nasdaq exchange. There were 58 high-ranked companies from the Leaders List that made new 52-week highs and were listed on the BreakOuts Page, versus the total of 33 on the prior session. New 52-week highs outnumbered new 52-week lows on both the NYSE and the Nasdaq exchange. PICTURED: The Nasdaq Composite Index rallied to within -2.7% of its record high hit July 20, 2015.
The Dow advanced for a ninth session climbing to an all-time high as investors digested optimistic earnings releases. Morgan Stanley (MS +2.09%) rose after its fixed-income trading revenue beat Wall Street estimates. Intuitive Surgical (ISRG +4.64%) profit surged 65 cents above analyst projections and gapped up for a new all-time high. It reported earnings +23% on +14% sales revenues for the Jun '16 quarter. Its quarterly and annual earnings history is not a match with the fact-based investment system's guidelines (C and A criteria). . On the data front, MBA mortgage applications fell 1.3% last week, after rising 7.2% the previous period. Six of 10 sectors in the S&P 500 finished positive on the session with Technology shares rallying to the highest level in almost 16 years. Shares of Microsoft (MSFT +5.31%) gapped up after the software giant reported a 7% jump in cloud-based business. Cintas (CTAS +9.68%) rallied after the uniform maker’s revenue topped forecasts. Abbott Laboratories (ABT +2.03%) advanced after recording a 3.2% rise in quarterly sales. Halliburton (HAL -1.58%) was a notable decliner as quarterly results were hurt by the breakup fee for its failed merger deal with Baker Hughes (BHI -0.07%). Treasuries declined with the benchmark 10-year note down 8/32 to yield 1.58%. In commodities, NYMEX WTI crude added 0.7% to $44.94/barrel. COMEX gold lost 1.3% to $1315.20/ounce. In FOREX, the dollar gained against the yen. |
 Kenneth J. Gruneisen started out as a licensed stockbroker in August 1987, a couple of months prior to the historic stock market crash that took the Dow Jones Industrial Average down -22.6% in a single day. He has published daily fact-based fundamental and technical analysis on high-ranked stocks online for two decades. Through FACTBASEDINVESTING.COM, Kenneth provides educational articles, news, market commentary, and other information regarding proven investment systems that work in good times and bad.
Comments contained in the body of this report are technical opinions only and are not necessarily those of Gruneisen Growth Corp. The material herein has been obtained from sources believed to be reliable and accurate, however, its accuracy and completeness cannot be guaranteed. Our firm, employees, and customers may effect transactions, including transactions contrary to any recommendation herein, or have positions in the securities mentioned herein or options with respect thereto. Any recommendation contained in this report may not be suitable for all investors and it is not to be deemed an offer or solicitation on our part with respect to the purchase or sale of any securities. |
|
 |
Tech, Retail, and Broker/Dealer Indexes Rose
Kenneth J. Gruneisen - Passed the CAN SLIM® Master's Exam
The Retail Index ($RLX +0.67%) and the Broker/Dealer Index ($XBD +0.59%) posted modest gains on Wednesday while the Bank Index ($BKX +0.04%) hugged the flat line. The Biotechnology Index ($BTK +2.57%), Semiconductor Index ($SOX +1.63%) and the Networking Index ($NWX +1.47%) posted unanimous gains. The Gold & Silver Index ($XAU -5.92%) was a standout decliner. The Integrated Oil Index ($XOI -0.04%) and the Oil Services Index ($OSX +0.10%) were little changed. Charts courtesy www.stockcharts.com

PICTURED: The Oil Services Index ($OSX +0.10%) is consolidating above its 50-day and 200-day moving average (DMA) lines.
| Oil Services |
$OSX |
168.17 |
+0.17 |
+0.10% |
+6.62% |
| Integrated Oil |
$XOI |
1,138.93 |
-0.45 |
-0.04% |
+6.17% |
| Semiconductor |
$SOX |
743.74 |
+11.96 |
+1.63% |
+12.10% |
| Networking |
$NWX |
383.53 |
+5.56 |
+1.47% |
+2.02% |
| Broker/Dealer |
$XBD |
160.34 |
+0.95 |
+0.59% |
-9.97% |
| Retail |
$RLX |
1,343.18 |
+8.97 |
+0.67% |
+4.65% |
| Gold & Silver |
$XAU |
100.47 |
-6.33 |
-5.93% |
+121.79% |
| Bank |
$BKX |
67.45 |
+0.02 |
+0.03% |
-7.70% |
| Biotech |
$BTK |
3,208.76 |
+80.39 |
+2.57% |
-15.87% |
|
|
|
 |
Meeting Resistance Near Prior Highs
Kenneth J. Gruneisen - Passed the CAN SLIM® Master's Exam
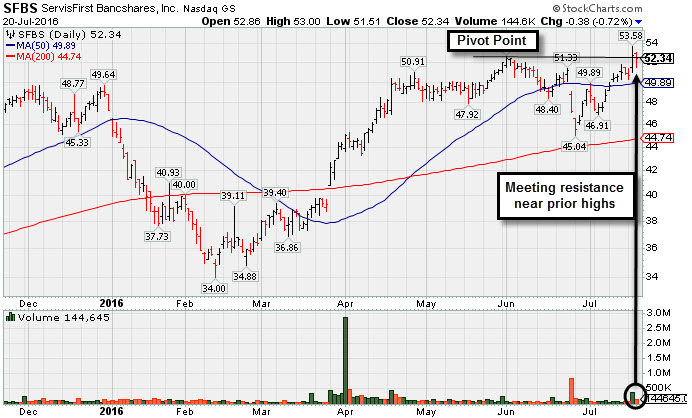
SFBS -$0.38 or -0.72% to $52.34) churned above average volume today without making price progress, a sign of distributional pressure. It finished near its prior high and pivot point with a big volume-driven gain on the prior session after highlighted in yellow with pivot point cited based on the 6/01/16 high plus 10 cents. A volume-driven gain for new highs (N criteria) and a strong close above the pivot point may help clinch a convincing technical buy signal. Without proof of fresh institutional buying demand there is less reason to believe a sustained and meaningful advance in price is likely.
SFBS reported earnings +31% on +17% sales revenues for the Jun '16 quarter, its 3rd consecutive quarterly comparison above the +25% minimum earnings guideline (C criteria), helping it better match the fact-based investment system's guidelines. Earnings rose +28% and +34% in the Dec '15 and Mar '16 quarters, respectively, and underlying sales revenues growth has been in the +17-26% range. Its annual earnings (A criteria) history has been strong.
The number of top-rated funds owning its shares rose from 159 in Sep '15 to 228 in Jun '16, a reassuring sign concerning the I criteria. Its current Up/Down Volume Ratio of 1.4 is an unbiased indication its shares have been under accumulation over the past 50 days. Its small supply of only 23.1 million shares (S criteria) in the public float can contribute to greater price volatility in the event of institutional buying or selling. |
|
|
Color Codes Explained :
Y - Better candidates highlighted by our
staff of experts.
G - Previously featured
in past reports as yellow but may no longer be buyable under the
guidelines.
***Last / Change / Volume data in this table is the closing quote data***
Symbol/Exchange
Company Name
Industry Group |
PRICE |
CHANGE
(%Change) |
Day High |
Volume
(% DAV)
(% 50 day avg vol) |
52 Wk Hi
% From Hi |
Featured
Date |
Price
Featured |
Pivot Featured |
|
Max Buy |
TDG
-
NYSE
Transdigm Group Inc
AEROSPACE/DEFENSE - Aerospace/Defense Products and; Services
|
$274.05
|
-0.17
-0.06% |
$275.73
|
298,192
35.54% of 50 DAV
50 DAV is 839,000
|
$276.14
-0.76%
|
5/11/2016
|
$248.33
|
PP = $245.00
|
|
MB = $257.25
|
Most Recent Note - 7/18/2016 5:43:22 PM
G - Volume totals have been cooling while hovering near all-time highs. Recent lows and its 50 DMA line ($258) define important near-term support to watch on pullbacks.
>>> FEATURED STOCK ARTICLE : Near Highs After Finding Support Above 50-Day Moving Average Line - 7/1/2016 |
View all notes |
Set NEW NOTE alert |
Company Profile |
SEC
News |
Chart |
Request a new note
C
A
S
I |
NTES
-
NASDAQ
Netease Inc Adr
INTERNET - Internet Information Providers
|
$199.05
|
+0.27
0.14% |
$200.00
|
967,775
65.92% of 50 DAV
50 DAV is 1,468,000
|
$202.70
-1.80%
|
6/29/2016
|
$182.42
|
PP = $186.55
|
|
MB = $195.88
|
 Most Recent Note - 7/20/2016 5:52:53 PM
G - Color code is changed to green while trading above its "max buy" level. Disciplined investors avoid chasing stocks more than +5% above the prior high or pivot point. Prior highs near $186 define initial support to watch on pullbacks.
>>> FEATURED STOCK ARTICLE : Perched +5% Above Prior Highs Following Volume-Driven Gains - 7/15/2016 |
View all notes |
Set NEW NOTE alert |
Company Profile |
SEC
News |
Chart |
Request a new note
C
A
S
I |
HTHT
-
NASDAQ
China Lodging Group Ads
LEISURE - Lodging
|
$38.96
|
+0.07
0.18% |
$39.06
|
125,614
48.69% of 50 DAV
50 DAV is 258,000
|
$41.76
-6.70%
|
7/13/2016
|
$38.87
|
PP = $39.29
|
|
MB = $41.25
|
Most Recent Note - 7/20/2016 5:50:55 PM
Y - Volume totals have been cooling while consolidating after hitting a new high on 7/15/16 as its gain backed by +57% above average volume clinched a technical buy signal. Reported earnings increases more than +25% (C criteria) in the past 3 quarterly comparisons through Mar '16. Annual earnings (A criteria) have improved after a downturn in FY '11.
>>> FEATURED STOCK ARTICLE : Negative Reversal After Touching New High - 7/13/2016 |
View all notes |
Set NEW NOTE alert |
Company Profile |
SEC
News |
Chart |
Request a new note
C
A
S
I |
MXL
-
NYSE
Maxlinear Inc Cl A
Telecom-Infrastructure
|
$21.32
|
+0.17
0.80% |
$21.50
|
770,703
67.78% of 50 DAV
50 DAV is 1,137,000
|
$21.22
0.47%
|
5/16/2016
|
$19.24
|
PP = $19.20
|
|
MB = $20.16
|
Most Recent Note - 7/20/2016 5:51:51 PM
G - Hit another new 52-week high with light volume behind today's 3rd consecutive gain, rallying further above its "max buy" level. Recent lows and the 200 DMA line in the $16.70 area define important support to watch on pullbacks.
>>> FEATURED STOCK ARTICLE : Slump Into Prior Base and Below 50-Day Moving Average Raised Concerns - 7/5/2016 |
View all notes |
Set NEW NOTE alert |
Company Profile |
SEC
News |
Chart |
Request a new note
C
A
S
I |
PATK
-
NASDAQ
Patrick Industries Inc
WHOLESALE - Building Materials Wholesale
|
$64.51
|
-0.23
-0.36% |
$65.28
|
109,157
72.77% of 50 DAV
50 DAV is 150,000
|
$68.13
-5.31%
|
5/24/2016
|
$53.45
|
PP = $50.68
|
|
MB = $53.21
|
Most Recent Note - 7/18/2016 5:42:16 PM
G - Stubbornly holding its ground following an impressive spurt of gains into new high territory. Disciplined investors avoid chasing stocks more than +5% above prior highs. Its 50 DMA line ($55.12) defines near-term support to watch on pullbacks.
>>> FEATURED STOCK ARTICLE : Getting Extended From Prior Base After More Volume-Driven Gains - 7/6/2016 |
View all notes |
Set NEW NOTE alert |
Company Profile |
SEC
News |
Chart |
Request a new note
C
A
S
I |
Symbol/Exchange
Company Name
Industry Group |
PRICE |
CHANGE
(%Change) |
Day High |
Volume
(% DAV)
(% 50 day avg vol) |
52 Wk Hi
% From Hi |
Featured
Date |
Price
Featured |
Pivot Featured |
|
Max Buy |
FBHS
-
NYSE
Fortune Brands Hme & Sec
Bldg-Constr Prds/Misc
|
$61.59
|
+0.45
0.74% |
$61.77
|
601,219
33.91% of 50 DAV
50 DAV is 1,773,000
|
$62.17
-0.93%
|
6/22/2016
|
$57.71
|
PP = $60.08
|
|
MB = $63.08
|
Most Recent Note - 7/20/2016 5:47:52 PM
Y - Perched at all-time highs and it wedged higher on light volume today for a best ever close. Quietly hovering at its high following gains lacking above average volume.
>>> FEATURED STOCK ARTICLE : New Highs Lack Important Institutional Volume Punch - 7/11/2016 |
View all notes |
Set NEW NOTE alert |
Company Profile |
SEC
News |
Chart |
Request a new note
C
A
S
I |
NVEE
-
NASDAQ
N V 5 Global Inc
Comml Svcs-Consulting
|
$31.58
|
+0.52
1.67% |
$31.74
|
51,725
41.05% of 50 DAV
50 DAV is 126,000
|
$32.45
-2.68%
|
4/19/2016
|
$28.20
|
PP = $28.10
|
|
MB = $29.51
|
Most Recent Note - 7/19/2016 5:28:08 PM
G - Pulled back today on lighter volume, retreating from new all-time highs after an impressive streak of 10 consecutive gains. Its 50 DMA line ($27.95) and recent lows in the $24-25 area define near-term support to watch. See the latest FSU analysis for more details and an annotated graph.
>>> FEATURED STOCK ARTICLE : Winning Streak Leaves Leader Extended From Prior Base Pattern - 7/18/2016 |
View all notes |
Set NEW NOTE alert |
Company Profile |
SEC
News |
Chart |
Request a new note
C
A
S
I |
SFBS
-
NASDAQ
Servisfirst Bancshares
BANKING - Regional - Southeast Banks
|
$52.34
|
-0.38
-0.72% |
$53.00
|
144,645
123.63% of 50 DAV
50 DAV is 117,000
|
$53.58
-2.31%
|
7/19/2016
|
$53.28
|
PP = $52.82
|
|
MB = $55.46
|
Most Recent Note - 7/20/2016 5:45:30 PM
Y - Churned above average volume today without making price progress, a sign of distributional pressure. Finished near its prior high and pivot point with a big volume-driven gain on the prior session after highlighted in yellow with pivot point cited based on the 6/01/16 high plus 10 cents - "A volume-driven gain and strong close above the pivot point may help clinch a convincing technical buy signal. Reported earnings +31% on +17% sales revenues for the Jun '16 quarter, its 3rd consecutive quarterly comparison above the +25% minimum earnings guideline (C criteria), helping it better match the fact-based investment system's guidelines." See the latest FSU analysis for more details and a new annotated graph.
>>> FEATURED STOCK ARTICLE : Meeting Resistance Near Prior Highs - 7/20/2016 |
View all notes |
Set NEW NOTE alert |
Company Profile |
SEC
News |
Chart |
Request a new note
C
A
S
I |
OLLI
-
NASDAQ
Ollie's Bargain Outlet
Retail-DiscountandVariety
|
$26.04
|
-0.11
-0.42% |
$26.33
|
400,586
43.12% of 50 DAV
50 DAV is 929,000
|
$28.72
-9.33%
|
7/19/2016
|
$26.42
|
PP = $28.82
|
|
MB = $30.26
|
Most Recent Note - 7/19/2016 5:26:37 PM
Y - Highlighted in yellow with pivot point cited based on its 4/28/16 high plus 10 cents. Subsequent volume-driven gains for new highs are needed to trigger a technical buy signal. Consolidating in a tight trading range since it completed another Secondary Offering on 6/06/16. Such offerings often hinder upward price progress for the short term, yet they also help to attract more institutional sponsorship. Prior mid-day reports noted - "Reported earnings +82% on +19% sales revenues for the Apr '16 quarter, continuing its strong earnings track record. Completed a Secondary Offering on 2/18/16, and it completed its $16 IPO on 7/16/15." See the latest FSU analysis for more details and a new annotated graph.
>>> FEATURED STOCK ARTICLE : Retail Firm Approaching Pivot Point - 7/19/2016 |
View all notes |
Set NEW NOTE alert |
Company Profile |
SEC
News |
Chart |
Request a new note
C
A
S
I |
|
|
|
THESE ARE NOT BUY RECOMMENDATIONS!
Comments contained in the body of this report are technical
opinions only. The material herein has been obtained
from sources believed to be reliable and accurate, however,
its accuracy and completeness cannot be guaranteed.
This site is not an investment advisor, hence it does
not endorse or recommend any securities or other investments.
Any recommendation contained in this report may not
be suitable for all investors and it is not to be deemed
an offer or solicitation on our part with respect to
the purchase or sale of any securities. All trademarks,
service marks and trade names appearing in this report
are the property of their respective owners, and are
likewise used for identification purposes only.
This report is a service available
only to active Paid Premium Members.
You may opt-out of receiving report notifications
at any time. Questions or comments may be submitted
by writing to Premium Membership Services 665 S.E. 10 Street, Suite 201 Deerfield Beach, FL 33441-5634 or by calling 1-800-965-8307
or 954-785-1121.
|
|
|