You are not logged in.
This means you
CAN ONLY VIEW reports that were published prior to Sunday, April 6, 2025.
You
MUST UPGRADE YOUR MEMBERSHIP if you want to see any current reports.
AFTER MARKET UPDATE - WEDNESDAY, JULY 6TH, 2016
Previous After Market Report Next After Market Report >>>
|
|
|
|
DOW |
+78.00 |
17,918.62 |
+0.44% |
|
Volume |
1,023,108,550 |
+7% |
|
Volume |
1,692,935,280 |
+10% |
|
NASDAQ |
+36.26 |
4,859.16 |
+0.75% |
|
Advancers |
1,927 |
64% |
|
Advancers |
1,868 |
62% |
|
S&P 500 |
+11.18 |
2,099.73 |
+0.54% |
|
Decliners |
1,072 |
36% |
|
Decliners |
1,155 |
38% |
|
Russell 2000 |
+7.88 |
1,147.33 |
+0.69% |
|
52 Wk Highs |
241 |
|
|
52 Wk Highs |
82 |
|
|
S&P 600 |
+4.25 |
704.31 |
+0.61% |
|
52 Wk Lows |
46 |
|
|
52 Wk Lows |
63 |
|
|
 |
Major Indices Rebounded From Weak Start to End Session Higher
Kenneth J. Gruneisen - Passed the CAN SLIM® Master's Exam
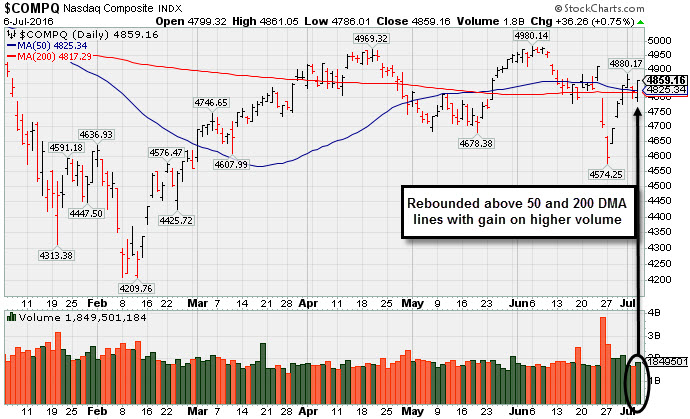
Stocks finished higher on Wednesday. The Dow was up 78 points to 17918. The S&P 500 gained 11 points to 2099 and the Nasdaq Composite added 36 points to 4859. The volume totals were higher than the prior session on the NYSE and on the Nasdaq exchange. Advancers led decliners by nearly a 2-1 margin on the NYSE and by 3-2 on the Nasdaq exchange. There were 51 high-ranked companies from the Leaders List that made new 52-week highs and were listed on the BreakOuts Page, versus the total of 58 on the prior session. New 52-week highs outnumbered new 52-week lows on both the NYSE and the Nasdaq exchange. PICTURED: The Nasdaq Composite Index rebounded above its 50 and 200-day moving average (DMA) lines with a gain backed by higher volume.
Big gains for the major indices and strong closes near each session high last Tuesday, Wednesday, and Thursday effectively put an end to the "correction" noted in prior commentaries. Experts at the newspaper stated that the bullish action signaled a new "confirmed uptrend" for the market (M criteria).
The S&P 500 Index, Dow Jones Industrial Average and Nasdaq Composite Index have unanimously rebounded above their 50-day moving average (DMA) lines following recent damaging losses on much heavy volume. On the Featured Stocks Page a few noteworthy candidates remain, however in recent weeks few have made meaningful headway. The major averages erased a morning retreat amid a rally in Health Care shares and optimistic updates on the economy. The Federal Reserve also released the minutes from its June policy meeting. The release conveyed the central bank’s hesitance to tighten interest rate policy after May’s soft jobs report and the recent international volatility. On the data front, an update the U.S. services sector rose to 51.4 in June, above expectations of a 51.3 reading. In a separate release the ISM’s non-manufacturing index showed the fastest expansion in seven months. Eight of 10 sectors in the S&P 500 advanced on the session. Health Care shares paced the gains as Celgene (CELG +4.38%) rose. In M&A news, Nortek (NTK +38.55%) surged after agreeing to a $2.8 billion takeover offer from Melrose Industries. Walgreens Boots Alliance (WBA -2.36%) fell as the drugstore operator’s revenue fell short of forecasts. Netflix (NFLX -3.38%) fell after being the subject of negative analyst commentary. Treasuries finished mixed with the benchmark 10-year note up 1/32 to yield 1.37%. In commodities, NYMEX WTI crude added 1.4% to $47.25/barrel. COMEX gold was up 0.5% to $1365.90/ounce. In FOREX, the yen gained against the dollar. |
 Kenneth J. Gruneisen started out as a licensed stockbroker in August 1987, a couple of months prior to the historic stock market crash that took the Dow Jones Industrial Average down -22.6% in a single day. He has published daily fact-based fundamental and technical analysis on high-ranked stocks online for two decades. Through FACTBASEDINVESTING.COM, Kenneth provides educational articles, news, market commentary, and other information regarding proven investment systems that work in good times and bad.
Comments contained in the body of this report are technical opinions only and are not necessarily those of Gruneisen Growth Corp. The material herein has been obtained from sources believed to be reliable and accurate, however, its accuracy and completeness cannot be guaranteed. Our firm, employees, and customers may effect transactions, including transactions contrary to any recommendation herein, or have positions in the securities mentioned herein or options with respect thereto. Any recommendation contained in this report may not be suitable for all investors and it is not to be deemed an offer or solicitation on our part with respect to the purchase or sale of any securities. |
|
 |
Financial, Retail, Biotech, and Gold & Silver Indexes Rose
Kenneth J. Gruneisen - Passed the CAN SLIM® Master's Exam
The Broker/Dealer Index ($XBD +0.82%) and the Bank Index ($BKX +0.68%) both edged higher and lifted the major averages on Wednesday. The Retail Index ($RLX +1.10%) gained ground, and the Gold & Silver index ($XAU +3.27%) was a standout gainer. The Biotechnology Index ($BTK +1.86%) outpaced smaller gains from the Networking Index ($NWX +0.54%) and the Semiconductor Index ($SOX +0.15%). Energy-linked shares had a negative bias as the Oil Services Index ($OSX -0.63%) edged lower and the Integrated Oil Index ($XOI -0.03%) finished flat. Charts courtesy www.stockcharts.com
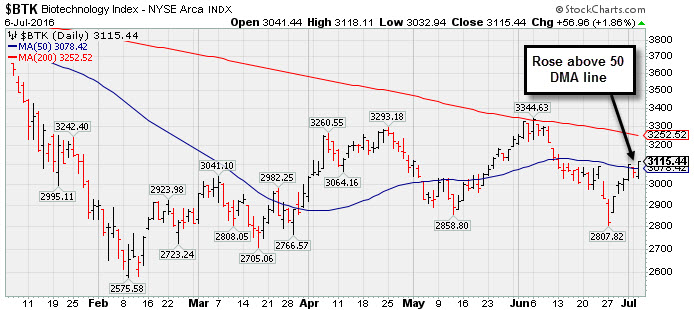
PICTURED: The Biotechnology Index ($BTK +1.86%) rose above its 50-day moving average (DMA) line.
| Oil Services |
$OSX |
163.43 |
-1.04 |
-0.63% |
+3.61% |
| Integrated Oil |
$XOI |
1,130.60 |
-0.34 |
-0.03% |
+5.40% |
| Semiconductor |
$SOX |
673.55 |
+1.04 |
+0.15% |
+1.52% |
| Networking |
$NWX |
358.67 |
+1.93 |
+0.54% |
-4.59% |
| Broker/Dealer |
$XBD |
147.07 |
+1.20 |
+0.82% |
-17.42% |
| Retail |
$RLX |
1,312.59 |
+14.24 |
+1.10% |
+2.27% |
| Gold & Silver |
$XAU |
106.86 |
+3.39 |
+3.28% |
+135.89% |
| Bank |
$BKX |
62.77 |
+0.42 |
+0.67% |
-14.11% |
| Biotech |
$BTK |
3,115.44 |
+56.96 |
+1.86% |
-18.31% |
|
|
|
 |
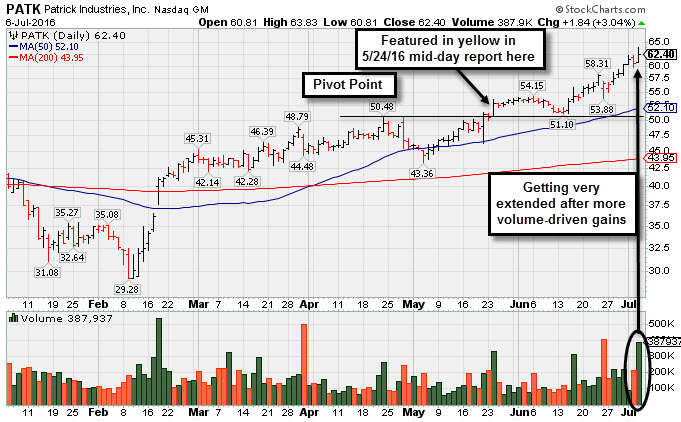
Getting Extended From Prior Base After More Volume-Driven Gains
Kenneth J. Gruneisen - Passed the CAN SLIM® Master's Exam
Patrick Industries Inc (PATK +$1.84 or +3.04% to $62.40) hit another new high with today's volume-driven gains. Rallying with no resistance due to overhead supply, it has been getting very extended from any sound base. Disciplined investors avoid chasing stocks more than +5% above prior highs.
Its 50-day moving average DMA line ($52.10) defines near-term support to watch on pullbacks. It was last shown in this FSU section on 6/16/16 with an annotated graph under the headline, "Extended From Base After Another Volume-Driven Gain". It was first highlighted in yellow with pivot point based on its 4/28/16 high plus 10 cents in the 5/24/16 mid-day report (read here). It finished strong with +132% above average volume as it hit new all-time highs confirming a technical buy signal.
It reported earnings +36% on +25% sales revenues for the Mar '16 quarter, and prior quarters were steadily above the +25% minimum earnings guideline (C criteria). A small downturn in FY '13 was a flaw previously noted in its annual earnings (A criteria) history.
Its current Up/Down Volume ratio of 1.2 is an unbiased indication that its shares were under accumulation over the past 50 days. The number of top-rated funds owning its share rose from 218 in Jun '15 to 254 in Jun '16, a reassuring trend concerning the I criteria. Its small supply of 14.2 million shares (S criteria) in the public float can contribute to greater price volatility in the event of institutional buying or selling. |
|
|
Color Codes Explained :
Y - Better candidates highlighted by our
staff of experts.
G - Previously featured
in past reports as yellow but may no longer be buyable under the
guidelines.
***Last / Change / Volume data in this table is the closing quote data***
Symbol/Exchange
Company Name
Industry Group |
PRICE |
CHANGE
(%Change) |
Day High |
Volume
(% DAV)
(% 50 day avg vol) |
52 Wk Hi
% From Hi |
Featured
Date |
Price
Featured |
Pivot Featured |
|
Max Buy |
TDG
-
NYSE
Transdigm Group Inc
AEROSPACE/DEFENSE - Aerospace/Defense Products and; Services
|
$262.32
|
+2.51
0.97% |
$262.71
|
273,740
31.50% of 50 DAV
50 DAV is 869,000
|
$268.00
-2.12%
|
5/11/2016
|
$248.33
|
PP = $245.00
|
|
MB = $257.25
|
 Most Recent Note - 7/6/2016 5:11:24 PM
G - Recent lows and its 50 DMA line ($251.84) define important near-term support to watch on pullbacks. See the latest FSU analysis for more details and an annotated graph.
>>> FEATURED STOCK ARTICLE : Near Highs After Finding Support Above 50-Day Moving Average Line - 7/1/2016 |
View all notes |
Set NEW NOTE alert |
Company Profile |
SEC
News |
Chart |
Request a new note
C
A
S
I |
NTES
-
NASDAQ
Netease Inc Adr
INTERNET - Internet Information Providers
|
$186.12
|
-0.72
-0.39% |
$188.48
|
1,633,238
117.92% of 50 DAV
50 DAV is 1,385,000
|
$193.44
-3.78%
|
6/29/2016
|
$182.42
|
PP = $186.55
|
|
MB = $195.88
|
Most Recent Note - 7/6/2016 5:09:10 PM
Y - Consolidating near prior highs after triggering a technical buy signal with a volume-driven gain on 6/30/16. Highlighted in yellow with pivot point cited based on its 12/29/15 high plus 10 cents in the 6/29/16 mid-day report (read here).
>>> FEATURED STOCK ARTICLE : Rallying Within Striking Distance of Highs - 6/29/2016 |
View all notes |
Set NEW NOTE alert |
Company Profile |
SEC
News |
Chart |
Request a new note
C
A
S
I |
MXL
-
NYSE
Maxlinear Inc Cl A
Telecom-Infrastructure
|
$17.81
|
+0.21
1.19% |
$17.92
|
842,510
75.29% of 50 DAV
50 DAV is 1,119,000
|
$20.98
-15.10%
|
5/16/2016
|
$19.24
|
PP = $19.20
|
|
MB = $20.16
|
Most Recent Note - 7/5/2016 5:36:02 PM
G - The 200 DMA line and prior lows in the $15-16 area define the next important support area. See the latest FSU analysis for more details and a new annotated graph.
>>> FEATURED STOCK ARTICLE : Slump Into Prior Base and Below 50-Day Moving Average Raised Concerns - 7/5/2016 |
View all notes |
Set NEW NOTE alert |
Company Profile |
SEC
News |
Chart |
Request a new note
C
A
S
I |
PATK
-
NASDAQ
Patrick Industries Inc
WHOLESALE - Building Materials Wholesale
|
$62.40
|
+1.84
3.04% |
$63.83
|
387,937
269.40% of 50 DAV
50 DAV is 144,000
|
$62.27
0.22%
|
5/24/2016
|
$53.45
|
PP = $50.68
|
|
MB = $53.21
|
Most Recent Note - 7/6/2016 12:32:33 PM
G - Hitting another new high today, getting more extended from any sound base following volume-driven gains. Disciplined investors avoid chasing stocks more than +5% above prior highs. Its 50 DMA line ($52.12) defines near-term support to watch on pullbacks.
>>> FEATURED STOCK ARTICLE : Getting Extended From Prior Base After More Volume-Driven Gains - 7/6/2016 |
View all notes |
Set NEW NOTE alert |
Company Profile |
SEC
News |
Chart |
Request a new note
C
A
S
I |
FBHS
-
NYSE
Fortune Brands Hme & Sec
Bldg-Constr Prds/Misc
|
$58.59
|
+0.83
1.44% |
$58.68
|
1,149,116
66.38% of 50 DAV
50 DAV is 1,731,000
|
$59.98
-2.32%
|
6/22/2016
|
$57.71
|
PP = $60.08
|
|
MB = $63.08
|
Most Recent Note - 7/5/2016 5:38:20 PM
Y - Consolidating after a quiet rebound above its 50 DMA line ($57.03) helped its outlook to improve. Members were repeatedly reminded since first featured in the 6/22/16 mid-day report - "It needs subsequent volume-driven gains above the pivot point to trigger a technical buy signal."
>>> FEATURED STOCK ARTICLE : Wait Continues for Technical Breakout - 6/22/2016 |
View all notes |
Set NEW NOTE alert |
Company Profile |
SEC
News |
Chart |
Request a new note
C
A
S
I |
Symbol/Exchange
Company Name
Industry Group |
PRICE |
CHANGE
(%Change) |
Day High |
Volume
(% DAV)
(% 50 day avg vol) |
52 Wk Hi
% From Hi |
Featured
Date |
Price
Featured |
Pivot Featured |
|
Max Buy |
NVEE
-
NASDAQ
N V 5 Global Inc
Comml Svcs-Consulting
|
$27.36
|
+0.37
1.37% |
$27.58
|
41,247
34.37% of 50 DAV
50 DAV is 120,000
|
$30.21
-9.43%
|
4/19/2016
|
$28.20
|
PP = $28.10
|
|
MB = $29.51
|
Most Recent Note - 7/6/2016 5:10:23 PM
Y - Color code is changed to yellow after quietly rebounding above its 50 DMA line ($27.15). Faces a little resistance due to overhead supply. Recent lows in the $24 area define the next important support to watch.
>>> FEATURED STOCK ARTICLE : Perched Near Highs After Rebound Above 50-Day Average - 6/30/2016 |
View all notes |
Set NEW NOTE alert |
Company Profile |
SEC
News |
Chart |
Request a new note
C
A
S
I |
|
|
|
THESE ARE NOT BUY RECOMMENDATIONS!
Comments contained in the body of this report are technical
opinions only. The material herein has been obtained
from sources believed to be reliable and accurate, however,
its accuracy and completeness cannot be guaranteed.
This site is not an investment advisor, hence it does
not endorse or recommend any securities or other investments.
Any recommendation contained in this report may not
be suitable for all investors and it is not to be deemed
an offer or solicitation on our part with respect to
the purchase or sale of any securities. All trademarks,
service marks and trade names appearing in this report
are the property of their respective owners, and are
likewise used for identification purposes only.
This report is a service available
only to active Paid Premium Members.
You may opt-out of receiving report notifications
at any time. Questions or comments may be submitted
by writing to Premium Membership Services 665 S.E. 10 Street, Suite 201 Deerfield Beach, FL 33441-5634 or by calling 1-800-965-8307
or 954-785-1121.
|
|
|