You are not logged in.
This means you
CAN ONLY VIEW reports that were published prior to Sunday, April 6, 2025.
You
MUST UPGRADE YOUR MEMBERSHIP if you want to see any current reports.
AFTER MARKET UPDATE - TUESDAY, JULY 5TH, 2016
Previous After Market Report Next After Market Report >>>
|
|
|
|
DOW |
-108.75 |
17,840.62 |
-0.61% |
|
Volume |
955,412,390 |
+15% |
|
Volume |
1,543,480,300 |
-3% |
|
NASDAQ |
-39.67 |
4,822.90 |
-0.82% |
|
Advancers |
809 |
27% |
|
Advancers |
779 |
25% |
|
S&P 500 |
-14.40 |
2,088.55 |
-0.68% |
|
Decliners |
2,235 |
73% |
|
Decliners |
2,277 |
74% |
|
Russell 2000 |
-17.32 |
1,139.45 |
-1.50% |
|
52 Wk Highs |
411 |
|
|
52 Wk Highs |
101 |
|
|
S&P 600 |
-10.11 |
700.06 |
-1.42% |
|
52 Wk Lows |
8 |
|
|
52 Wk Lows |
34 |
|
|
 |
Less Leadership While Major Indices Fell
Kenneth J. Gruneisen - Passed the CAN SLIM® Master's Exam
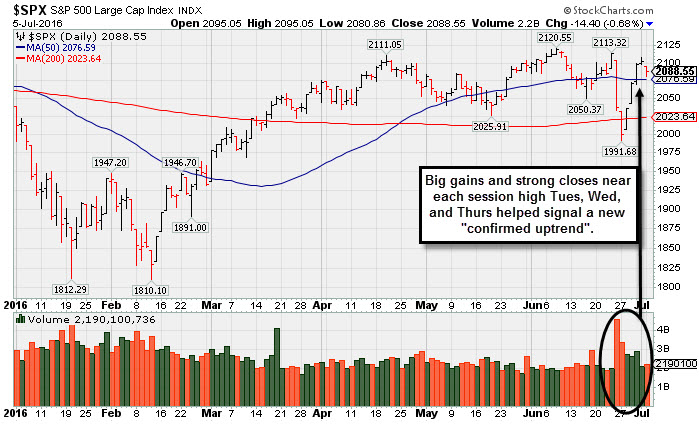
Stocks finished lower on Tuesday. The Dow was down 108 points to 17840. The S&P 500 lost 14 points to 2088 and the Nasdaq Composite fell 39 points to 4822. Behind the losses the volume totals were mixed, higher than the prior session on the NYSE and lower on the Nasdaq exchange. Decliners led advancers by more than a 2-1 margin on the NYSE and by nearly 3-1 on the Nasdaq exchange. There were 58 high-ranked companies from the Leaders List that made new 52-week highs and were listed on the BreakOuts Page, versus the total of 91 on the prior session. New 52-week highs solidly outnumbered new 52-week lows on both the NYSE and the Nasdaq exchange. PICTURED: The S&P 500 Index found prompt support near its 200-day moving average (DMA) line and quickly rebounded near prior resistance. The big gains and strong closes near each session high last Tuesday, Wednesday, and Thursday effectively put an end to the "correction" noted in prior commentaries. Experts at the newspaper stated that the bullish action signaled a new "confirmed uptrend" for the market (M criteria).
The S&P 500 Index, Dow Jones Industrial Average and Nasdaq Composite Index have unanimously rebounded above their 50-day moving average (DMA) lines following recent damaging losses on much heavy volume. On the Featured Stocks Page a few noteworthy candidates remain, however in recent weeks few have made meaningful headway. The S&P 500 snapped a four-day winning streak as investors appeared cautious amid global economic uncertainty. In commodities, crude oil retreated while the yen climbed as a perceived “risk off” trade took hold in the markets. On the data front, durable goods orders fell 2.3% in May, in-line with analysts estimates. A separate release revealed factory orders contracted 1% in May, after a 1.9% increase the previous month. Eight of 10 sectors in the S&P 500 finished lower on the session. Energy shares and Materials were the worst performing groups while Utilities advanced. Southwestern Energy (SWN -10.38%) fell as oil prices declined. Shares of Tesla Motors (TSLA -1.2%) fell as the electric car maker reported second-quarter vehicle deliveries were lower-than-expected. Harley-Davidson (HOG -10.84%) fell after being the subject of negative analyst commentary. Medivation (MDVN +2.73%) was a notable gainer amid takeover speculation. Treasuries finished higher with the benchmark 10-year note up 22/32 to yield 1.36%, an all-time low. In commodities, NYMEX WTI crude retreated 4.4% to $46.82/barrel. COMEX gold gained 1.4% to $1358.10/ounce. In FOREX, the British pound tumbled 2%, to its lowest level against the dollar since 1985. |
 Kenneth J. Gruneisen started out as a licensed stockbroker in August 1987, a couple of months prior to the historic stock market crash that took the Dow Jones Industrial Average down -22.6% in a single day. He has published daily fact-based fundamental and technical analysis on high-ranked stocks online for two decades. Through FACTBASEDINVESTING.COM, Kenneth provides educational articles, news, market commentary, and other information regarding proven investment systems that work in good times and bad.
Comments contained in the body of this report are technical opinions only and are not necessarily those of Gruneisen Growth Corp. The material herein has been obtained from sources believed to be reliable and accurate, however, its accuracy and completeness cannot be guaranteed. Our firm, employees, and customers may effect transactions, including transactions contrary to any recommendation herein, or have positions in the securities mentioned herein or options with respect thereto. Any recommendation contained in this report may not be suitable for all investors and it is not to be deemed an offer or solicitation on our part with respect to the purchase or sale of any securities. |
|
 |
Gold & Silver Index Rose and Retail Index Held its Ground While Most Groups Fell
Kenneth J. Gruneisen - Passed the CAN SLIM® Master's Exam
The Broker/Dealer Index ($XBD -2.54%) and the Bank Index ($BKX -2.90%) both slumped and weighed on the major averages on Tuesday. The Biotechnology Index ($BTK -1.34%), Networking Index ($NWX -1.22%) and the Semiconductor Index ($SOX -1.82%) ended unanimously lower. Energy-linked shares also had a negative bias as the Oil Services Index ($OSX -4.39%) and the Integrated Oil Index ($XOI -2.13%) both fell. The Retail Index ($RLX -0.15%) did a fairly good job of holding its ground on the mostly weaker session, and the Gold & Silver index ($XAU +0.95%) was a standout gainer. Charts courtesy www.stockcharts.com
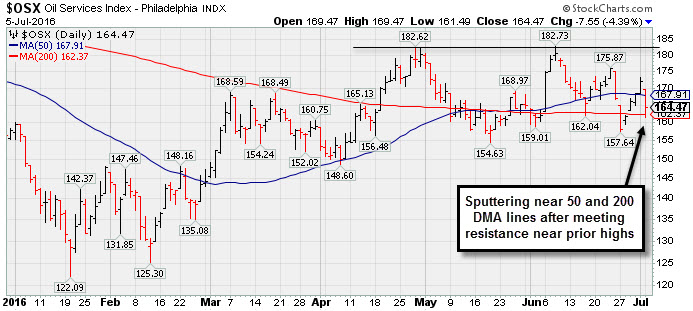
PICTURED: The Oil Services Index ($OSX -4.39%) is sputtering near its 50-day and 200-day moving average (DMA) lines after meeting resistance near prior highs. .
| Oil Services |
$OSX |
164.47 |
-7.55 |
-4.39% |
+4.27% |
| Integrated Oil |
$XOI |
1,130.94 |
-24.65 |
-2.13% |
+5.43% |
| Semiconductor |
$SOX |
672.51 |
-12.50 |
-1.82% |
+1.36% |
| Networking |
$NWX |
356.74 |
-4.40 |
-1.22% |
-5.11% |
| Broker/Dealer |
$XBD |
145.87 |
-3.80 |
-2.54% |
-18.09% |
| Retail |
$RLX |
1,298.35 |
-1.95 |
-0.15% |
+1.16% |
| Gold & Silver |
$XAU |
103.47 |
+0.97 |
+0.95% |
+128.41% |
| Bank |
$BKX |
62.34 |
-1.86 |
-2.90% |
-14.70% |
| Biotech |
$BTK |
3,059.42 |
-40.47 |
-1.31% |
-19.78% |
|
|
|
 |
Slump Into Prior Base and Below 50-Day Moving Average Raised Concerns
Kenneth J. Gruneisen - Passed the CAN SLIM® Master's Exam
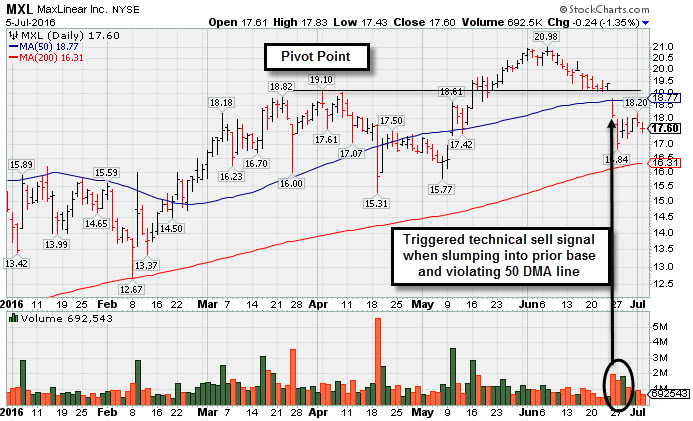
Maxlinear Inc (MXL -$0.24 or -1.35% to $17.60) remains below its 50-day moving average (DMA) line. Volume-driven losses leading to a slump into the prior base and a violation of the 50 DMA line recently triggered a technical sell signal. Only a rebound above the 50 DMA line would help its near-term outlook improve, Meanwhile, the 200 DMA line and prior lows in the $15-16 area define the next important support area. It was last shown in the FSU section on 6/02/16 with an annotated graph under the headline, "Extended From Latest Base After Recently Wedging Higher".
There was a powerful gap up on 5/10/16 for a considerable volume-driven gain after it reported strong earnings +422% on +190% sales revenues for the Mar '16 quarter versus the year ago period. The gain helped it rebound above its 50-day moving average (DMA) line. Members were reminded - "Remember that any stock that was previously sold can be bought again when strength returns."MXL was first highlighted in yellow with pivot point cited based on its 1/13/16 high in the 2/26/16 mid-day report (read here). It ended up breaking out convincingly with a subsequent streak of gains on above average volume, clearing the previously noted a "double bottom" base and triggering a technical buy signal. The high-ranked Semiconductor firm saw sales revenues increases of +99%, +193%, and +205% for the Jun, Sep, and Dec '15 quarters, respectively, versus the year ago periods as earnings rose +62%, +900%, and +820%. The 3 strong quarterly comparisons above the +25% minimum guideline (C criteria) were noted in the 2/09/16 mid-day report - "Helping it better match the fact-based investment system's guidelines." Its small supply of only 52.4 million shares in the public float (S criteria) may contribute to greater price volatility in the event of institutional buying or selling. The number of top-rated funds owning its shares rose from 175 in Mar '15 to 296 in Mar '16, a very reassuring sign (I criteria). It currently has a Timeliness rating of B, and a Sponsorship Rating of D. |
|
|
Color Codes Explained :
Y - Better candidates highlighted by our
staff of experts.
G - Previously featured
in past reports as yellow but may no longer be buyable under the
guidelines.
***Last / Change / Volume data in this table is the closing quote data***
Symbol/Exchange
Company Name
Industry Group |
PRICE |
CHANGE
(%Change) |
Day High |
Volume
(% DAV)
(% 50 day avg vol) |
52 Wk Hi
% From Hi |
Featured
Date |
Price
Featured |
Pivot Featured |
|
Max Buy |
TDG
-
NYSE
Transdigm Group Inc
AEROSPACE/DEFENSE - Aerospace/Defense Products and; Services
|
$259.81
|
-2.91
-1.11% |
$262.00
|
609,567
70.39% of 50 DAV
50 DAV is 866,000
|
$268.00
-3.06%
|
5/11/2016
|
$248.33
|
PP = $245.00
|
|
MB = $257.25
|
Most Recent Note - 7/1/2016 4:39:21 PM
G - Recent lows and its 50 DMA line ($250.42) define near-term support to watch on pullbacks. See the latest FSU analysis for more details and a new annotated graph.
>>> FEATURED STOCK ARTICLE : Near Highs After Finding Support Above 50-Day Moving Average Line - 7/1/2016 |
View all notes |
Set NEW NOTE alert |
Company Profile |
SEC
News |
Chart |
Request a new note
C
A
S
I |
NTES
-
NASDAQ
Netease Inc Adr
INTERNET - Internet Information Providers
|
$186.84
|
+2.27
1.23% |
$190.00
|
1,610,293
117.37% of 50 DAV
50 DAV is 1,372,000
|
$193.44
-3.41%
|
6/29/2016
|
$182.42
|
PP = $186.55
|
|
MB = $195.88
|
Most Recent Note - 7/1/2016 4:44:44 PM
Y - Reversed into the red after touching a new 52-week high today, ending near the session low with a loss on above average volume. Triggered a technical buy signal on the prior session after highlighted in yellow with pivot point cited based on its 12/29/15 high plus 10 cents in the 6/29/16 mid-day report (read here). Reported earnings +79% on +108% sales revenues for the Mar '16 quarter, marking its 3rd consecutive quarter with earnings above the +25% minimum guideline (C criteria). See the latest FSU analysis for more details and an annotated graph.
>>> FEATURED STOCK ARTICLE : Rallying Within Striking Distance of Highs - 6/29/2016 |
View all notes |
Set NEW NOTE alert |
Company Profile |
SEC
News |
Chart |
Request a new note
C
A
S
I |
MXL
-
NYSE
Maxlinear Inc Cl A
Telecom-Infrastructure
|
$17.60
|
-0.24
-1.35% |
$17.83
|
692,543
61.50% of 50 DAV
50 DAV is 1,126,000
|
$20.98
-16.10%
|
5/16/2016
|
$19.24
|
PP = $19.20
|
|
MB = $20.16
|
 Most Recent Note - 7/5/2016 5:36:02 PM
G - The 200 DMA line and prior lows in the $15-16 area define the next important support area. See the latest FSU analysis for more details and a new annotated graph.
>>> FEATURED STOCK ARTICLE : Slump Into Prior Base and Below 50-Day Moving Average Raised Concerns - 7/5/2016 |
View all notes |
Set NEW NOTE alert |
Company Profile |
SEC
News |
Chart |
Request a new note
C
A
S
I |
PATK
-
NASDAQ
Patrick Industries Inc
WHOLESALE - Building Materials Wholesale
|
$60.56
|
-0.94
-1.53% |
$62.27
|
212,660
145.66% of 50 DAV
50 DAV is 146,000
|
$62.18
-2.61%
|
5/24/2016
|
$53.45
|
PP = $50.68
|
|
MB = $53.21
|
Most Recent Note - 7/5/2016 12:36:43 PM
G - Extended from any sound base following volume-driven gains. Disciplined investors avoid chasing stocks more than +5% above prior highs. Its 50 DMA line ($51.80) defines near-term support to watch on pullbacks.
>>> FEATURED STOCK ARTICLE : Extended From Base After Another Volume-Driven Gain - 6/16/2016 |
View all notes |
Set NEW NOTE alert |
Company Profile |
SEC
News |
Chart |
Request a new note
C
A
S
I |
FBHS
-
NYSE
Fortune Brands Hme & Sec
Bldg-Constr Prds/Misc
|
$57.76
|
-0.34
-0.59% |
$58.00
|
1,188,810
68.20% of 50 DAV
50 DAV is 1,743,000
|
$59.98
-3.70%
|
6/22/2016
|
$57.71
|
PP = $60.08
|
|
MB = $63.08
|
Most Recent Note - 7/5/2016 5:38:20 PM
Y - Consolidating after a quiet rebound above its 50 DMA line ($57.03) helped its outlook to improve. Members were repeatedly reminded since first featured in the 6/22/16 mid-day report - "It needs subsequent volume-driven gains above the pivot point to trigger a technical buy signal."
>>> FEATURED STOCK ARTICLE : Wait Continues for Technical Breakout - 6/22/2016 |
View all notes |
Set NEW NOTE alert |
Company Profile |
SEC
News |
Chart |
Request a new note
C
A
S
I |
Symbol/Exchange
Company Name
Industry Group |
PRICE |
CHANGE
(%Change) |
Day High |
Volume
(% DAV)
(% 50 day avg vol) |
52 Wk Hi
% From Hi |
Featured
Date |
Price
Featured |
Pivot Featured |
|
Max Buy |
NVEE
-
NASDAQ
N V 5 Global Inc
Comml Svcs-Consulting
|
$26.99
|
+0.33
1.24% |
$27.11
|
61,815
51.09% of 50 DAV
50 DAV is 121,000
|
$30.21
-10.66%
|
4/19/2016
|
$28.20
|
PP = $28.10
|
|
MB = $29.51
|
Most Recent Note - 7/1/2016 4:45:49 PM
G - Color code is changed to green after slumping back below its 50 DMA line. Faces a little resistance due to overhead supply. Recent lows in the $24 area define the next important support to watch.
>>> FEATURED STOCK ARTICLE : Perched Near Highs After Rebound Above 50-Day Average - 6/30/2016 |
View all notes |
Set NEW NOTE alert |
Company Profile |
SEC
News |
Chart |
Request a new note
C
A
S
I |
|
|
|
THESE ARE NOT BUY RECOMMENDATIONS!
Comments contained in the body of this report are technical
opinions only. The material herein has been obtained
from sources believed to be reliable and accurate, however,
its accuracy and completeness cannot be guaranteed.
This site is not an investment advisor, hence it does
not endorse or recommend any securities or other investments.
Any recommendation contained in this report may not
be suitable for all investors and it is not to be deemed
an offer or solicitation on our part with respect to
the purchase or sale of any securities. All trademarks,
service marks and trade names appearing in this report
are the property of their respective owners, and are
likewise used for identification purposes only.
This report is a service available
only to active Paid Premium Members.
You may opt-out of receiving report notifications
at any time. Questions or comments may be submitted
by writing to Premium Membership Services 665 S.E. 10 Street, Suite 201 Deerfield Beach, FL 33441-5634 or by calling 1-800-965-8307
or 954-785-1121.
|
|
|