You are not logged in.
This means you
CAN ONLY VIEW reports that were published prior to Thursday, April 17, 2025.
You
MUST UPGRADE YOUR MEMBERSHIP if you want to see any current reports.
AFTER MARKET UPDATE - MONDAY, JULY 18TH, 2016
Previous After Market Report Next After Market Report >>>
|
|
|
|
DOW |
+16.50 |
18,533.05 |
+0.09% |
|
Volume |
722,281,850 |
-15% |
|
Volume |
1,432,107,300 |
-3% |
|
NASDAQ |
+26.19 |
5,055.78 |
+0.52% |
|
Advancers |
1,886 |
63% |
|
Advancers |
1,592 |
56% |
|
S&P 500 |
+5.15 |
2,166.89 |
+0.24% |
|
Decliners |
1,104 |
37% |
|
Decliners |
1,265 |
44% |
|
Russell 2000 |
+2.60 |
1,207.91 |
+0.22% |
|
52 Wk Highs |
183 |
|
|
52 Wk Highs |
130 |
|
|
S&P 600 |
+0.59 |
741.31 |
+0.08% |
|
52 Wk Lows |
4 |
|
|
52 Wk Lows |
22 |
|
|
 |
Major Averages Edged Higher Again
Kenneth J. Gruneisen - Passed the CAN SLIM® Master's Exam
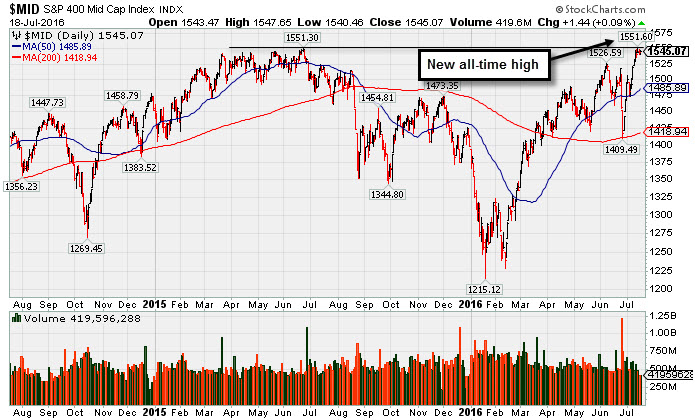
Stocks finished higher on Monday. The Dow was up 16 points to 18533. The S&P 500 gained 5 points to 2166 and the Nasdaq Composite added 26 points to 5055. The benchmark S&P 500 Index and the Dow Jones Industrial Average both remain perched at record highs. Big gains for the major indices were noted in prior commentaries and that bullish action signaled a new "confirmed uptrend" for the market (M criteria). Volume totals were lighter than the prior session on the NYSE but lower on the Nasdaq exchange. Advancers led decliners by a 3-2 margin on the NYSE and 4-3 on the Nasdaq exchange. There were 37 high-ranked companies from the Leaders List that made new 52-week highs and were listed on the BreakOuts Page, versus the total of 30 on the prior session. New 52-week highs solidly outnumbered new 52-week lows on both the NYSE and the Nasdaq exchange. PICTURED: The 2-year graph of the S&P 400 Mid Cap Index shows that last week it touched a new record high. Volume totals have been light behind the recent gains, however, not indicative of overwhelming institutional buying demand.
The Dow advanced for a seventh session amid a rally in Technology shares as investors digested an optimistic start to second-quarter earnings season. On the data front, the NAHB survey revealed housing market sentiment declined in July, from a five-month high in June. In M&A news, British chipmaker ARM Holdings (ARMH +40.55) surged after agreeing to a $32 billion takeover offer from Japan’s SoftBank Corp. (SFTBY -7.81%) Five of 10 sectors in the S&P 500 finished positive on the session. Technology stocks outperformed as Facebook (FB +2.15%) and Apple (AAPL +1.06%) rose. Shares of Alphabet (GOOGL +2.39%) helped to advance the tech space. In earnings, Bank of America (BAC +3.29%) rose as the bank beat estimates on the top and bottom line. Yahoo! (YHOO +0.61%) edged higher ahead of its scheduled release after the closing bell. Hasbro (HAS -6.64%) was a notable decliner after reporting a slowdown in sales of “boy-oriented” toys. Treasuries declined with the benchmark 10-year note down 11/32 to yield 1.58%. In commodities, NYMEX WTI crude fell 1.4% to $45.33/barrel. COMEX gold ticked up 0.2% to $1329.40/ounce. In FOREX, the dollar weakened against the euro and British pound. |
 Kenneth J. Gruneisen started out as a licensed stockbroker in August 1987, a couple of months prior to the historic stock market crash that took the Dow Jones Industrial Average down -22.6% in a single day. He has published daily fact-based fundamental and technical analysis on high-ranked stocks online for two decades. Through FACTBASEDINVESTING.COM, Kenneth provides educational articles, news, market commentary, and other information regarding proven investment systems that work in good times and bad.
Comments contained in the body of this report are technical opinions only and are not necessarily those of Gruneisen Growth Corp. The material herein has been obtained from sources believed to be reliable and accurate, however, its accuracy and completeness cannot be guaranteed. Our firm, employees, and customers may effect transactions, including transactions contrary to any recommendation herein, or have positions in the securities mentioned herein or options with respect thereto. Any recommendation contained in this report may not be suitable for all investors and it is not to be deemed an offer or solicitation on our part with respect to the purchase or sale of any securities. |
|
 |
Retail, Financial and Tech Groups Rose
Kenneth J. Gruneisen - Passed the CAN SLIM® Master's Exam
The Retail Index ($RLX +0.67%) also underpinned the major averages' rally and the Broker/Dealer Index ($XBD +0.39%) and Bank Index ($BKX +0.37%) both rose on Monday. The Integrated Oil Index ($XOI -0.08%) and the Oil Services Index ($OSX +0.02%) were unchanged. The Semiconductor Index ($SOX +1.51%) led the tech sector whilethe Biotechnology Index ($BTK +0.29%) edged higher and the Networking Index ($NWX +0.06%) was flat. Charts courtesy www.stockcharts.com
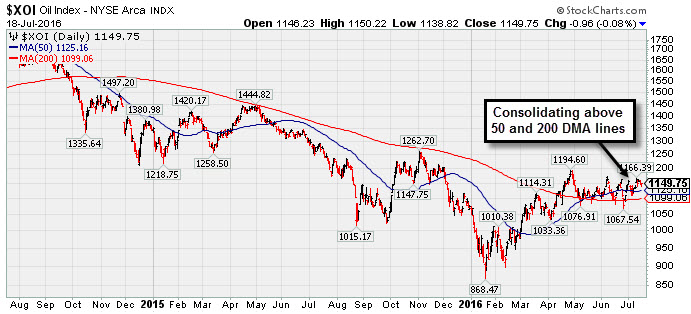
PICTURED: The 2-year graph of the Integrated Oil Index ($XOI -0.08%) illustrates the rebound and consolidation above its 50-day and 200-day moving average (DMA) lines.
| Oil Services |
$OSX |
170.98 |
+0.03 |
+0.02% |
+8.40% |
| Integrated Oil |
$XOI |
1,149.75 |
-0.96 |
-0.08% |
+7.18% |
| Semiconductor |
$SOX |
734.54 |
+10.90 |
+1.51% |
+10.71% |
| Networking |
$NWX |
378.32 |
+0.21 |
+0.06% |
+0.63% |
| Broker/Dealer |
$XBD |
159.54 |
+0.62 |
+0.39% |
-10.41% |
| Retail |
$RLX |
1,341.28 |
+8.92 |
+0.67% |
+4.50% |
| Gold & Silver |
$XAU |
108.42 |
+0.69 |
+0.64% |
+139.34% |
| Bank |
$BKX |
67.47 |
+0.25 |
+0.37% |
-7.68% |
| Biotech |
$BTK |
3,173.09 |
+9.09 |
+0.29% |
-16.80% |
|
|
|
 |
Winning Streak Leaves Leader Extended From Prior Base Pattern
Kenneth J. Gruneisen - Passed the CAN SLIM® Master's Exam
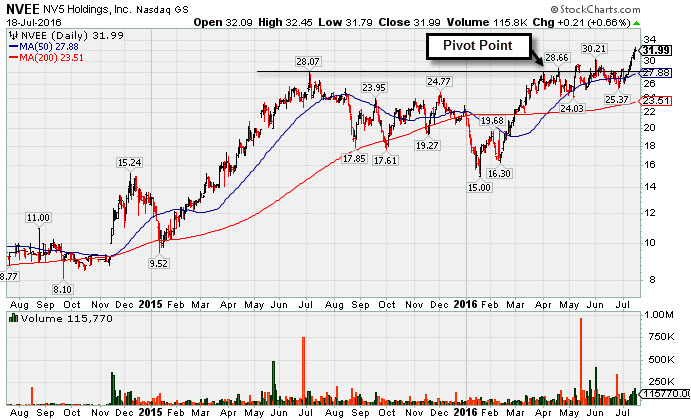
N V 5 Global Inc (NVEE +$0.21 or +0.66% to $31.99) is perched at a new all-time high with above average volume behind its 10th gain in an impressive streak of gains into new high territory. No resistance due to overhead supply, but it is extended more than +5% above its prior high or pivot point. Disciplined investors avoid chasing extended stocks. Its 50-day moving average (DMA) line ($27.88) and recent lows in the $24-25 area define near-term support to watch.
NVEE was last shown in this FSU section on 6/30/16 with an annotated graph under the headline, "Perched Near Highs After Rebound Above 50-Day Average". It completed a new Public Offering on 5/13/16. Members were cautioned - "Such offerings often hinder near-term price progress yet help companies to attract more institutional owners (I criteria). Remember that any stock that was previously sold can be bought again when strength returns."
The high-ranked Commercial Services - Consulting firm will announce its financial results for the second quarter ended June 30, 2016 on Thursday, August 4, 2016, following the close of the markets. It reported earnings +39% on +54% sales revenues for the Mar '16 quarter, continuing its strong earnings track record. It reported earnings +32% on +47% sales revenues for the Dec '15 quarter and prior quarterly earnings comparisons have been mostly above the +25% minimum guideline (C criteria). Its strong annual earnings (A criteria) history helps it match the fundamental guidelines of the fact-based investment system.
The number of top-rated funds owning its shares rose from 13 in Mar '15 to to 130 in Jun '16, a reassuring sign concerning the I criteria. It completed a new Public Offering on 5/22/15. NVEE was first highlighted with a pivot point based on its 12/02/15 high in the 3/14/16 mid-day report (read here) and then finished strong and triggered a technical buy signal while rising from an 8-month double bottom base with +142% above average volume. |
|
|
Color Codes Explained :
Y - Better candidates highlighted by our
staff of experts.
G - Previously featured
in past reports as yellow but may no longer be buyable under the
guidelines.
***Last / Change / Volume data in this table is the closing quote data***
Symbol/Exchange
Company Name
Industry Group |
PRICE |
CHANGE
(%Change) |
Day High |
Volume
(% DAV)
(% 50 day avg vol) |
52 Wk Hi
% From Hi |
Featured
Date |
Price
Featured |
Pivot Featured |
|
Max Buy |
TDG
-
NYSE
Transdigm Group Inc
AEROSPACE/DEFENSE - Aerospace/Defense Products and; Services
|
$271.94
|
+0.49
0.18% |
$272.10
|
397,595
47.00% of 50 DAV
50 DAV is 846,000
|
$273.60
-0.61%
|
5/11/2016
|
$248.33
|
PP = $245.00
|
|
MB = $257.25
|
 Most Recent Note - 7/18/2016 5:43:22 PM
G - Volume totals have been cooling while hovering near all-time highs. Recent lows and its 50 DMA line ($258) define important near-term support to watch on pullbacks.
>>> FEATURED STOCK ARTICLE : Near Highs After Finding Support Above 50-Day Moving Average Line - 7/1/2016 |
View all notes |
Set NEW NOTE alert |
Company Profile |
SEC
News |
Chart |
Request a new note
C
A
S
I |
NTES
-
NASDAQ
Netease Inc Adr
INTERNET - Internet Information Providers
|
$199.43
|
+4.22
2.16% |
$201.93
|
1,487,936
101.63% of 50 DAV
50 DAV is 1,464,000
|
$202.70
-1.61%
|
6/29/2016
|
$182.42
|
PP = $186.55
|
|
MB = $195.88
|
Most Recent Note - 7/15/2016 6:09:25 PM
Y - Perched near its "max buy" level. Disciplined investors avoid chasing stocks more than +5% above the prior high or pivot point. Prior highs near $186 define initial support to watch on pullbacks. See the latest FSU analysis for more details and a new annotated graph.
>>> FEATURED STOCK ARTICLE : Perched +5% Above Prior Highs Following Volume-Driven Gains - 7/15/2016 |
View all notes |
Set NEW NOTE alert |
Company Profile |
SEC
News |
Chart |
Request a new note
C
A
S
I |
HTHT
-
NASDAQ
China Lodging Group Ads
LEISURE - Lodging
|
$39.62
|
-0.76
-1.88% |
$40.94
|
169,876
66.62% of 50 DAV
50 DAV is 255,000
|
$41.76
-5.12%
|
7/13/2016
|
$38.87
|
PP = $39.29
|
|
MB = $41.25
|
Most Recent Note - 7/15/2016 12:43:22 PM
Y - Hit a new high today. Gains for new highs and a strong close backed by at least +40% above average volume may help clinch a convincing technical buy signal. Reported earnings increases more than +25% (C criteria) in the past 3 quarterly comparisons through Mar '16. Annual earnings (A criteria) have improved after a downturn in FY '11. See the latest FSU analysis for more details and an annotated graph.
>>> FEATURED STOCK ARTICLE : Negative Reversal After Touching New High - 7/13/2016 |
View all notes |
Set NEW NOTE alert |
Company Profile |
SEC
News |
Chart |
Request a new note
C
A
S
I |
MXL
-
NYSE
Maxlinear Inc Cl A
Telecom-Infrastructure
|
$20.96
|
+0.43
2.09% |
$21.15
|
1,217,328
106.69% of 50 DAV
50 DAV is 1,141,000
|
$20.98
-0.09%
|
5/16/2016
|
$19.24
|
PP = $19.20
|
|
MB = $20.16
|
Most Recent Note - 7/18/2016 5:40:50 PM
G - Hit a new 52-week high today, rallying further above its "max buy" level. Recent lows and the 200 DMA line in the $16.70 area define important support to watch on pullbacks.
>>> FEATURED STOCK ARTICLE : Slump Into Prior Base and Below 50-Day Moving Average Raised Concerns - 7/5/2016 |
View all notes |
Set NEW NOTE alert |
Company Profile |
SEC
News |
Chart |
Request a new note
C
A
S
I |
PATK
-
NASDAQ
Patrick Industries Inc
WHOLESALE - Building Materials Wholesale
|
$65.47
|
+0.47
0.72% |
$65.82
|
104,955
69.51% of 50 DAV
50 DAV is 151,000
|
$68.13
-3.90%
|
5/24/2016
|
$53.45
|
PP = $50.68
|
|
MB = $53.21
|
Most Recent Note - 7/18/2016 5:42:16 PM
G - Stubbornly holding its ground following an impressive spurt of gains into new high territory. Disciplined investors avoid chasing stocks more than +5% above prior highs. Its 50 DMA line ($55.12) defines near-term support to watch on pullbacks.
>>> FEATURED STOCK ARTICLE : Getting Extended From Prior Base After More Volume-Driven Gains - 7/6/2016 |
View all notes |
Set NEW NOTE alert |
Company Profile |
SEC
News |
Chart |
Request a new note
C
A
S
I |
Symbol/Exchange
Company Name
Industry Group |
PRICE |
CHANGE
(%Change) |
Day High |
Volume
(% DAV)
(% 50 day avg vol) |
52 Wk Hi
% From Hi |
Featured
Date |
Price
Featured |
Pivot Featured |
|
Max Buy |
FBHS
-
NYSE
Fortune Brands Hme & Sec
Bldg-Constr Prds/Misc
|
$61.30
|
+0.01
0.02% |
$61.61
|
663,744
37.46% of 50 DAV
50 DAV is 1,772,000
|
$62.17
-1.40%
|
6/22/2016
|
$57.71
|
PP = $60.08
|
|
MB = $63.08
|
Most Recent Note - 7/15/2016 6:12:05 PM
Y - Quietly hovering at its high following gains lacking above average volume. See the latest FSU analysis for more details and an annotated graph.
>>> FEATURED STOCK ARTICLE : New Highs Lack Important Institutional Volume Punch - 7/11/2016 |
View all notes |
Set NEW NOTE alert |
Company Profile |
SEC
News |
Chart |
Request a new note
C
A
S
I |
NVEE
-
NASDAQ
N V 5 Global Inc
Comml Svcs-Consulting
|
$31.99
|
+0.21
0.66% |
$32.45
|
115,770
90.45% of 50 DAV
50 DAV is 128,000
|
$31.91
0.25%
|
4/19/2016
|
$28.20
|
PP = $28.10
|
|
MB = $29.51
|
Most Recent Note - 7/18/2016 5:38:19 PM
G - Perched at a new all-time high after 10 consecutive gains. Its 50 DMA line ($27.88) and recent lows in the $24-25 area define near-term support to watch. See the latest FSU analysis for more details and a new annotated graph.
>>> FEATURED STOCK ARTICLE : Winning Streak Leaves Leader Extended From Prior Base Pattern - 7/18/2016 |
View all notes |
Set NEW NOTE alert |
Company Profile |
SEC
News |
Chart |
Request a new note
C
A
S
I |
|
|
|
THESE ARE NOT BUY RECOMMENDATIONS!
Comments contained in the body of this report are technical
opinions only. The material herein has been obtained
from sources believed to be reliable and accurate, however,
its accuracy and completeness cannot be guaranteed.
This site is not an investment advisor, hence it does
not endorse or recommend any securities or other investments.
Any recommendation contained in this report may not
be suitable for all investors and it is not to be deemed
an offer or solicitation on our part with respect to
the purchase or sale of any securities. All trademarks,
service marks and trade names appearing in this report
are the property of their respective owners, and are
likewise used for identification purposes only.
This report is a service available
only to active Paid Premium Members.
You may opt-out of receiving report notifications
at any time. Questions or comments may be submitted
by writing to Premium Membership Services 665 S.E. 10 Street, Suite 201 Deerfield Beach, FL 33441-5634 or by calling 1-800-965-8307
or 954-785-1121.
|
|
|