You are not logged in.
This means you
CAN ONLY VIEW reports that were published prior to Saturday, April 5, 2025.
You
MUST UPGRADE YOUR MEMBERSHIP if you want to see any current reports.
AFTER MARKET UPDATE - WEDNESDAY, JULY 6TH, 2022
Previous After Market Report Next After Market Report >>>
|
|
|
|
DOW |
+69.86 |
31,037.68 |
+0.23% |
|
Volume |
1,044,291,004 |
-14% |
|
Volume |
4,805,591,400 |
-4% |
|
NASDAQ |
+39.61 |
11,361.85 |
+0.35% |
|
Advancers |
1,184 |
38% |
|
Advancers |
1,854 |
42% |
|
S&P 500 |
+13.69 |
3,845.08 |
+0.36% |
|
Decliners |
1,941 |
62% |
|
Decliners |
2,556 |
58% |
|
Russell 2000 |
-13.78 |
1,727.55 |
-0.79% |
|
52 Wk Highs |
12 |
|
|
52 Wk Highs |
25 |
|
|
S&P 600 |
-13.39 |
1,126.68 |
-1.17% |
|
52 Wk Lows |
182 |
|
|
52 Wk Lows |
213 |
|
|
 |
Breadth Negative Yet Major Averages Posted Gains on Light Volume
Kenneth J. Gruneisen - Passed the CAN SLIM® Master's Exam
The S&P 500 climbed 0.4%, having gained nearly 5% from its mid-June trough but still remains 19.8% below its January 3 record. The Dow added 69 points, while the Nasdaq Composite advanced 0.4%. Volume totals reported were higher than the prior session on the NYSE and on the Nasdaq exchange. Breadth was negative as decliners led advancers by a 4-3 margin on the Nasdaq exchange and by a 3-2 margin on the NYSE. There were 9 high-ranked companies from the Leaders List that hit new 52-week highs and were listed on the BreakOuts Page, versus the total of 4 on the prior session. New 52-week lows totals solidly outnumbered new 52-week highs on the NYSE and on the Nasdaq exchange. The brief new market uptrend is already under pressure (M criteria). Any sustainable rally requires a healthy crop of leading stocks hitting new highs, but leadership has been very thin.
Chart courtesy of www.stockcharts.com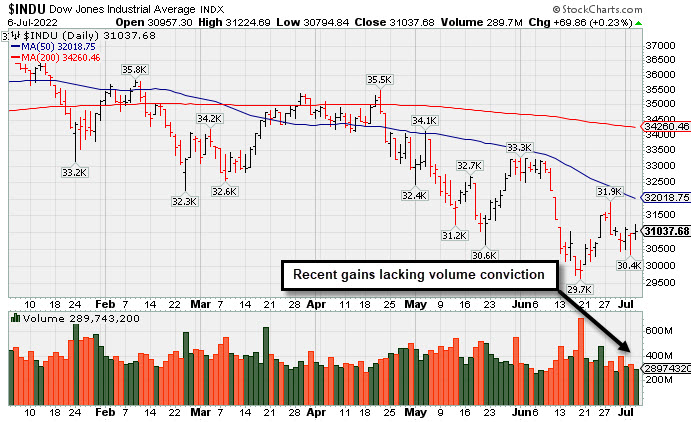 PICTURED: The Dow Jones Industrial Average posted another gain backed by lighter volume. It remains well below its 50-day and 200-day moving average (DMA) lines.
U.S. stocks finished modestly higher on Wednesday as strength in Tech shares helped reverse early session losses. Meanwhile, Treasuries retreated as investors assessed the minutes of the Federal Reserve’s (Fed) June meeting. As expected, the release leaned hawkish as policymakers opted for the largest rate hike since 1994 (0.75%) last month. Officials attributed the move to a hotter-than-expected inflation reading that had come days before the meeting and acknowledged that an “even more restrictive stance” could be warranted if inflation pressures persisted. The yield on the 10-year note spiked 10 basis points (0.10%) to 2.92%, while the yield on the shorter-dated two-year note settled 15 basis points (0.15%) higher at 2.97%. The curve inversion—the phenomena in which short-term rates surpass longer-term yields—has garnered attention around Wall Street, as the scenario has historically preceded recessionary periods.
Economic data heightened prospects of slowing economic growth. A survey from the Institute for Supply Management (ISM) showed U.S. services sector expanded at the slowest pace in over two years. However, the prices paid component declined for a second straight month. Falling commodity prices also supported the narrative of easing inflation pressures. West Texas Intermediate crude slipped 0.9% to $98.58/barrel after yesterday falling below $100/barrel for the first time in nearly two months. Also weighing on oil prices, a gauge of the U.S. dollar extended its advance by 0.5% against a basket of its peers.
|
 Kenneth J. Gruneisen started out as a licensed stockbroker in August 1987, a couple of months prior to the historic stock market crash that took the Dow Jones Industrial Average down -22.6% in a single day. He has published daily fact-based fundamental and technical analysis on high-ranked stocks online for two decades. Through FACTBASEDINVESTING.COM, Kenneth provides educational articles, news, market commentary, and other information regarding proven investment systems that work in good times and bad.
Comments contained in the body of this report are technical opinions only and are not necessarily those of Gruneisen Growth Corp. The material herein has been obtained from sources believed to be reliable and accurate, however, its accuracy and completeness cannot be guaranteed. Our firm, employees, and customers may effect transactions, including transactions contrary to any recommendation herein, or have positions in the securities mentioned herein or options with respect thereto. Any recommendation contained in this report may not be suitable for all investors and it is not to be deemed an offer or solicitation on our part with respect to the purchase or sale of any securities. |
|
 |
Retail, Semiconductor, and Networking Indexes Rose
Kenneth J. Gruneisen - Passed the CAN SLIM® Master's Exam
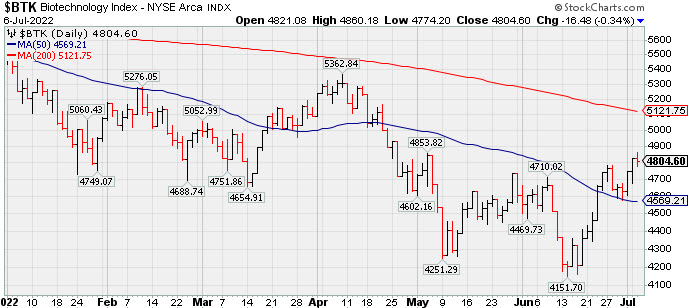
The Broker/Dealer Index ($XBD -1.72%) and Bank Index ($BKX -0.89%) both lost ground and created a drag on the major averages, meanwhile the Retail Index ($RLX +0.42%) posted a small gain. The Semiconductor Index ($SOX +0.66%) and Networking Index ($NWX +0.22%) each posted a small gain while the Biotech Index ($BTK -0.34%) edged lower. The Oil Services Index ($OSX -1.77%) and Integrated Oil Index ($XOI -2.26%) both slumped while the Gold & Silver Index ($XAU -0.32%) suffered a smaller loss.
PICTURED: The Biotech Index ($BTK -0.34%) recently rebounded above its 50-day moving average (DMA) line and made progress above the late-May high, but it remains well below its 200 DMA line.
| Oil Services |
$OSX |
60.73 |
-1.09 |
-1.77% |
+15.18% |
| Integrated Oil |
$XOI |
1,405.01 |
-32.44 |
-2.26% |
+19.25% |
| Semiconductor |
$SOX |
2,494.11 |
+16.47 |
+0.66% |
-36.80% |
| Networking |
$NWX |
682.05 |
+1.48 |
+0.22% |
-29.76% |
| Broker/Dealer |
$XBD |
388.29 |
-6.81 |
-1.72% |
-20.25% |
| Retail |
$RLX |
3,000.11 |
+12.42 |
+0.42% |
-29.02% |
| Gold & Silver |
$XAU |
107.79 |
-0.35 |
-0.32% |
-18.62% |
| Bank |
$BKX |
101.49 |
-0.91 |
-0.89% |
-23.24% |
| Biotech |
$BTK |
4,804.60 |
-16.48 |
-0.34% |
-12.94% |
|
|
|
 |
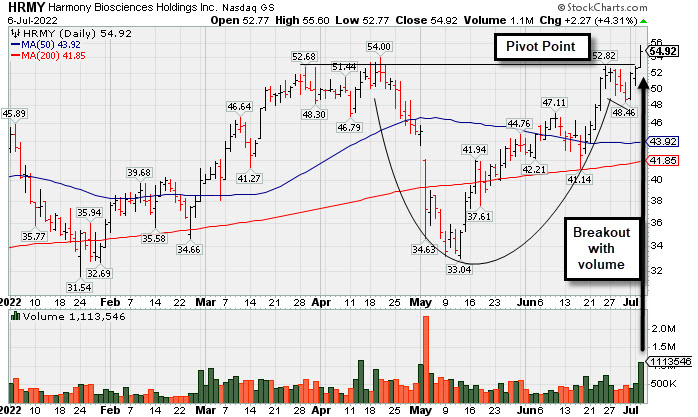
Volume-Driven Breakout For Biotech Firm
Kenneth J. Gruneisen - Passed the CAN SLIM® Master's Exam
Harmony Biosciences Hldg (HRMY +$2.27 or +4.31% to $54.92) was highlighted in yellow with pivot point cited based on its 6/27/22 high in the earlier mid-day report (read here). It hit a new all-time high (N criteria) with today's gain and close above the pivot point backed by +118% above average volume triggering a technical buy signal.
The high-ranked Medical-Biomed/Biotech firm reported strong sales revenues and earnings increases well above the +25% minimum guideline (C criteria) in quarterly comparisons through Mar '22 versus the year ago periods. Its annual earnings history (A criteria) is limited, however it has an 80 Earnings Per Share Rating. It completed its $24 IPO on 8/19/20.
Its small supply of only 236 million shares (S criteria) in the public float can contribute to greater price volatility in the event of institutional buying or selling. The number of top-rated funds owning its shares rose from 208 in Sep '21 to 382 in Jun '22, a reassuring sign concerning the I criteria. Meanwhile, its current Up/Down Volume Ratio of 1.0 is neutral concerning Accumulation/Distribution over the past 50 days.
|
|
|
Color Codes Explained :
Y - Better candidates highlighted by our
staff of experts.
G - Previously featured
in past reports as yellow but may no longer be buyable under the
guidelines.
***Last / Change / Volume data in this table is the closing quote data***
Symbol/Exchange
Company Name
Industry Group |
PRICE |
CHANGE
(%Change) |
Day High |
Volume
(% DAV)
(% 50 day avg vol) |
52 Wk Hi
% From Hi |
Featured
Date |
Price
Featured |
Pivot Featured |
|
Max Buy |
 LLY
-
NYSE
LLY
-
NYSE
Eli Lilly & Co
Medical-Diversified
|
$330.15
|
+2.97
0.91% |
$332.74
|
2,251,552
71.59% of 50 DAV
50 DAV is 3,145,000
|
$330.85
-0.21%
|
5/16/2022
|
$302.46
|
PP = $314.10
|
|
MB = $329.81
|
 Most Recent Note - 7/6/2022 5:38:40 PM
G - Color code is changed to green after rising above its "max buy" level, as volume totals have been below average while wedging further into all-time high territory with 5 consecutive gains. Its 50 DMA line ($302) defines near-term support above prior lows.
>>> FEATURED STOCK ARTICLE : Encountering Distributional Pressure After Reaching New Highs - 6/6/2022 |
View all notes |
Set NEW NOTE alert |
Company Profile |
SEC
News |
Chart |
Request a new note
C
A
S
I |
IMXI
-
NASDAQ
International Money Exp
Financial Svcs-Specialty
|
$22.52
|
+0.59
2.69% |
$22.68
|
747,024
200.81% of 50 DAV
50 DAV is 372,000
|
$22.86
-1.49%
|
7/1/2022
|
$21.27
|
PP = $21.38
|
|
MB = $22.45
|
Most Recent Note - 7/6/2022 5:35:36 PM
Y - Perched near its 52-week high and "max buy" level after today's 4th consecutive volume-driven gain. Rebound above the 50 DMA line ($20) helped its outlook improve. Fundamentals through the Mar '22 quarter have been strong.
>>> FEATURED STOCK ARTICLE : Volume Heavy While Rallying from Double Bottom Base - 7/1/2022 |
View all notes |
Set NEW NOTE alert |
Company Profile |
SEC
News |
Chart |
Request a new note
C
A
S
I |
HRMY
-
NASDAQ
Harmony Biosciences Hldg
Medical-Biomed/Biotech
|
$54.92
|
+2.27
4.31% |
$55.60
|
1,113,546
217.49% of 50 DAV
50 DAV is 512,000
|
$54.00
1.70%
|
7/6/2022
|
$54.12
|
PP = $52.85
|
|
MB = $55.49
|
Most Recent Note - 7/6/2022 5:34:08 PM
Y - Finished strong after highlighted in yellow in the earlier mid-day report with pivot point cited based on its 6/27/22 high. Hit a new all-time high with a gain and close above the pivot point backed by +118% above average volume triggering a technical buy signal. Reported strong sales revenues and earnings increases in quarterly comparisons through Mar '22 versus the year ago periods. Annual earnings history is limited. Completed its $24 IPO on 8/19/20. See the latest FSU analysis for more details and a new annotated graph.
>>> FEATURED STOCK ARTICLE : Volume-Driven Breakout For Biotech Firm - 7/6/2022 |
View all notes |
Set NEW NOTE alert |
Company Profile |
SEC
News |
Chart |
Request a new note
C
A
S
I |
|
|
|
THESE ARE NOT BUY RECOMMENDATIONS!
Comments contained in the body of this report are technical
opinions only. The material herein has been obtained
from sources believed to be reliable and accurate, however,
its accuracy and completeness cannot be guaranteed.
This site is not an investment advisor, hence it does
not endorse or recommend any securities or other investments.
Any recommendation contained in this report may not
be suitable for all investors and it is not to be deemed
an offer or solicitation on our part with respect to
the purchase or sale of any securities. All trademarks,
service marks and trade names appearing in this report
are the property of their respective owners, and are
likewise used for identification purposes only.
This report is a service available
only to active Paid Premium Members.
You may opt-out of receiving report notifications
at any time. Questions or comments may be submitted
by writing to Premium Membership Services 665 S.E. 10 Street, Suite 201 Deerfield Beach, FL 33441-5634 or by calling 1-800-965-8307
or 954-785-1121.
|
|
|