You are not logged in.
This means you
CAN ONLY VIEW reports that were published prior to Sunday, April 6, 2025.
You
MUST UPGRADE YOUR MEMBERSHIP if you want to see any current reports.
AFTER MARKET UPDATE - THURSDAY, JULY 7TH, 2022
Previous After Market Report Next After Market Report >>>
|
|
|
|
DOW |
+346.87 |
31,384.55 |
+1.12% |
|
Volume |
900,559,040 |
-14% |
|
Volume |
4,642,360,300 |
-3% |
|
NASDAQ |
+259.49 |
11,621.35 |
+2.28% |
|
Advancers |
2,391 |
76% |
|
Advancers |
3,102 |
72% |
|
S&P 500 |
+57.54 |
3,902.62 |
+1.50% |
|
Decliners |
737 |
24% |
|
Decliners |
1,176 |
27% |
|
Russell 2000 |
+42.06 |
1,769.60 |
+2.43% |
|
52 Wk Highs |
11 |
|
|
52 Wk Highs |
24 |
|
|
S&P 600 |
+19.88 |
1,146.56 |
+1.76% |
|
52 Wk Lows |
59 |
|
|
52 Wk Lows |
118 |
|
|
 |
Indices Rose With Lighter Volume and Lacking New Leadership
Kenneth J. Gruneisen - Passed the CAN SLIM® Master's Exam
The broad S&P 500 Index climbed 1.5%, on track for its third positive week in the last 14. The Dow advanced 346 points, while the Nasdaq Composite jumped 2.3% as a recent relief rally in tech shares persisted. Volume totals reported were lighter than the prior session on the NYSE and on the Nasdaq exchange. Breadth was positive as advancers led decliners by more than a 3-1 margin on the NYSE and nearly 3-1 on the Nasdaq exchange. There were 7 high-ranked companies from the Leaders List that hit new 52-week highs and were listed on the BreakOuts Page, versus the total of 9 on the prior session. New 52-week lows totals contracted yet still outnumbered new 52-week highs on the NYSE and on the Nasdaq exchange. The brief new market uptrend is already under pressure (M criteria). Any sustainable rally requires a healthy crop of leading stocks hitting new highs, but leadership has been very thin.
Chart courtesy of www.stockcharts.com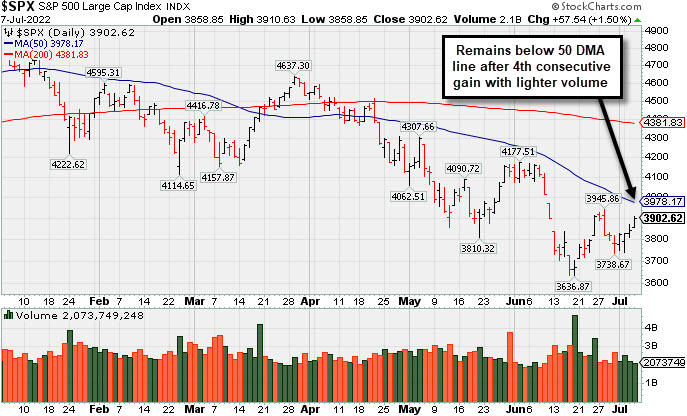 PICTURED: The S&P 500 Index posted a 4th consecutive gain backed by lighter volume. It remains well below its 50-day and 200-day moving average (DMA) lines.
U.S. stocks finished broadly higher on Thursday, with the S&P 500 notching its first four-day winning streak since March. Still, investors remained cautious as an inversion in the U.S. Treasury yield curve extended into a third consecutive day, indicating ongoing concerns around a possible looming recession. The yield on the 10-year note rose nine basis points (0.09%) to 3.01%, while the yield on the shorter-dated two-year note settled higher at 3.03%. Meanwhile, a pair of Federal Reserve (Fed) officials reiterated the U.S. central bank’s hawkish stance. Fed Governor Christopher Waller voiced support for another 0.75% rate hike later this month and said recession fears were “overblown.” St. Louis Fed President Bullard echoed policymakers’ commitment to hiking interest rates in order to avoid elevated inflation becoming embedded in the economy.
Elsewhere, commodities rebounded as the U.S. dollar modestly weakened for the first time in five sessions. West Texas Intermediate (WTI) crude bounced back from its lowest close since April 11, gaining 3.9% to $102.39/barrel. Overseas, the British pound strengthened against the greenback following reports that U.K. Prime Minister Boris Johnson plans to resign.
On the data front, weekly initial jobless claims came in at 235,000, versus the prior 231,000 figure. Separately, the U.S. trade deficit narrowed to $85.5 billion in May. Elsewhere, mortgage rates posted their sharpest one-week drop since 2008, with the 30-year fixed rate sliding 0.40% to 5.30%.
|
 Kenneth J. Gruneisen started out as a licensed stockbroker in August 1987, a couple of months prior to the historic stock market crash that took the Dow Jones Industrial Average down -22.6% in a single day. He has published daily fact-based fundamental and technical analysis on high-ranked stocks online for two decades. Through FACTBASEDINVESTING.COM, Kenneth provides educational articles, news, market commentary, and other information regarding proven investment systems that work in good times and bad.
Comments contained in the body of this report are technical opinions only and are not necessarily those of Gruneisen Growth Corp. The material herein has been obtained from sources believed to be reliable and accurate, however, its accuracy and completeness cannot be guaranteed. Our firm, employees, and customers may effect transactions, including transactions contrary to any recommendation herein, or have positions in the securities mentioned herein or options with respect thereto. Any recommendation contained in this report may not be suitable for all investors and it is not to be deemed an offer or solicitation on our part with respect to the purchase or sale of any securities. |
|
 |
Tech, Financial, Retail, and Commodity-Linked Groups Rose
Kenneth J. Gruneisen - Passed the CAN SLIM® Master's Exam
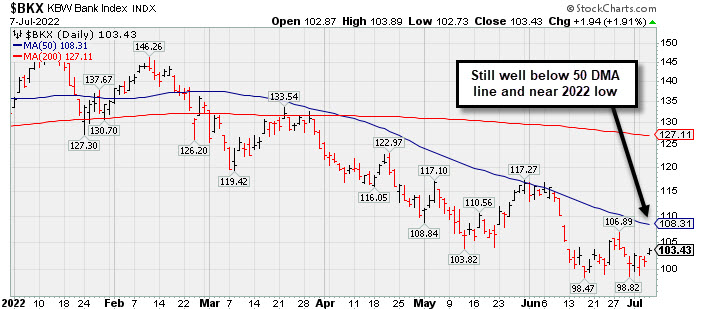
The Broker/Dealer Index ($XBD +1.42%), Bank Index ($BKX +1.91%), and Retail Index ($RLX +1.69%) posted influential gains. The tech sector had a positive bias as the Semiconductor Index ($SOX +4.48%) outpaced the Networking Index ($NWX +2.72%) and the Biotech Index ($BTK +1.71%). The Oil Services Index ($OSX +5.05%) and Integrated Oil Index ($XOI +3.79%) both posted big gains and the Gold & Silver Index ($XAU +1.80%) also rose.
PICTURED: The Bank Index ($BKX +1.91%) is still well below its 50-day moving average (DMA) line and near its 2022 low.
| Oil Services |
$OSX |
63.79 |
+3.07 |
+5.05% |
+21.00% |
| Integrated Oil |
$XOI |
1,458.26 |
+53.25 |
+3.79% |
+23.77% |
| Semiconductor |
$SOX |
2,605.88 |
+111.77 |
+4.48% |
-33.96% |
| Networking |
$NWX |
700.61 |
+18.56 |
+2.72% |
-27.85% |
| Broker/Dealer |
$XBD |
393.81 |
+5.53 |
+1.42% |
-19.11% |
| Retail |
$RLX |
3,050.95 |
+50.84 |
+1.69% |
-27.81% |
| Gold & Silver |
$XAU |
109.74 |
+1.94 |
+1.80% |
-17.15% |
| Bank |
$BKX |
103.43 |
+1.94 |
+1.91% |
-21.77% |
| Biotech |
$BTK |
4,886.90 |
+82.30 |
+1.71% |
-11.44% |
|
|
|
 |
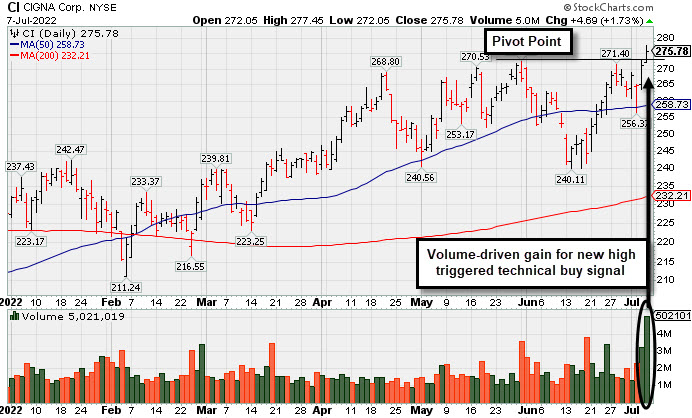
Volume-Driven Breakout for Cigna Corp
Kenneth J. Gruneisen - Passed the CAN SLIM® Master's Exam
Cigna Corp (CI +$4.69 or +1.73% to $275.78) was highlighted in yellow with new pivot point based on its 5/31/22 high plus 10 cents in the earlier mid-day report (read here). It hit a new all-time high with today's gain backed by +190% above average volume triggering a technical buy signal while adding to a big volume-driven gain on the prior session. The recent rebound above its 50-day moving average (DMA) line ($259) helped its outlook to improve since dropped from the Featured Stocks list on 6/13/22.
The number of top-rated funds owning its shares rose from 2,628 in Dec '21 to 2,724 in Jun '22, a reassuring sign concerning the I criteria. The Medical - Managed Care group is currently ranked 11th on the 197 Industry Groups list and has a Group Relative Strength Rating of 94 (A+), a reassuring sign concerning the L criteria. The ratings and numbers noted above have all improved since CI was first highlighted in yellow in the 5/06/22 mid-day report (read here) with a pivot point cited based on its 4/21/22 high, and since last shown in detail on 5/25/22 with an annotated graph under the headline, "Consolidating Above 50-Day Moving Average Near All-Time High"
CI has a 95 Earnings Per Share Rating. It reported a strong +27% earnings increase on +7% sales revenues for the Mar '22 quarter versus the year ago period, its 3rd strong quarterly comparison above the +25% minimum guideline (C criteria). Annual earnings growth (A criteria) has been strong.
|
|
|
Color Codes Explained :
Y - Better candidates highlighted by our
staff of experts.
G - Previously featured
in past reports as yellow but may no longer be buyable under the
guidelines.
***Last / Change / Volume data in this table is the closing quote data***
Symbol/Exchange
Company Name
Industry Group |
PRICE |
CHANGE
(%Change) |
Day High |
Volume
(% DAV)
(% 50 day avg vol) |
52 Wk Hi
% From Hi |
Featured
Date |
Price
Featured |
Pivot Featured |
|
Max Buy |
 LLY
-
NYSE
LLY
-
NYSE
Eli Lilly & Co
Medical-Diversified
|
$327.95
|
-2.20
-0.67% |
$330.50
|
2,357,912
74.97% of 50 DAV
50 DAV is 3,145,000
|
$332.74
-1.44%
|
5/16/2022
|
$302.46
|
PP = $314.10
|
|
MB = $329.81
|
 Most Recent Note - 7/7/2022 5:31:13 PM
Y - Color code is changed to yellow while dipping under its "max buy" level with volume totals cooling. Its 50 DMA line ($303) defines near-term support above prior lows.
>>> FEATURED STOCK ARTICLE : Encountering Distributional Pressure After Reaching New Highs - 6/6/2022 |
View all notes |
Set NEW NOTE alert |
Company Profile |
SEC
News |
Chart |
Request a new note
C
A
S
I |
IMXI
-
NASDAQ
International Money Exp
Financial Svcs-Specialty
|
$22.50
|
-0.02
-0.09% |
$22.94
|
834,940
224.45% of 50 DAV
50 DAV is 372,000
|
$22.86
-1.57%
|
7/1/2022
|
$21.27
|
PP = $21.38
|
|
MB = $22.45
|
Most Recent Note - 7/7/2022 5:28:23 PM
G - Finished flat after hitting a new 52-week high today and its color code was changed to green after rising above its "max buy" level with volume-driven gains. No resistance remains due to overhead supply. Rebound above the 50 DMA line ($20) helped its outlook improve. Fundamentals through the Mar '22 quarter have been strong.
>>> FEATURED STOCK ARTICLE : Volume Heavy While Rallying from Double Bottom Base - 7/1/2022 |
View all notes |
Set NEW NOTE alert |
Company Profile |
SEC
News |
Chart |
Request a new note
C
A
S
I |
HRMY
-
NASDAQ
Harmony Biosciences Hldg
Medical-Biomed/Biotech
|
$55.45
|
+0.53
0.97% |
$57.13
|
990,489
193.45% of 50 DAV
50 DAV is 512,000
|
$55.60
-0.27%
|
7/6/2022
|
$54.12
|
PP = $52.85
|
|
MB = $55.49
|
Most Recent Note - 7/7/2022 5:27:27 PM
Y - Hit another new all-time high with today's 4th consecutive gain marked by above average volume. Finished strong after highlighted in yellow in the 7/06/22 mid-day report with pivot point cited based on its 6/27/22 high. The gain and close above the pivot point backed by +118% above average volume triggered a technical buy signal. Reported strong sales revenues and earnings increases in quarterly comparisons through Mar '22 versus the year ago periods. Annual earnings history is limited. Completed its $24 IPO on 8/19/20. See the latest FSU analysis for more details and an annotated graph.
>>> FEATURED STOCK ARTICLE : Volume-Driven Breakout For Biotech Firm - 7/6/2022 |
View all notes |
Set NEW NOTE alert |
Company Profile |
SEC
News |
Chart |
Request a new note
C
A
S
I |
CI
-
NYSE
Cigna Corp
Medical-Managed Care
|
$275.78
|
+4.69
1.73% |
$277.45
|
5,021,019
289.90% of 50 DAV
50 DAV is 1,732,000
|
$273.58
0.80%
|
7/7/2022
|
$276.55
|
PP = $273.68
|
|
MB = $287.36
|
Most Recent Note - 7/7/2022 5:25:35 PM
Y - Finished strong today after highlighted in yellow in the mid-day report with new pivot point based on its 5/31/22 high plus 10 cents. The volume-driven gain triggered a technical buy signal. Rebound above its 50 DMA line ($259) helped its outlook to improve since dropped from the Featured Stocks list on 6/13/22. See the latest FSU analysis for more details and a new annotated graph.
>>> FEATURED STOCK ARTICLE : Volume-Driven Breakout for Cigna Corp - 7/7/2022 |
View all notes |
Set NEW NOTE alert |
Company Profile |
SEC
News |
Chart |
Request a new note
C
A
S
I |
|
|
|
THESE ARE NOT BUY RECOMMENDATIONS!
Comments contained in the body of this report are technical
opinions only. The material herein has been obtained
from sources believed to be reliable and accurate, however,
its accuracy and completeness cannot be guaranteed.
This site is not an investment advisor, hence it does
not endorse or recommend any securities or other investments.
Any recommendation contained in this report may not
be suitable for all investors and it is not to be deemed
an offer or solicitation on our part with respect to
the purchase or sale of any securities. All trademarks,
service marks and trade names appearing in this report
are the property of their respective owners, and are
likewise used for identification purposes only.
This report is a service available
only to active Paid Premium Members.
You may opt-out of receiving report notifications
at any time. Questions or comments may be submitted
by writing to Premium Membership Services 665 S.E. 10 Street, Suite 201 Deerfield Beach, FL 33441-5634 or by calling 1-800-965-8307
or 954-785-1121.
|
|
|