You are not logged in.
This means you
CAN ONLY VIEW reports that were published prior to Tuesday, April 15, 2025.
You
MUST UPGRADE YOUR MEMBERSHIP if you want to see any current reports.
AFTER MARKET UPDATE - WEDNESDAY, JULY 6TH, 2011
Previous After Market Report Next After Market Report >>>
|
|
|
|
DOW |
+56.15 |
12,626.02 |
+0.45% |
|
Volume |
821,020,570 |
-9% |
|
Volume |
1,610,963,710 |
+6% |
|
NASDAQ |
+8.25 |
2,834.02 |
+0.29% |
|
Advancers |
1,662 |
53% |
|
Advancers |
1,464 |
54% |
|
S&P 500 |
+1.34 |
1,339.22 |
+0.10% |
|
Decliners |
1,314 |
42% |
|
Decliners |
1,111 |
41% |
|
Russell 2000 |
+3.61 |
845.23 |
+0.43% |
|
52 Wk Highs |
159 |
|
|
52 Wk Highs |
143 |
|
|
S&P 600 |
+1.20 |
454.71 |
+0.26% |
|
52 Wk Lows |
12 |
|
|
52 Wk Lows |
28 |
|
|
 |
Market Shrugs Off China Rate Hike and U.S. Debt Concerns
Kenneth J. Gruneisen - Passed the CAN SLIM® Master's Exam
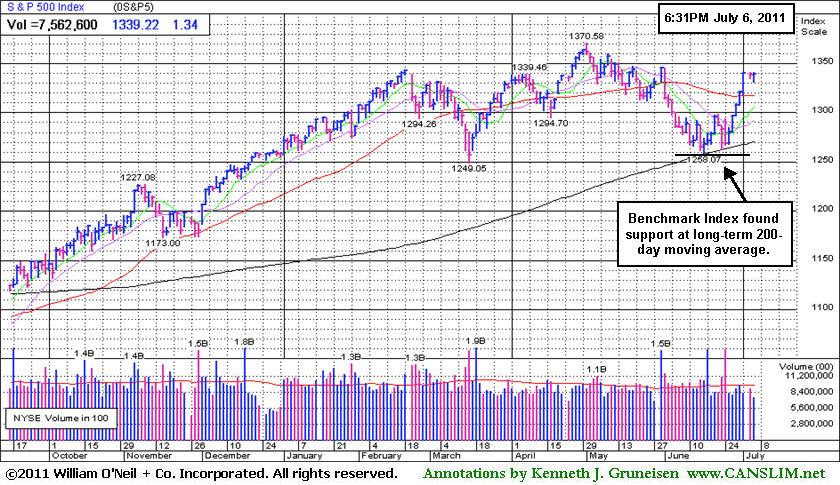
All of the major averages finished Wednesday's session higher as the market shrugged off an interest-rate hike in China and a soft reading on the U.S. services sector. Volume totals were reported lighter than the prior session on the NYSE and higher on the Nasdaq exchange. Advancing issues beat decliners 4-3 on the NYSE and by 7-5 on the Nasdaq exchange. New 52-week highs outnumbered new 52-week lows on both the Nasdaq exchange and the NYSE. There were 109 high-ranked companies from the CANSLIM.net Leaders List that made new 52-week highs and appeared on the CANSLIM.net BreakOuts Page, down from the total of 126 on the prior session. There were 11 gainers out of the 16 high-ranked leaders currently included on the Featured Stocks Page.
Caution prevailed on Wall Street ahead of some key jobs data later in the week. The major stock averages drifted in narrow ranges throughout the day and closed modestly higher. Financial stocks remained under selling pressure on concerns about their exposure to euro-zone debt. Moody's downgrade of Portugal's debt rating to junk status was credited for boosting gold prices for a second straight session, as if current U.S. debt concerns were not of great concern to the market. Transportation stocks were among the best performers.
Con-Way Inc (CNW +5.65%) broke out to a new 52-week high after announcing it was restoring some employee benefits because the economy had improved. Walgreen Co (WAG +1.05%) reported June sales that were better than forecast, meanwhile its shares rallied toward its 50-day moving average line which may act as resistance. The new General Motors Company (GM +1.1%) was up following an analyst upgrade. Due to fundamental and technical flaws, none of the above mentioned well-knowns would be under consideration as serious buy candidates by disciplined followers of the fact-based investment system.
The total number of high-ranked stocks hitting new 52-week highs and the totals cited for hitting the Breakouts Page rose over the prior 8 trading sessions from 15, to 28, 34, 67, 71, 74, 107, and finally, 126 on Tuesday's post-July 4th session. Friday's commentary noted - "The expansion in leadership (new highs) and technical improvement in the major averages has not met the definition of a convincing follow-through day, but regular readers may have noticed that the overall action in sum suggests that the market's rally effort has gathered more upward momentum."
The official assessment of the market direction (M criteria) has changed from being defined as, "In a correction, requiring a follow- through day as confirmation of a new rally", back to a, "Market uptrend", while still absent a follow-through day. This was referenced in Paul Whitfield's column in the 7/05/11 paper which stated - "The preponderance of the evidence is that the market is in an uptrend, not a correction." The column also said it is possible the 6/21/11 gain of +1.3% in the S&P 500 Index was a follow-through day confirming the market's rally attempt. Regular readers may note that the CANSLIM.net Market Commentary on Tuesday June 21 (read here) stated - "The S&P 500 Index posted a +1.34% gain, which might be considered a questionable gain borderline with the minimum gain expected for a follow-through day. The S&P 400 Mid-Cap Index and S&P 600 Small-Cap Index both posted +1.9% gains on Day 3 and Day 4 of their rally attempts, respectively. The strength in small stocks and expansion in the new 52-week highs list were encouraging signs for growth-oriented investors who might cautiously look to accumulate ideal buy candidates."
Our July 2011 issue of CANSLIM.net News is due to be released soon with a comprehensive summary of current market conditions that further clarifies matters concerning the M criteria! The Q2 2011 CANSLIM.net Webcast is available "ON DEMAND" now to UPGRADED MEMBERS ONLY - (CLICK HERE).
PICTURED: The S&P 500 Index found support near its longer-term 200-day moving average line and is now perched -2.3% off its May 2nd high.
|
 Kenneth J. Gruneisen started out as a licensed stockbroker in August 1987, a couple of months prior to the historic stock market crash that took the Dow Jones Industrial Average down -22.6% in a single day. He has published daily fact-based fundamental and technical analysis on high-ranked stocks online for two decades. Through FACTBASEDINVESTING.COM, Kenneth provides educational articles, news, market commentary, and other information regarding proven investment systems that work in good times and bad.
Comments contained in the body of this report are technical opinions only and are not necessarily those of Gruneisen Growth Corp. The material herein has been obtained from sources believed to be reliable and accurate, however, its accuracy and completeness cannot be guaranteed. Our firm, employees, and customers may effect transactions, including transactions contrary to any recommendation herein, or have positions in the securities mentioned herein or options with respect thereto. Any recommendation contained in this report may not be suitable for all investors and it is not to be deemed an offer or solicitation on our part with respect to the purchase or sale of any securities. |
|
 |
Financials Falter While Retailers Are Resilient
Kenneth J. Gruneisen - Passed the CAN SLIM® Master's Exam
The Retail Index ($RLX +0.26%) rose and defensive groups helped buoy the market as the Healthcare Index ($HMO +0.35%) and Gold & Silver Index ($XAU +0.80%) attracted buying demand. Meanwhile, influential financial shares created a drag on the market as the Broker/Dealer Index ($XBD -0.87%) and Bank Index ($BKX -0.68%) slumped toward their recent lows. Energy-related shares fell and the Integrated Oil Index ($XOI -0.48%) and Oil Services Index ($OSX -0.34%) finished modestly lower. The Semiconductor Index ($SOX -0.76%) and Networking Index ($NWX -0.32%) suffered small losses as the Internet Index ($IIX +0.18%) and Biotechnology Index ($BTK +0.18%) inched higher.
Charts courtesy www.stockcharts.com
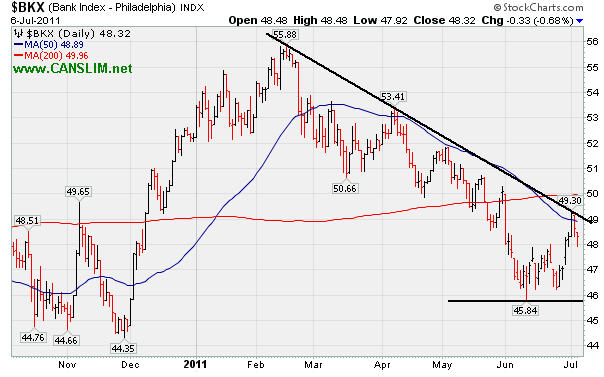
PICTURED 1: The Bank Index ($BKX -0.68%) reversed from its 50-day moving average (DMA) line, and its recent high created a clear downward trendline from its February high. The future is likely to be brighter for the broader market if there is a subsequent rally above that trendline and its 50 & 200 DMA lines for the Bank Index. Meanwhile, a violation of the June lows may prove ominous and could lead to revisiting the late 2010 lows or worse, and any further deterioration for the Ban Index hurts the broader market rally's outlook.
Charts courtesy www.stockcharts.com
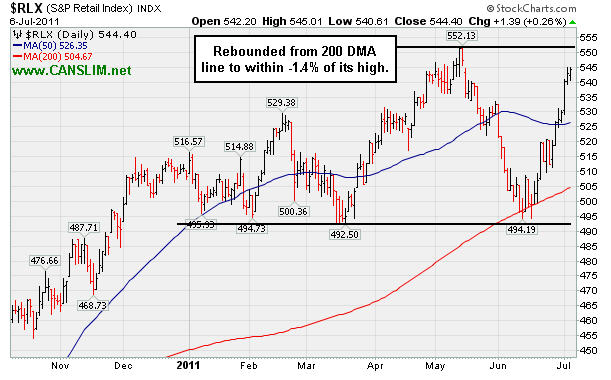
PICTURED 2: The Retail Index ($RLX +0.26%) has quickly rebounded from its 200-day moving average and recent lows nearly coinciding with earlier lows. It finished -1.4% off its high. Strength in the retail group is reassuring, as consumer spending accounts for nearly 2/3 of the economy.
| Oil Services |
$OSX |
271.45 |
-0.93 |
-0.34% |
+10.74% |
| Healthcare |
$HMO |
2,511.33 |
+8.65 |
+0.35% |
+48.42% |
| Integrated Oil |
$XOI |
1,315.74 |
-6.40 |
-0.48% |
+8.46% |
| Semiconductor |
$SOX |
411.79 |
-3.15 |
-0.76% |
-0.01% |
| Networking |
$NWX |
305.45 |
-0.98 |
-0.32% |
+8.87% |
| Internet |
$IIX |
318.96 |
+0.58 |
+0.18% |
+3.65% |
| Broker/Dealer |
$XBD |
107.40 |
-0.94 |
-0.87% |
-11.62% |
| Retail |
$RLX |
544.40 |
+1.39 |
+0.26% |
+7.09% |
| Gold & Silver |
$XAU |
206.06 |
+1.63 |
+0.80% |
-9.06% |
| Bank |
$BKX |
48.32 |
-0.33 |
-0.68% |
-7.45% |
| Biotech |
$BTK |
1,481.01 |
+2.70 |
+0.18% |
+14.13% |
|
|
|
 |
Former Favorite Paused At All-Time High
Kenneth J. Gruneisen - Passed the CAN SLIM® Master's Exam
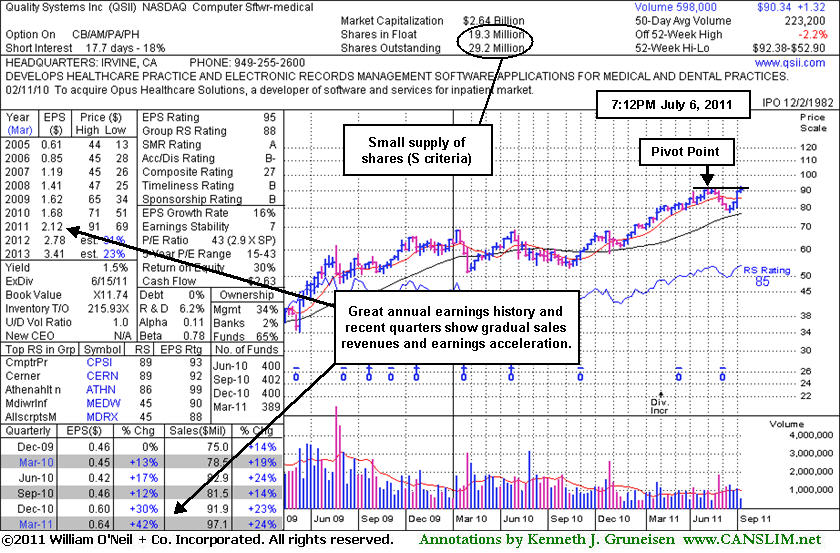
Quality Systems Inc (QSII -$0.02 or -0.02% to $90.40) hit a new all-time high today with its 7th consecutive gain after a lopsided 9-week cup shaped base without a handle. It was featured in today's mid-day report with an annotated daily graph (read here) as its color code was changed to yellow. A volume-driven gain above its pivot point still is needed to trigger a new technical buy signal.
This long-ago featured Computer Software - Medical firm had encountered prompt distributional pressure after reaching new multi-year highs when it last appeared in this FSU section on 9/15/08 under the headline, "Negative Reversal on Weekly Chart Raised Concerns". Its reversal and gaps down were noted in CANSLIM.net's ongoing coverage as weak technical action raised concerns, It had been highlighted in yellow in the 09/09/2008 Mid-Day Breakouts Report. It was first featured on Monday, January 31, 2005 in the CANSLIM.net Mid Day Breakouts Report (read here).
It is worth noting that the company has maintained a steady annual earnings history (good A criteria). Its 2 latest quarterly comparisons also showed better than the minimum +25% earnings per share increases and there has also been gradual sales revenues acceleration in recent comparisons. The small supply of shares in circulation (the S criteria) could contribute to greater volatility, especially if the institutional crowd rushes in or out. The number of top-rated funds owning its shares slipped from 400 in Dec '10 to 389 in Mar '11, raising minor concerns with respect to the I criteria. That is all the more reason for disciplined investors to watch for convincing proof of heavy accumulation by the institutional crowd before taking any action, resisting the temptation to get in "early" before a technical breakout.
|
|
|
Color Codes Explained :
Y - Better candidates highlighted by our
staff of experts.
G - Previously featured
in past reports as yellow but may no longer be buyable under the
guidelines.
***Last / Change / Volume data in this table is the closing quote data***
Symbol/Exchange
Company Name
Industry Group |
PRICE |
CHANGE
(%Change) |
Day High |
Volume
(% DAV)
(% 50 day avg vol) |
52 Wk Hi
% From Hi |
Featured
Date |
Price
Featured |
Pivot Featured |
|
Max Buy |
CACC
-
NASDAQ
Credit Acceptance Corp
FINANCIAL SERVICES - Credit Services
|
$85.23
|
-0.02
-0.02% |
$85.46
|
45,854
109.44% of 50 DAV
50 DAV is 41,900
|
$86.87
-1.89%
|
6/2/2011
|
$76.10
|
PP = $82.39
|
|
MB = $86.51
|
Most Recent Note - 7/5/2011 12:13:29 PM
Y - Pulling back below its "max buy" level with today's loss on higher volume, and its color code is changed to yellow. Approximately 40% of successful breakouts pull back and test support at old highs after a breakout before continuing higher. CACC triggered a technical buy signal with its rally above its pivot point backed by +52% above average volume on 6/30/11. Prior highs in the $80-82 area define initial support to watch on pullbacks.
>>> The latest Featured Stock Update with an annotated graph appeared on 6/27/2011. Click here.
View all notes |
Alert me of new notes |
CANSLIM.net Company Profile |
SEC |
Zacks Reports |
StockTalk |
News |
Chart |
Request a new note
C
A N
S L
I M


|
CMG
-
NYSE
Chipotle Mexican Grill
LEISURE - Restaurants
|
$324.94
|
+3.49
1.09% |
$325.76
|
866,176
91.37% of 50 DAV
50 DAV is 948,000
|
$322.63
0.72%
|
4/1/2011
|
$274.00
|
PP = $275.10
|
|
MB = $288.86
|
Most Recent Note - 7/1/2011 3:50:57 PM
G - Hitting another new all-time high with below average volume behind its gain today. Getting extended from prior highs that define initial chart support to watch.
>>> The latest Featured Stock Update with an annotated graph appeared on 6/15/2011. Click here.
View all notes |
Alert me of new notes |
CANSLIM.net Company Profile |
SEC |
Zacks Reports |
StockTalk |
News |
Chart |
Request a new note
C
A N
S L
I M
|
EW
-
NYSE
Edwards Lifesciences Cp
HEALTH SERVICES - Medical Appliances and Equipment
|
$89.19
|
+1.12
1.27% |
$89.41
|
1,040,043
136.31% of 50 DAV
50 DAV is 763,000
|
$91.82
-2.86%
|
7/6/2011
|
$89.19
|
PP = $90.48
|
|
MB = $95.00
|
Most Recent Note - 7/6/2011
Y - The Medical - Products firm is challenging its 52-week and all-time highs today with its 7th consecutive small gain. Color code is changed to yellow, and a volume driven gain and strong close above its pivot point could trigger a technical buy signal. Recent quarterly comparisons showed accelerating sales revenues and earnings increases, and it has maintained a slow steady annual earnings (A criteria) history.

There are no Featured Stock Updates™ available for this stock at this time. You may request one by clicking the Request a New Note link below
View all notes |
Alert me of new notes |
CANSLIM.net Company Profile |
SEC |
Zacks Reports |
StockTalk |
News |
Chart |
Request a new note
C
A N
S L
I M
|
EZPW
-
NASDAQ
Ezcorp Inc Cl A
SPECIALTY RETAIL - Specialty Retail, Other
|
$37.39
|
+0.31
0.84% |
$38.66
|
589,777
154.92% of 50 DAV
50 DAV is 380,700
|
$37.65
-0.69%
|
6/13/2011
|
$31.18
|
PP = $33.41
|
|
MB = $35.08
|
 Most Recent Note - 7/6/2011 12:52:22 PM
G - Spiking higher with today's 9th consecutive volume-driven gain. Getting very extended from prior highs in the $33 area that define support to watch on pullbacks.
>>> The latest Featured Stock Update with an annotated graph appeared on 7/5/2011. Click here.
View all notes |
Alert me of new notes |
CANSLIM.net Company Profile |
SEC |
Zacks Reports |
StockTalk |
News |
Chart |
Request a new note
C
A N
S L
I M
|
FCFS
-
NASDAQ
First Cash Financial Svs
SPECIALTY RETAIL - Specialty Retail, Other
|
$43.74
|
-0.09
-0.21% |
$43.99
|
192,281
103.32% of 50 DAV
50 DAV is 186,100
|
$44.33
-1.33%
|
5/31/2011
|
$42.00
|
PP = $40.23
|
|
MB = $42.24
|
Most Recent Note - 7/5/2011 2:27:36 PM
Y - Up today for a 3rd consecutive gain, hitting a new all-time high and getting extended from its prior base. Color code is changed to green. Prior highs in the $40-42 area define initial support areas to watch.
>>> The latest Featured Stock Update with an annotated graph appeared on 6/22/2011. Click here.
View all notes |
Alert me of new notes |
CANSLIM.net Company Profile |
SEC |
Zacks Reports |
StockTalk |
News |
Chart |
Request a new note
C
A N
S L
I M
|
Symbol/Exchange
Company Name
Industry Group |
PRICE |
CHANGE
(%Change) |
Day High |
Volume
(% DAV)
(% 50 day avg vol) |
52 Wk Hi
% From Hi |
Featured
Date |
Price
Featured |
Pivot Featured |
|
Max Buy |
FOSL
-
NASDAQ
Fossil Inc
CONSUMER DURABLES - Recreational Goods, Other
|
$124.01
|
+1.38
1.13% |
$124.13
|
610,855
82.43% of 50 DAV
50 DAV is 741,100
|
$123.47
0.44%
|
2/1/2011
|
$73.30
|
PP = $74.44
|
|
MB = $78.16
|
Most Recent Note - 7/1/2011 3:45:43 PM
G - Hitting yet another new all-time high with below average volume behind its gain today , getting more extended from prior highs in the $107 area that now define initial support to watch above its 50 DMA line.
>>> The latest Featured Stock Update with an annotated graph appeared on 6/28/2011. Click here.
View all notes |
Alert me of new notes |
CANSLIM.net Company Profile |
SEC |
Zacks Reports |
StockTalk |
News |
Chart |
Request a new note
C
A N
S L
I M
|
HS
-
NYSE
Healthspring Inc
HEALTH SERVICES - Health Care Plans
|
$48.36
|
+0.10
0.21% |
$48.72
|
717,904
80.00% of 50 DAV
50 DAV is 897,400
|
$48.95
-1.21%
|
6/16/2011
|
$42.44
|
PP = $45.21
|
|
MB = $47.47
|
Most Recent Note - 7/5/2011 2:09:56 PM
G - Up again today with volume running at an above average pace while rising above its "max buy" level. Color code is changed to green after getting extended from its latest base. Prior resistance near $45 defines support after its recent streak of gains with above average volume to new all-time highs.
>>> The latest Featured Stock Update with an annotated graph appeared on 6/16/2011. Click here.
View all notes |
Alert me of new notes |
CANSLIM.net Company Profile |
SEC |
Zacks Reports |
StockTalk |
News |
Chart |
Request a new note
C
A N
S L
I M
|
INFA
-
NASDAQ
Informatica Corp
COMPUTER SOFTWARE and SERVICES - Business Software and Services
|
$61.15
|
+0.29
0.48% |
$62.00
|
1,104,110
88.83% of 50 DAV
50 DAV is 1,243,000
|
$61.12
0.05%
|
7/1/2011
|
$59.36
|
PP = $60.08
|
|
MB = $63.08
|
Most Recent Note - 7/5/2011 2:29:13 PM
Y - Quiet gain today has it inching above its new pivot point recently cited based on its prior high plus 10 cents after a 5-week flat base during which it found support near its 50 DMA line. This high-ranked Computer Software - Database firm faces no overhead supply. A volume-driven breakout may trigger a new (or add-on) technical buy signal.
>>> The latest Featured Stock Update with an annotated graph appeared on 6/17/2011. Click here.
View all notes |
Alert me of new notes |
CANSLIM.net Company Profile |
SEC |
Zacks Reports |
StockTalk |
News |
Chart |
Request a new note
C
A N
S L
I M
|
LULU
-
NASDAQ
Lululemon Athletica
MANUFACTURING - Textile Manufacturing
|
$121.36
|
+2.61
2.20% |
$121.75
|
2,241,685
111.39% of 50 DAV
50 DAV is 2,012,500
|
$119.88
1.23%
|
6/21/2011
|
$102.95
|
PP = $101.14
|
|
MB = $106.20
|
Most Recent Note - 7/6/2011 6:54:08 PM
G - Hit yet another new all-time high today. Its rally of better than +20% in less than 2-3 weeks after its recent technical breakout argues for investors to follow an investment system rule that says to hold stocks with such powerful breakouts for at least 8 weeks minimum and allow for more climactic gains.
>>> The latest Featured Stock Update with an annotated graph appeared on 6/21/2011. Click here.
View all notes |
Alert me of new notes |
CANSLIM.net Company Profile |
SEC |
Zacks Reports |
StockTalk |
News |
Chart |
Request a new note
C
A N
S L
I M
|
MWIV
-
NASDAQ
M W I Veterinary Supply
HEALTH SERVICES - Medical Instruments and; Supplies
|
$83.20
|
+1.13
1.38% |
$83.37
|
42,717
55.77% of 50 DAV
50 DAV is 76,600
|
$86.99
-4.36%
|
11/4/2010
|
$61.79
|
PP = $59.60
|
|
MB = $62.58
|
Most Recent Note - 7/1/2011 4:09:19 PM
G - Gains in recent weeks lacked volume conviction, yet today it quietly climbed above its 50 DMA line which has been acting as a stubborn resistance level.
>>> The latest Featured Stock Update with an annotated graph appeared on 6/30/2011. Click here.
View all notes |
Alert me of new notes |
CANSLIM.net Company Profile |
SEC |
Zacks Reports |
StockTalk |
News |
Chart |
Request a new note
C
A N
S L
I M
|
Symbol/Exchange
Company Name
Industry Group |
PRICE |
CHANGE
(%Change) |
Day High |
Volume
(% DAV)
(% 50 day avg vol) |
52 Wk Hi
% From Hi |
Featured
Date |
Price
Featured |
Pivot Featured |
|
Max Buy |
OPNT
-
NASDAQ
Opnet Technologies
INTERNET - Internet Software and Services
|
$41.03
|
+0.91
2.27% |
$41.10
|
100,697
82.20% of 50 DAV
50 DAV is 122,500
|
$42.51
-3.48%
|
6/28/2011
|
$40.87
|
PP = $42.61
|
|
MB = $44.74
|
Most Recent Note - 7/6/2011 6:49:25 PM
Y - Consolidating above its 50 DMA line. Color code was changed to yellow and a new pivot point cited based on its 52-week high plus ten cents. Disciplined investors watch for a confirming technical buy signal before taking action. Recent lows near $36 define important near-term chart support.
>>> The latest Featured Stock Update with an annotated graph appeared on 7/1/2011. Click here.
View all notes |
Alert me of new notes |
CANSLIM.net Company Profile |
SEC |
Zacks Reports |
StockTalk |
News |
Chart |
Request a new note
C
A N
S L
I M
|
OTEX
-
NASDAQ
Open Text Corp
INTERNET - Internet Software and Services
|
$66.83
|
+1.78
2.74% |
$66.88
|
227,820
73.59% of 50 DAV
50 DAV is 309,600
|
$67.08
-0.37%
|
6/1/2011
|
$65.86
|
PP = $67.18
|
|
MB = $70.54
|
Most Recent Note - 7/6/2011 2:27:16 PM
Y - Today's 7th consecutive gain without great volume conviction helped it inch up very near its 52-week high. Volume-driven gains above the previously cited pivot point may trigger a technical buy signal.
>>> The latest Featured Stock Update with an annotated graph appeared on 6/24/2011. Click here.
View all notes |
Alert me of new notes |
CANSLIM.net Company Profile |
SEC |
Zacks Reports |
StockTalk |
News |
Chart |
Request a new note
C
A N
S L
I M
|
QSII
-
NASDAQ
Quality Systems Inc
COMPUTER SOFTWARE and SERVICES - Healthcare Information Service
|
$90.40
|
-0.02
-0.02% |
$92.38
|
399,267
178.88% of 50 DAV
50 DAV is 223,200
|
$91.57
-1.28%
|
7/6/2011
|
$91.26
|
PP = $91.67
|
|
MB = $96.25
|
Most Recent Note - 7/6/2011
Y - Hit a new all-time high today with its 7th consecutive gain after a lopsided 9-week cup shaped base without a handle. Color code is changed to yellow with a volume driven gain above its pivot point still needed to trigger a new technical buy signal. This long-ago featured Computer Software - Medical firm's earnings and sales increases in the recent quarterly comparisons showed acceleration. It has also maintained a steady and strong annual earnings history (A criteria).

>>> The latest Featured Stock Update with an annotated graph appeared on 7/6/2011. Click here.
View all notes |
Alert me of new notes |
CANSLIM.net Company Profile |
SEC |
Zacks Reports |
StockTalk |
News |
Chart |
Request a new note
C
A N
S L
I M
|
SWI
-
NYSE
Solarwinds Inc
COMPUTER SOFTWARE and SERVICES - Application Software
|
$25.57
|
-0.05
-0.20% |
$25.76
|
970,501
115.12% of 50 DAV
50 DAV is 843,000
|
$26.68
-4.16%
|
6/7/2011
|
$24.22
|
PP = $25.05
|
|
MB = $26.30
|
Most Recent Note - 7/1/2011 4:15:09 PM
Y - Quietly holding its ground between its pivot point and "max buy" level. Prior resistance in the $24-25 area defines support. A subsequent close under its old high close ($24.77 on 4/25/11) would raise concerns by negating its recent breakout.
>>> The latest Featured Stock Update with an annotated graph appeared on 6/29/2011. Click here.
View all notes |
Alert me of new notes |
CANSLIM.net Company Profile |
SEC |
Zacks Reports |
StockTalk |
News |
Chart |
Request a new note
C
A N
S L
I M
|
ULTA
-
NASDAQ
Ulta Salon Cosm & Frag
SPECIALTY RETAIL - Specialty Retail, Other
|
$67.09
|
+0.27
0.40% |
$67.21
|
803,953
95.47% of 50 DAV
50 DAV is 842,100
|
$67.03
0.09%
|
1/6/2011
|
$36.12
|
PP = $37.34
|
|
MB = $39.21
|
Most Recent Note - 7/1/2011 4:16:20 PM
G - Hit yet another new all-time high with a gain on light volume today, getting more extended from any sound base pattern. It may produce more climactic gains, but disciplined investors avoid chasing extended stocks.
>>> The latest Featured Stock Update with an annotated graph appeared on 6/20/2011. Click here.
View all notes |
Alert me of new notes |
CANSLIM.net Company Profile |
SEC |
Zacks Reports |
StockTalk |
News |
Chart |
Request a new note
C
A N
S L
I M
|
Symbol/Exchange
Company Name
Industry Group |
PRICE |
CHANGE
(%Change) |
Day High |
Volume
(% DAV)
(% 50 day avg vol) |
52 Wk Hi
% From Hi |
Featured
Date |
Price
Featured |
Pivot Featured |
|
Max Buy |
ZAGG
-
NASDAQ
Zagg Inc
SPECIALTY RETAIL - Specialty Retail, Other
|
$12.71
|
-1.02
-7.43% |
$13.79
|
4,129,424
216.38% of 50 DAV
50 DAV is 1,908,400
|
$15.85
-19.81%
|
6/1/2011
|
$10.92
|
PP = $10.59
|
|
MB = $11.12
|
Most Recent Note - 7/6/2011 2:21:00 PM
G - Down again today with heavy volume indicative of more distributional pressure. It is has been noted repeatedly as extended from a sound base, and prior highs define initial support to watch on pullbacks.
>>> The latest Featured Stock Update with an annotated graph appeared on 6/23/2011. Click here.
View all notes |
Alert me of new notes |
CANSLIM.net Company Profile |
SEC |
Zacks Reports |
StockTalk |
News |
Chart |
Request a new note
C
A N
S L
I M
|
|
|
|
THESE ARE NOT BUY RECOMMENDATIONS!
Comments contained in the body of this report are technical
opinions only. The material herein has been obtained
from sources believed to be reliable and accurate, however,
its accuracy and completeness cannot be guaranteed.
This site is not an investment advisor, hence it does
not endorse or recommend any securities or other investments.
Any recommendation contained in this report may not
be suitable for all investors and it is not to be deemed
an offer or solicitation on our part with respect to
the purchase or sale of any securities. All trademarks,
service marks and trade names appearing in this report
are the property of their respective owners, and are
likewise used for identification purposes only.
This report is a service available
only to active Paid Premium Members.
You may opt-out of receiving report notifications
at any time. Questions or comments may be submitted
by writing to Premium Membership Services 665 S.E. 10 Street, Suite 201 Deerfield Beach, FL 33441-5634 or by calling 1-800-965-8307
or 954-785-1121.
|
|
|

