You are not logged in.
This means you
CAN ONLY VIEW reports that were published prior to Tuesday, April 15, 2025.
You
MUST UPGRADE YOUR MEMBERSHIP if you want to see any current reports.
AFTER MARKET UPDATE - THURSDAY, JULY 7TH, 2011
Previous After Market Report Next After Market Report >>>
|
|
|
|
DOW |
+93.47 |
12,719.49 |
+0.74% |
|
Volume |
847,852,600 |
+3% |
|
Volume |
1,835,941,580 |
+14% |
|
NASDAQ |
+38.64 |
2,872.66 |
+1.36% |
|
Advancers |
2,335 |
75% |
|
Advancers |
2,007 |
74% |
|
S&P 500 |
+14.00 |
1,353.22 |
+1.05% |
|
Decliners |
679 |
22% |
|
Decliners |
606 |
22% |
|
Russell 2000 |
+12.88 |
858.11 |
+1.52% |
|
52 Wk Highs |
287 |
|
|
52 Wk Highs |
227 |
|
|
S&P 600 |
+6.30 |
461.01 |
+1.39% |
|
52 Wk Lows |
8 |
|
|
52 Wk Lows |
22 |
|
|
 |
Nasdaq Challenging High From Early May After Eight Straight Gains
Kenneth J. Gruneisen - Passed the CAN SLIM® Master's Exam
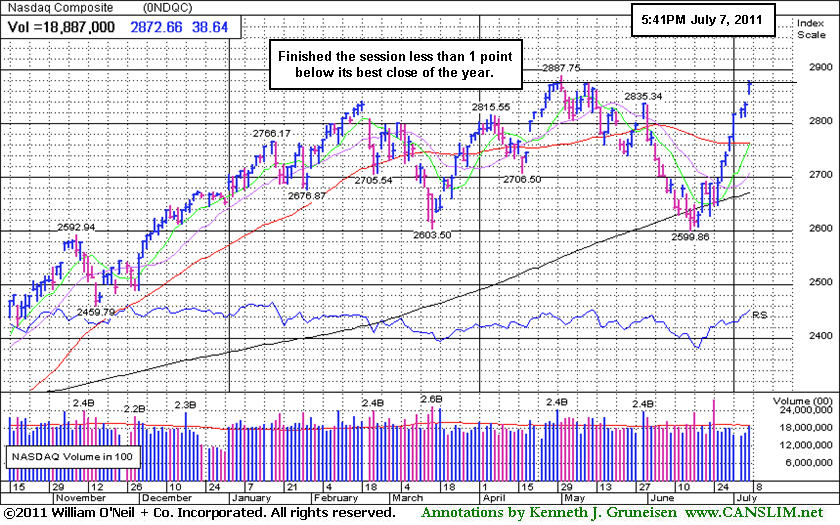
The Nasdaq Composite Index rallied +1.36% on Thursday and extended its winning streak to eight sessions. Volume totals were reported higher than the prior session on the NYSE and on the Nasdaq exchange, a sign indicating a pick up in institutional buying demand for stocks. Advancing issues beat decliners by more than 3-1 on the NYSE and on the Nasdaq exchange. New 52-week highs outnumbered new 52-week lows on both the Nasdaq exchange and the NYSE. There was an expansion to 160 high-ranked companies from the CANSLIM.net Leaders List that made new 52-week highs and appeared on the CANSLIM.net BreakOuts Page, up from the total of 109 on the prior session. There were 12 gainers out of the 16 high-ranked leaders currently included on the Featured Stocks Page.
The major stock averages rallied on encouraging news about employment and retail sales. The government said first-time claims for jobless benefits fell last week to the lowest level in seven weeks. A survey from ADP showed private-sector jobs rose by 157,000 in June, more than doubling estimates. The reports raised expectations for a solid payrolls report on Friday.
Monthly sales results from retailers showed strong improvements in June. Target Corp (TGT +6.67%), Limited Brands, Inc (LTD +2.67%) and Hot Topic (HOTT +13.12%) each reported same-store sales that topped estimates.
Energy stocks including Haliburton Co (HAL +3.11%) benefited from a rally in oil prices as crude jumped back above $98 a barrel. Gold prices rose as the European Central Bank raised interest rates for the second time this year.
The strength in stocks and expansion in the new 52-week highs list have been noted as encouraging signs for growth-oriented investors who might cautiously look to accumulate ideal buy candidates.
Our July 2011 issue of CANSLIM.net News is due to be released soon with a comprehensive summary of current market conditions that further clarifies matters concerning the M criteria! The Q2 2011 CANSLIM.net Webcast is available "ON DEMAND" now to UPGRADED MEMBERS ONLY - (CLICK HERE).
PICTURED: The Nasdaq Composite Index finished the session less than one point below its best close of the year with near average volume behind its 8th consecutive gain.
|
 Kenneth J. Gruneisen started out as a licensed stockbroker in August 1987, a couple of months prior to the historic stock market crash that took the Dow Jones Industrial Average down -22.6% in a single day. He has published daily fact-based fundamental and technical analysis on high-ranked stocks online for two decades. Through FACTBASEDINVESTING.COM, Kenneth provides educational articles, news, market commentary, and other information regarding proven investment systems that work in good times and bad.
Comments contained in the body of this report are technical opinions only and are not necessarily those of Gruneisen Growth Corp. The material herein has been obtained from sources believed to be reliable and accurate, however, its accuracy and completeness cannot be guaranteed. Our firm, employees, and customers may effect transactions, including transactions contrary to any recommendation herein, or have positions in the securities mentioned herein or options with respect thereto. Any recommendation contained in this report may not be suitable for all investors and it is not to be deemed an offer or solicitation on our part with respect to the purchase or sale of any securities. |
|
 |
Retail, Financial, and Tech Shares Enjoy Broad Rally
Kenneth J. Gruneisen - Passed the CAN SLIM® Master's Exam
The Bank Index ($BKX +1.66%) and Broker/Dealer Index ($XBD +1.31%) contributed to Thursday's broad-based rally while notching influential gains. The Semiconductor Index ($SOX +2.09%), Networking Index ($NWX +2.25%), and Internet Index ($IIX +1.37%) set a strong pace for the tech sector, meanwhile the Biotechnology Index ($BTK -0.59%) created a drag and the Healthcare Index ($HMO -0.18%) also finished lower. Commodity-linked groups added to the session's positive bias as the Gold & Silver Index ($XAU +1.00%), Oil Services Index ($OSX +1.05%), and Integrated Oil Index ($XOI +1.54%) posted gains.
Charts courtesy www.stockcharts.com
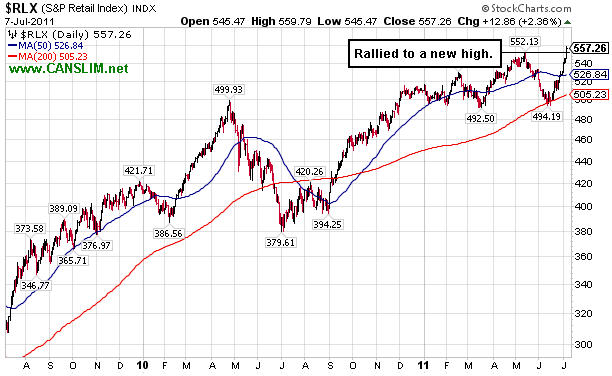
PICTURED: The 2-year chart Retail Index ($RLX +2.36%) illustrates the rally to a new high from recent lows near its 200-day moving average (DMA) line. It went through a deeper correction in 2010, while this latest correction was brief and less damaging, technically.
| Oil Services |
$OSX |
274.29 |
+2.84 |
+1.05% |
+11.90% |
| Healthcare |
$HMO |
2,506.93 |
-4.40 |
-0.18% |
+48.16% |
| Integrated Oil |
$XOI |
1,335.96 |
+20.22 |
+1.54% |
+10.12% |
| Semiconductor |
$SOX |
420.40 |
+8.61 |
+2.09% |
+2.08% |
| Networking |
$NWX |
312.32 |
+6.86 |
+2.25% |
+11.32% |
| Internet |
$IIX |
323.33 |
+4.36 |
+1.37% |
+5.07% |
| Broker/Dealer |
$XBD |
108.80 |
+1.41 |
+1.31% |
-10.46% |
| Retail |
$RLX |
557.26 |
+12.86 |
+2.36% |
+9.61% |
| Gold & Silver |
$XAU |
208.13 |
+2.07 |
+1.00% |
-8.14% |
| Bank |
$BKX |
49.12 |
+0.80 |
+1.66% |
-5.92% |
| Biotech |
$BTK |
1,472.26 |
-8.74 |
-0.59% |
+13.46% |
|
|
|
 |
Perched Near Pivot Point After Eight Consecutive Gains
Kenneth J. Gruneisen - Passed the CAN SLIM® Master's Exam
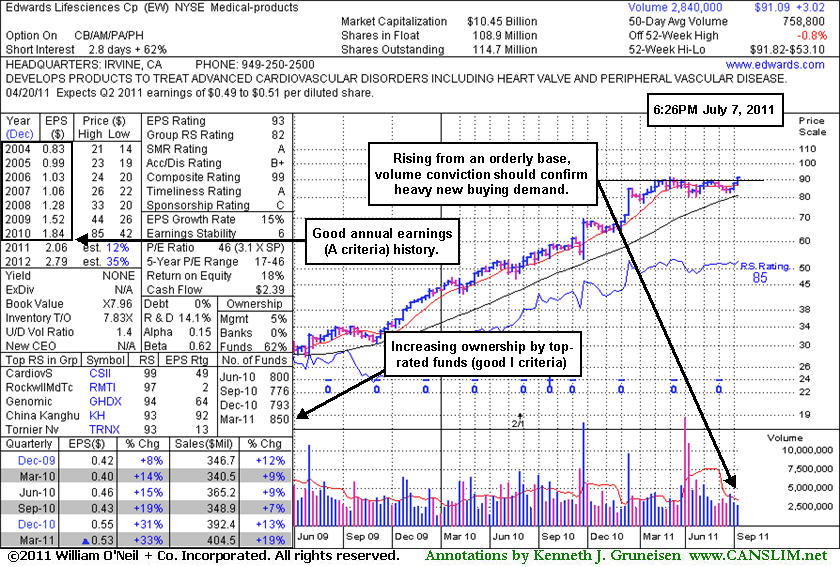
Edwards Lifesciences Cp (EW +$0.24 or +0.26% to $91.09) is a Medical - Products firm challenging its 52-week and all-time highs while posting its 8th consecutive small gain today backed by +28% above average volume. It was featured in yellow in the 7/06/11 mid-day report (read here) with an annotated daily graph while wedging above its pivot point of $90.48 based on its 5/19/11 high plus 10 cents. Disciplined investors would note that a volume driven gain and strong close above its pivot point may trigger a technical buy signal, but it is still too early to say whether that critical proof of new heavy buying demand will show up and confirm a proper buy signal. Volume should be a minimum of +40-50% above average behind a breakout, ideally much heavier, such as several times an average daily volume total.
Recent quarterly comparisons showed accelerating sales revenues and earnings increases, and it has maintained a slow steady annual earnings (A criteria) history. The weekly graph below shows that the number of top-rated funds owning its shares rose from 793 in Dec '10 to 850 Mar '11, a sign of institutional buying demand (the I criteria).
|
|
|
Color Codes Explained :
Y - Better candidates highlighted by our
staff of experts.
G - Previously featured
in past reports as yellow but may no longer be buyable under the
guidelines.
***Last / Change / Volume data in this table is the closing quote data***
Symbol/Exchange
Company Name
Industry Group |
PRICE |
CHANGE
(%Change) |
Day High |
Volume
(% DAV)
(% 50 day avg vol) |
52 Wk Hi
% From Hi |
Featured
Date |
Price
Featured |
Pivot Featured |
|
Max Buy |
CACC
-
NASDAQ
Credit Acceptance Corp
FINANCIAL SERVICES - Credit Services
|
$85.28
|
+0.05
0.06% |
$86.06
|
36,736
86.23% of 50 DAV
50 DAV is 42,600
|
$86.87
-1.83%
|
6/2/2011
|
$76.10
|
PP = $82.39
|
|
MB = $86.51
|
Most Recent Note - 7/5/2011 12:13:29 PM
Y - Pulling back below its "max buy" level with today's loss on higher volume, and its color code is changed to yellow. Approximately 40% of successful breakouts pull back and test support at old highs after a breakout before continuing higher. CACC triggered a technical buy signal with its rally above its pivot point backed by +52% above average volume on 6/30/11. Prior highs in the $80-82 area define initial support to watch on pullbacks.
>>> The latest Featured Stock Update with an annotated graph appeared on 6/27/2011. Click here.
View all notes |
Alert me of new notes |
CANSLIM.net Company Profile |
SEC |
Zacks Reports |
StockTalk |
News |
Chart |
Request a new note
C
A N
S L
I M


|
CMG
-
NYSE
Chipotle Mexican Grill
LEISURE - Restaurants
|
$328.49
|
+3.55
1.09% |
$329.80
|
913,053
96.46% of 50 DAV
50 DAV is 946,600
|
$325.76
0.84%
|
4/1/2011
|
$274.00
|
PP = $275.10
|
|
MB = $288.86
|
 Most Recent Note - 7/7/2011 4:28:50 PM
G - Hit yet another new all-time high today with its 9th gain on below average volume in the span of 10 sessions. Extended from prior highs that define initial chart support to watch.
>>> The latest Featured Stock Update with an annotated graph appeared on 6/15/2011. Click here.
View all notes |
Alert me of new notes |
CANSLIM.net Company Profile |
SEC |
Zacks Reports |
StockTalk |
News |
Chart |
Request a new note
C
A N
S L
I M
|
EW
-
NYSE
Edwards Lifesciences Cp
HEALTH SERVICES - Medical Appliances and Equipment
|
$91.09
|
+0.24
0.26% |
$91.50
|
971,296
128.00% of 50 DAV
50 DAV is 758,800
|
$91.82
-0.80%
|
7/6/2011
|
$89.19
|
PP = $90.48
|
|
MB = $95.00
|
Most Recent Note - 7/7/2011 7:30:19 PM
Y - The Medical - Products firm is challenging its 52-week and all-time highs with 8 consecutive small gains. Color code was changed to yellow, and a volume driven gain and strong close above its pivot point could trigger a technical buy signal. See the latest FSU analysis for more details and a new annotated weekly graph.
>>> The latest Featured Stock Update with an annotated graph appeared on 7/7/2011. Click here.
View all notes |
Alert me of new notes |
CANSLIM.net Company Profile |
SEC |
Zacks Reports |
StockTalk |
News |
Chart |
Request a new note
C
A N
S L
I M
|
EZPW
-
NASDAQ
Ezcorp Inc Cl A
SPECIALTY RETAIL - Specialty Retail, Other
|
$38.07
|
+0.68
1.82% |
$38.43
|
563,380
147.83% of 50 DAV
50 DAV is 381,100
|
$38.66
-1.53%
|
6/13/2011
|
$31.18
|
PP = $33.41
|
|
MB = $35.08
|
Most Recent Note - 7/7/2011 4:39:01 PM
G - Today's 10th consecutive volume-driven gain has it very extended from prior highs in the $33 area that define support to watch on pullbacks.
>>> The latest Featured Stock Update with an annotated graph appeared on 7/5/2011. Click here.
View all notes |
Alert me of new notes |
CANSLIM.net Company Profile |
SEC |
Zacks Reports |
StockTalk |
News |
Chart |
Request a new note
C
A N
S L
I M
|
FCFS
-
NASDAQ
First Cash Financial Svs
SPECIALTY RETAIL - Specialty Retail, Other
|
$44.11
|
+0.37
0.85% |
$44.84
|
186,932
100.02% of 50 DAV
50 DAV is 186,900
|
$44.33
-0.50%
|
5/31/2011
|
$42.00
|
PP = $40.23
|
|
MB = $42.24
|
Most Recent Note - 7/5/2011 2:27:36 PM
Y - Up today for a 3rd consecutive gain, hitting a new all-time high and getting extended from its prior base. Color code is changed to green. Prior highs in the $40-42 area define initial support areas to watch.
>>> The latest Featured Stock Update with an annotated graph appeared on 6/22/2011. Click here.
View all notes |
Alert me of new notes |
CANSLIM.net Company Profile |
SEC |
Zacks Reports |
StockTalk |
News |
Chart |
Request a new note
C
A N
S L
I M
|
Symbol/Exchange
Company Name
Industry Group |
PRICE |
CHANGE
(%Change) |
Day High |
Volume
(% DAV)
(% 50 day avg vol) |
52 Wk Hi
% From Hi |
Featured
Date |
Price
Featured |
Pivot Featured |
|
Max Buy |
FOSL
-
NASDAQ
Fossil Inc
CONSUMER DURABLES - Recreational Goods, Other
|
$123.16
|
-0.85
-0.69% |
$126.36
|
706,602
94.74% of 50 DAV
50 DAV is 745,800
|
$124.13
-0.78%
|
2/1/2011
|
$73.30
|
PP = $74.44
|
|
MB = $78.16
|
Most Recent Note - 7/7/2011 4:30:38 PM
G - Reversed into the red after hitting yet another new all-time high today. It is extended from prior highs in the $107 area that now define initial support to watch near its 50 DMA line.
>>> The latest Featured Stock Update with an annotated graph appeared on 6/28/2011. Click here.
View all notes |
Alert me of new notes |
CANSLIM.net Company Profile |
SEC |
Zacks Reports |
StockTalk |
News |
Chart |
Request a new note
C
A N
S L
I M
|
HS
-
NYSE
Healthspring Inc
HEALTH SERVICES - Health Care Plans
|
$48.09
|
-0.27
-0.56% |
$48.87
|
740,516
82.23% of 50 DAV
50 DAV is 900,500
|
$48.95
-1.76%
|
6/16/2011
|
$42.44
|
PP = $45.21
|
|
MB = $47.47
|
Most Recent Note - 7/5/2011 2:09:56 PM
G - Up again today with volume running at an above average pace while rising above its "max buy" level. Color code is changed to green after getting extended from its latest base. Prior resistance near $45 defines support after its recent streak of gains with above average volume to new all-time highs.
>>> The latest Featured Stock Update with an annotated graph appeared on 6/16/2011. Click here.
View all notes |
Alert me of new notes |
CANSLIM.net Company Profile |
SEC |
Zacks Reports |
StockTalk |
News |
Chart |
Request a new note
C
A N
S L
I M
|
INFA
-
NASDAQ
Informatica Corp
COMPUTER SOFTWARE and SERVICES - Business Software and Services
|
$61.06
|
-0.09
-0.15% |
$62.42
|
1,187,078
96.52% of 50 DAV
50 DAV is 1,229,900
|
$62.00
-1.52%
|
7/1/2011
|
$59.36
|
PP = $60.08
|
|
MB = $63.08
|
Most Recent Note - 7/5/2011 2:29:13 PM
Y - Quiet gain today has it inching above its new pivot point recently cited based on its prior high plus 10 cents after a 5-week flat base during which it found support near its 50 DMA line. This high-ranked Computer Software - Database firm faces no overhead supply. A volume-driven breakout may trigger a new (or add-on) technical buy signal.
>>> The latest Featured Stock Update with an annotated graph appeared on 6/17/2011. Click here.
View all notes |
Alert me of new notes |
CANSLIM.net Company Profile |
SEC |
Zacks Reports |
StockTalk |
News |
Chart |
Request a new note
C
A N
S L
I M
|
LULU
-
NASDAQ
Lululemon Athletica
MANUFACTURING - Textile Manufacturing
|
$121.70
|
+0.34
0.28% |
$123.84
|
2,311,395
113.33% of 50 DAV
50 DAV is 2,039,600
|
$121.75
-0.04%
|
6/21/2011
|
$102.95
|
PP = $101.14
|
|
MB = $106.20
|
Most Recent Note - 7/7/2011 12:33:55 PM
G - Inching higher into new all-time high territory today. Its rally of better than +20% in less than 2-3 weeks after its recent technical breakout argues for investors to follow the investment system of holding stocks with such powerful early gains for 8 weeks minimum.
>>> The latest Featured Stock Update with an annotated graph appeared on 6/21/2011. Click here.
View all notes |
Alert me of new notes |
CANSLIM.net Company Profile |
SEC |
Zacks Reports |
StockTalk |
News |
Chart |
Request a new note
C
A N
S L
I M
|
MWIV
-
NASDAQ
M W I Veterinary Supply
HEALTH SERVICES - Medical Instruments and; Supplies
|
$83.77
|
+0.57
0.69% |
$84.15
|
60,690
81.46% of 50 DAV
50 DAV is 74,500
|
$86.99
-3.70%
|
11/4/2010
|
$61.79
|
PP = $59.60
|
|
MB = $62.58
|
Most Recent Note - 7/1/2011 4:09:19 PM
G - Gains in recent weeks lacked volume conviction, yet today it quietly climbed above its 50 DMA line which has been acting as a stubborn resistance level.
>>> The latest Featured Stock Update with an annotated graph appeared on 6/30/2011. Click here.
View all notes |
Alert me of new notes |
CANSLIM.net Company Profile |
SEC |
Zacks Reports |
StockTalk |
News |
Chart |
Request a new note
C
A N
S L
I M
|
Symbol/Exchange
Company Name
Industry Group |
PRICE |
CHANGE
(%Change) |
Day High |
Volume
(% DAV)
(% 50 day avg vol) |
52 Wk Hi
% From Hi |
Featured
Date |
Price
Featured |
Pivot Featured |
|
Max Buy |
OPNT
-
NASDAQ
Opnet Technologies
INTERNET - Internet Software and Services
|
$41.14
|
+0.11
0.27% |
$41.88
|
96,603
78.35% of 50 DAV
50 DAV is 123,300
|
$42.51
-3.22%
|
6/28/2011
|
$40.87
|
PP = $42.61
|
|
MB = $44.74
|
Most Recent Note - 7/6/2011 6:49:25 PM
Y - Consolidating above its 50 DMA line. Color code was changed to yellow and a new pivot point cited based on its 52-week high plus ten cents. Disciplined investors watch for a confirming technical buy signal before taking action. Recent lows near $36 define important near-term chart support.
>>> The latest Featured Stock Update with an annotated graph appeared on 7/1/2011. Click here.
View all notes |
Alert me of new notes |
CANSLIM.net Company Profile |
SEC |
Zacks Reports |
StockTalk |
News |
Chart |
Request a new note
C
A N
S L
I M
|
OTEX
-
NASDAQ
Open Text Corp
INTERNET - Internet Software and Services
|
$67.62
|
+0.79
1.18% |
$68.67
|
281,446
91.53% of 50 DAV
50 DAV is 307,500
|
$67.08
0.81%
|
6/1/2011
|
$65.86
|
PP = $67.18
|
|
MB = $70.54
|
Most Recent Note - 7/7/2011 11:28:14 AM
Y - Hit a new 52-week high and rallied above its pivot point after a small gap up today, on track for its 8th consecutive gain without great volume conviction. Volume-driven gains above the previously cited pivot point may trigger a technical buy signal.
>>> The latest Featured Stock Update with an annotated graph appeared on 6/24/2011. Click here.
View all notes |
Alert me of new notes |
CANSLIM.net Company Profile |
SEC |
Zacks Reports |
StockTalk |
News |
Chart |
Request a new note
C
A N
S L
I M
|
QSII
-
NASDAQ
Quality Systems Inc
COMPUTER SOFTWARE and SERVICES - Healthcare Information Service
|
$91.16
|
+0.76
0.84% |
$91.47
|
293,845
128.20% of 50 DAV
50 DAV is 229,200
|
$92.38
-1.32%
|
7/6/2011
|
$91.26
|
PP = $91.67
|
|
MB = $96.25
|
Most Recent Note - 7/7/2011 7:33:38 PM
Y - Perched near its all-time high today and it finished at a new high close. Formed a lopsided 9-week cup shaped base without a handle. Color code was changed to yellow in the 7/06/11 mid-day report. A volume-driven gain above its pivot point is still needed to trigger a new technical buy signal. This long-ago featured Computer Software - Medical firm's earnings and sales increases in the recent quarterly comparisons showed acceleration. It has also maintained a steady and strong annual earnings history (A criteria).

>>> The latest Featured Stock Update with an annotated graph appeared on 7/6/2011. Click here.
View all notes |
Alert me of new notes |
CANSLIM.net Company Profile |
SEC |
Zacks Reports |
StockTalk |
News |
Chart |
Request a new note
C
A N
S L
I M
|
SWI
-
NYSE
Solarwinds Inc
COMPUTER SOFTWARE and SERVICES - Application Software
|
$26.30
|
+0.73
2.85% |
$26.43
|
1,263,205
147.74% of 50 DAV
50 DAV is 855,000
|
$26.68
-1.42%
|
6/7/2011
|
$24.22
|
PP = $25.05
|
|
MB = $26.30
|
Most Recent Note - 7/7/2011 4:20:18 PM
G - Gapped up today and rallied to a best ever close with +47% above average volume behind its gain. Color code is changed to green. Prior resistance in the $24-25 area defines support.
>>> The latest Featured Stock Update with an annotated graph appeared on 6/29/2011. Click here.
View all notes |
Alert me of new notes |
CANSLIM.net Company Profile |
SEC |
Zacks Reports |
StockTalk |
News |
Chart |
Request a new note
C
A N
S L
I M
|
ULTA
-
NASDAQ
Ulta Salon Cosm & Frag
SPECIALTY RETAIL - Specialty Retail, Other
|
$66.69
|
-0.40
-0.60% |
$68.80
|
699,829
82.22% of 50 DAV
50 DAV is 851,200
|
$67.21
-0.77%
|
1/6/2011
|
$36.12
|
PP = $37.34
|
|
MB = $39.21
|
Most Recent Note - 7/7/2011 4:32:11 PM
G - Reversed into the red after touching another new all-time high today. Extended from any sound base pattern. It may produce more climactic gains, but disciplined investors avoid chasing extended stocks.
>>> The latest Featured Stock Update with an annotated graph appeared on 6/20/2011. Click here.
View all notes |
Alert me of new notes |
CANSLIM.net Company Profile |
SEC |
Zacks Reports |
StockTalk |
News |
Chart |
Request a new note
C
A N
S L
I M
|
Symbol/Exchange
Company Name
Industry Group |
PRICE |
CHANGE
(%Change) |
Day High |
Volume
(% DAV)
(% 50 day avg vol) |
52 Wk Hi
% From Hi |
Featured
Date |
Price
Featured |
Pivot Featured |
|
Max Buy |
ZAGG
-
NASDAQ
Zagg Inc
SPECIALTY RETAIL - Specialty Retail, Other
|
$12.83
|
+0.12
0.94% |
$13.40
|
6,226,600
318.17% of 50 DAV
50 DAV is 1,957,000
|
$15.85
-19.05%
|
6/1/2011
|
$10.92
|
PP = $10.59
|
|
MB = $11.12
|
Most Recent Note - 7/7/2011 4:35:12 PM
G - Finished today's choppy session with a small gain on heavy volume, up from intra-day lows near its 50 DMA line. Distributional pressure has been noted repeatedly, and it is extended from a sound base.
>>> The latest Featured Stock Update with an annotated graph appeared on 6/23/2011. Click here.
View all notes |
Alert me of new notes |
CANSLIM.net Company Profile |
SEC |
Zacks Reports |
StockTalk |
News |
Chart |
Request a new note
C
A N
S L
I M
|
|
|
|
THESE ARE NOT BUY RECOMMENDATIONS!
Comments contained in the body of this report are technical
opinions only. The material herein has been obtained
from sources believed to be reliable and accurate, however,
its accuracy and completeness cannot be guaranteed.
This site is not an investment advisor, hence it does
not endorse or recommend any securities or other investments.
Any recommendation contained in this report may not
be suitable for all investors and it is not to be deemed
an offer or solicitation on our part with respect to
the purchase or sale of any securities. All trademarks,
service marks and trade names appearing in this report
are the property of their respective owners, and are
likewise used for identification purposes only.
This report is a service available
only to active Paid Premium Members.
You may opt-out of receiving report notifications
at any time. Questions or comments may be submitted
by writing to Premium Membership Services 665 S.E. 10 Street, Suite 201 Deerfield Beach, FL 33441-5634 or by calling 1-800-965-8307
or 954-785-1121.
|
|
|

