You are not logged in.
This means you
CAN ONLY VIEW reports that were published prior to Saturday, April 19, 2025.
You
MUST UPGRADE YOUR MEMBERSHIP if you want to see any current reports.
AFTER MARKET UPDATE - MONDAY, JUNE 27TH, 2022
Previous After Market Report Next After Market Report >>>
|
|
|
|
DOW |
-62.42 |
31,438.26 |
-0.20% |
|
Volume |
991,242,568 |
-69% |
|
Volume |
4,972,331,900 |
-47% |
|
NASDAQ |
-85.20 |
11,522.42 |
-0.73% |
|
Advancers |
1,709 |
54% |
|
Advancers |
2,212 |
49% |
|
S&P 500 |
-11.63 |
3,900.11 |
-0.30% |
|
Decliners |
1,436 |
46% |
|
Decliners |
2,264 |
51% |
|
Russell 2000 |
+6.01 |
1,771.74 |
+0.34% |
|
52 Wk Highs |
14 |
|
|
52 Wk Highs |
26 |
|
|
S&P 600 |
+9.12 |
1,161.44 |
+0.79% |
|
52 Wk Lows |
65 |
|
|
52 Wk Lows |
145 |
|
|
Solid gains from all major averages on Friday with much higher volume, coupled with an increase in the number of stocks hitting new highs, marked a powerful follow-through day confirming a new market uptrend (M criteria). New buying efforts are justified only in stocks meeting all key criteria of the fact-based investment system.
|
 |
Major Averages Fell With Lighter Volume Totals
Kenneth J. Gruneisen - Passed the CAN SLIM® Master's Exam
The S&P 500 slipped 0.3% on the heels of its sharpest single-day rally since May 2020 that had capped its second-best week of the year. The broad benchmark has climbed more than 6.3% since its recent low on June 16, but remains over 18.6% below its all-time high notched in early January. The Dow fell 62 points, while the Nasdaq Composite retreated 0.7% amid weakness in growth-related shares. Volume totals reported were lighter than the prior session on the NYSE and on the Nasdaq exchange. Advancers led decliners by almost a narrow margin on the NYSE while the mix was nearly even on the Nasdaq exchange. There were 12 high-ranked companies from the Leaders List that hit a new 52-week high and were listed on the BreakOuts Page, versus the total of 13 on the prior session. New 52-week lows totals still outnumbered new 52-week highs on the NYSE and on the Nasdaq exchange. Solid gains from all major averages on Friday with much higher volume, coupled with an increase in the number of stocks hitting new highs, marked a powerful follow-through day confirming a new market uptrend (M criteria). Any sustainable rally requires a healthy crop of leading stocks hitting new highs.
Chart courtesy of www.stockcharts.com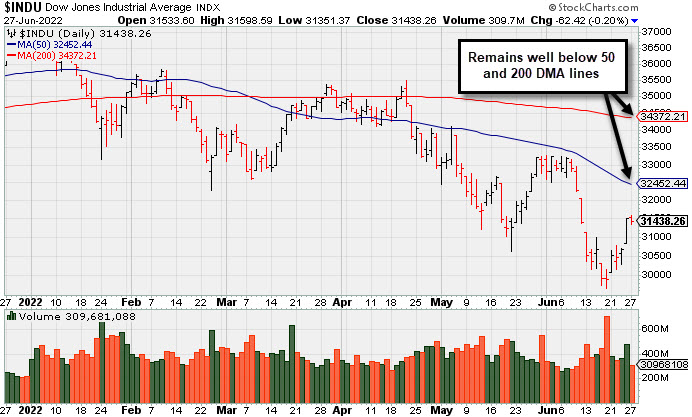 PICTURED: The Dow Jones Industrial Average remains well below its 50-day and 200-day moving average (DMA) lines.
U.S. stocks finished lower on Monday, erasing an early session advance on thinner-than-average trading volume. Eight of 11 S&P 500 sectors closed in negative territory, with Consumer Discretionary leading the decline. Etsy Inc. (ETSY -3.55%) fell after being the subject of an analyst downgrade. Energy shares outperformed, while the more defensive Utilities and Health Care groups also bucked the downtrend.
Treasuries resumed their slump following tepid two- and five-year auctions. The yield on the 10-year note added seven basis points (0.07%) to 3.20%, on course to have jumped 33 basis points (0.33%) in June. In commodities, West Texas Intermediate crude rose 2% to $109.74/barrel, though is still set for its first monthly loss since November (-4.2% in June). The metals complex also stabilized on signs that China’s economy improved this month amid easing COVID-19 restrictions.
On the data front, preliminary May readings showed durable and capital goods orders increased a stronger-than-anticipated 0.7% and 0.5%, respectively. Separately, pending home sales unexpectedly rebounded 0.7% during the same period after sliding 4% in April. Rounding out the docket, an update from the Dallas Fed revealed manufacturing activity in the region deteriorated in June, with the print falling to -17.7 from the prior -7.3 figure.
|
 Kenneth J. Gruneisen started out as a licensed stockbroker in August 1987, a couple of months prior to the historic stock market crash that took the Dow Jones Industrial Average down -22.6% in a single day. He has published daily fact-based fundamental and technical analysis on high-ranked stocks online for two decades. Through FACTBASEDINVESTING.COM, Kenneth provides educational articles, news, market commentary, and other information regarding proven investment systems that work in good times and bad.
Comments contained in the body of this report are technical opinions only and are not necessarily those of Gruneisen Growth Corp. The material herein has been obtained from sources believed to be reliable and accurate, however, its accuracy and completeness cannot be guaranteed. Our firm, employees, and customers may effect transactions, including transactions contrary to any recommendation herein, or have positions in the securities mentioned herein or options with respect thereto. Any recommendation contained in this report may not be suitable for all investors and it is not to be deemed an offer or solicitation on our part with respect to the purchase or sale of any securities. |
|
 |
Commodity-Linked Groups Led Gainers
Kenneth J. Gruneisen - Passed the CAN SLIM® Master's Exam
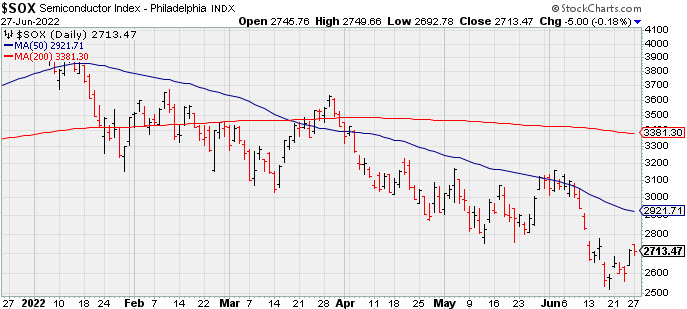
The Broker/Dealer Index ($XBD +0.39%) edged higher but the Retail Index ($RLX -1.58%) and Bank Index ($BKX -0.74%) both created a drag on the major averages. The Semiconductor Index ($SOX -0.20%) ended slightly in then red and the Networking Index ($NWX +0.06%) finished flat while the Biotech Index ($BTK +0.57%) posted a modest gain. Commodity-linked groups had a positive bias as the Oil Services Index ($OSX +4.08%) and Integrated Oil Index ($XOI +3.48%) were standout gainers and the Gold & Silver Index ($XAU +0.77%) edged higher.
PICTURED: The Semiconductor Index ($SOX -0.20%) remains well below its 50-day and 200-day moving average (DMA) lines as it sputters near its 2022 low.
| Oil Services |
$OSX |
67.89 |
+2.66 |
+4.08% |
+28.78% |
| Integrated Oil |
$XOI |
1,531.69 |
+51.48 |
+3.48% |
+30.00% |
| Semiconductor |
$SOX |
2,713.02 |
-5.45 |
-0.20% |
-31.25% |
| Networking |
$NWX |
709.19 |
+0.39 |
+0.06% |
-26.97% |
| Broker/Dealer |
$XBD |
392.46 |
+1.52 |
+0.39% |
-19.39% |
| Retail |
$RLX |
2,995.91 |
-48.09 |
-1.58% |
-29.12% |
| Gold & Silver |
$XAU |
120.25 |
+0.91 |
+0.77% |
-9.21% |
| Bank |
$BKX |
104.28 |
-0.77 |
-0.74% |
-21.13% |
| Biotech |
$BTK |
4,764.83 |
+26.83 |
+0.57% |
-13.66% |
|
|
|
 |
Featured Stocks
Kenneth J. Gruneisen - Passed the CAN SLIM® Master's Exam
|
|
|
Color Codes Explained :
Y - Better candidates highlighted by our
staff of experts.
G - Previously featured
in past reports as yellow but may no longer be buyable under the
guidelines.
***Last / Change / Volume data in this table is the closing quote data***
|
|
|
THESE ARE NOT BUY RECOMMENDATIONS!
Comments contained in the body of this report are technical
opinions only. The material herein has been obtained
from sources believed to be reliable and accurate, however,
its accuracy and completeness cannot be guaranteed.
This site is not an investment advisor, hence it does
not endorse or recommend any securities or other investments.
Any recommendation contained in this report may not
be suitable for all investors and it is not to be deemed
an offer or solicitation on our part with respect to
the purchase or sale of any securities. All trademarks,
service marks and trade names appearing in this report
are the property of their respective owners, and are
likewise used for identification purposes only.
This report is a service available
only to active Paid Premium Members.
You may opt-out of receiving report notifications
at any time. Questions or comments may be submitted
by writing to Premium Membership Services 665 S.E. 10 Street, Suite 201 Deerfield Beach, FL 33441-5634 or by calling 1-800-965-8307
or 954-785-1121.
|
|
|