You are not logged in.
This means you
CAN ONLY VIEW reports that were published prior to Saturday, April 19, 2025.
You
MUST UPGRADE YOUR MEMBERSHIP if you want to see any current reports.
AFTER MARKET UPDATE - TUESDAY, JUNE 28TH, 2022
Previous After Market Report Next After Market Report >>>
|
|
|
|
DOW |
-491.27 |
30,946.99 |
-1.56% |
|
Volume |
929,264,617 |
-6% |
|
Volume |
5,339,310,000 |
+7% |
|
NASDAQ |
-343.01 |
11,181.54 |
-2.98% |
|
Advancers |
940 |
30% |
|
Advancers |
1,207 |
29% |
|
S&P 500 |
-78.54 |
3,821.57 |
-2.01% |
|
Decliners |
2,167 |
70% |
|
Decliners |
2,956 |
71% |
|
Russell 2000 |
-32.90 |
1,738.84 |
-1.86% |
|
52 Wk Highs |
12 |
|
|
52 Wk Highs |
34 |
|
|
S&P 600 |
-17.62 |
1,143.82 |
-1.52% |
|
52 Wk Lows |
89 |
|
|
52 Wk Lows |
191 |
|
|
Solid gains from all major averages on Friday with much higher volume, coupled with an increase in the number of stocks hitting new highs, marked a powerful follow-through day confirming a new market uptrend (M criteria). New buying efforts are justified only in stocks meeting all key criteria of the fact-based investment system.
|
 |
Breadth Negative as Major Indices Fell
Kenneth J. Gruneisen - Passed the CAN SLIM® Master's Exam
The S&P 500 slid 2.0%, settling 20.3% below its most recent January 3 record. The broad benchmark is positioned for its worst quarter since the start of 2020 (-15.6%). The Dow lost 491 points, while the Nasdaq Composite slumped 3.0% amid weakness in mega-cap tech names. Volume totals reported were mixed, lighter than the prior session on the NYSE and higher on the Nasdaq exchange. Decliners led advancers by more than a 2-1 margin on the NYSE and 5-2 on the Nasdaq exchange. There were 11 high-ranked companies from the Leaders List that hit a new 52-week high and were listed on the BreakOuts Page, versus the total of 12 on the prior session. New 52-week lows totals still outnumbered new 52-week highs on the NYSE and on the Nasdaq exchange. Solid gains from all major averages on Friday with much higher volume, coupled with an increase in the number of stocks hitting new highs, marked a powerful follow-through day confirming a new market uptrend (M criteria). Any sustainable rally requires a healthy crop of leading stocks hitting new highs.
Chart courtesy of www.stockcharts.com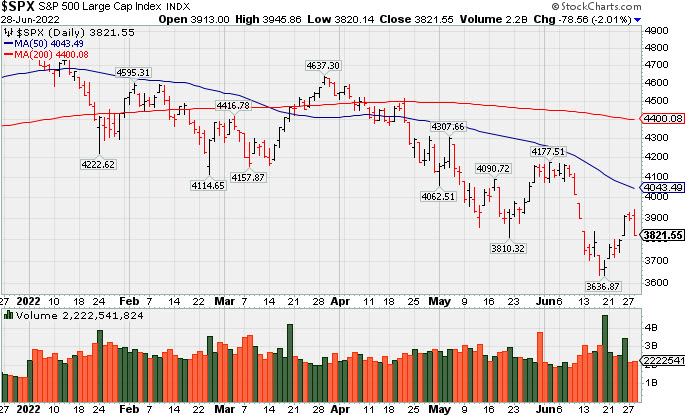 PICTURED: The S&P 500 Index remains well below its 50-day and 200-day moving average (DMA) lines.
U.S. stocks finished sharply lower on Tuesday, reversing early session gains as a drop in domestic consumer confidence overshadowed reopening optimism in China. On the data front, the Conference Board’s closely watched gauge of consumer confidence dropped more than anticipated in June to 98.7, the lowest level in 16 months. Furthermore, a measure of expectations deteriorated to a trough not seen in almost a decade. Meanwhile, the S&P CoreLogic Case-Shiller national home price index showed growth slowed for the first time since 2021 in April. Rounding out the docket, an update from the Richmond Fed revealed manufacturing activity in the region unexpectedly worsened in June. Treasuries were little changed, with the yield on the 10-year note down two basis points (0.02%) to 3.18%.
Ten of 11 S&P 500 sectors closed in negative territory, with Energy the lone advancer. West Texas Intermediate crude climbed 1.9% to $111.70/barrel, trimming its month-to-date losses to 2.5%. Consumer Discretionary led the decline, though casino operators with exposure to Macau bucked the downtrend after China eased its strict COVID-19 quarantine rules for international travelers. In corporate news, Nike Inc. (NKE -6.99%) fell following disappointing current-quarter sales guidance. Qualcomm Inc. (QCOM +3.48%) provided a bright spot, rising amid speculation the chipmaker would remain a key supplier to Apple Inc. (AAPL -2.98%) through 2023.
|
 Kenneth J. Gruneisen started out as a licensed stockbroker in August 1987, a couple of months prior to the historic stock market crash that took the Dow Jones Industrial Average down -22.6% in a single day. He has published daily fact-based fundamental and technical analysis on high-ranked stocks online for two decades. Through FACTBASEDINVESTING.COM, Kenneth provides educational articles, news, market commentary, and other information regarding proven investment systems that work in good times and bad.
Comments contained in the body of this report are technical opinions only and are not necessarily those of Gruneisen Growth Corp. The material herein has been obtained from sources believed to be reliable and accurate, however, its accuracy and completeness cannot be guaranteed. Our firm, employees, and customers may effect transactions, including transactions contrary to any recommendation herein, or have positions in the securities mentioned herein or options with respect thereto. Any recommendation contained in this report may not be suitable for all investors and it is not to be deemed an offer or solicitation on our part with respect to the purchase or sale of any securities. |
|
 |
Energy-Linked Groups Rose Amid Widespread Weakness
Kenneth J. Gruneisen - Passed the CAN SLIM® Master's Exam
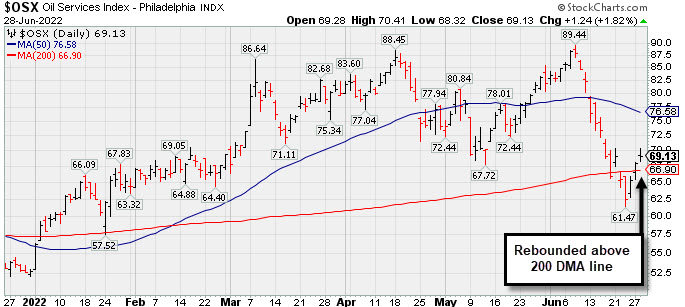
The Retail Index ($RLX -4.46%) created a big drag on the major averages while the Bank Index ($BKX -0.48%) and Broker/Dealer Index ($XBD -0.59%) both suffered modest losses. The tech sector had a negative bias as the Semiconductor Index ($SOX -2.63%), Networking Index ($NWX -2.55%), and Biotech Index ($BTK -2.60%) suffered unanimous losses. Commodity-linked groups were mixed as the Oil Services Index ($OSX +1.82%) and Integrated Oil Index ($XOI +3.11%) both posted solid gains while the Gold & Silver Index ($XAU -2.66%) slumped.
PICTURED: The Oil Services Index ($OSX +1.82%) rebounded above its 200-day moving average (DMA) line with 3 consecutive gains.
| Oil Services |
$OSX |
69.13 |
+1.24 |
+1.82% |
+31.13% |
| Integrated Oil |
$XOI |
1,579.36 |
+47.67 |
+3.11% |
+34.05% |
| Semiconductor |
$SOX |
2,642.07 |
-71.40 |
-2.63% |
-33.05% |
| Networking |
$NWX |
691.08 |
-18.11 |
-2.55% |
-28.83% |
| Broker/Dealer |
$XBD |
390.14 |
-2.31 |
-0.59% |
-19.87% |
| Retail |
$RLX |
2,862.39 |
-133.52 |
-4.46% |
-32.27% |
| Gold & Silver |
$XAU |
117.05 |
-3.20 |
-2.66% |
-11.63% |
| Bank |
$BKX |
103.78 |
-0.50 |
-0.48% |
-21.51% |
| Biotech |
$BTK |
4,640.86 |
-123.96 |
-2.60% |
-15.90% |
|
|
|
 |
|
|
|
Color Codes Explained :
Y - Better candidates highlighted by our
staff of experts.
G - Previously featured
in past reports as yellow but may no longer be buyable under the
guidelines.
***Last / Change / Volume data in this table is the closing quote data***
|
|
|
THESE ARE NOT BUY RECOMMENDATIONS!
Comments contained in the body of this report are technical
opinions only. The material herein has been obtained
from sources believed to be reliable and accurate, however,
its accuracy and completeness cannot be guaranteed.
This site is not an investment advisor, hence it does
not endorse or recommend any securities or other investments.
Any recommendation contained in this report may not
be suitable for all investors and it is not to be deemed
an offer or solicitation on our part with respect to
the purchase or sale of any securities. All trademarks,
service marks and trade names appearing in this report
are the property of their respective owners, and are
likewise used for identification purposes only.
This report is a service available
only to active Paid Premium Members.
You may opt-out of receiving report notifications
at any time. Questions or comments may be submitted
by writing to Premium Membership Services 665 S.E. 10 Street, Suite 201 Deerfield Beach, FL 33441-5634 or by calling 1-800-965-8307
or 954-785-1121.
|
|
|