You are not logged in.
This means you
CAN ONLY VIEW reports that were published prior to Saturday, April 19, 2025.
You
MUST UPGRADE YOUR MEMBERSHIP if you want to see any current reports.
AFTER MARKET UPDATE - FRIDAY, JUNE 24TH, 2022
Previous After Market Report Next After Market Report >>>
|
|
|
|
DOW |
+823.32 |
31,500.68 |
+2.68% |
|
Volume |
3,199,689,900 |
+193% |
|
Volume |
9,426,000,800 |
+79% |
|
NASDAQ |
+375.43 |
11,607.62 |
+3.34% |
|
Advancers |
2,558 |
82% |
|
Advancers |
2,700 |
65% |
|
S&P 500 |
+116.01 |
3,911.74 |
+3.06% |
|
Decliners |
555 |
18% |
|
Decliners |
1,476 |
35% |
|
Russell 2000 |
+54.06 |
1,765.74 |
+3.16% |
|
52 Wk Highs |
10 |
|
|
52 Wk Highs |
33 |
|
|
S&P 600 |
+34.65 |
1,152.32 |
+3.10% |
|
52 Wk Lows |
68 |
|
|
52 Wk Lows |
148 |
|
|
Solid gains from all major averages on Friday with much higher volume, coupled with an increase in the number of stocks hitting new highs, marked a powerful follow-through day confirming a new market uptrend (M criteria). New buying efforts are justified only in stocks meeting all key criteria of the fact-based investment system.
|
 |
Major Averages Rallied With Higher Volume Confirming New Uptrend
Kenneth J. Gruneisen - Passed the CAN SLIM® Master's Exam
The S&P 500 jumped 3.1%, its sharpest single-session rally since May 2020, to cap a 6.5% weekly gain--its best showing in a month. The Nasdaq Composite soared 3.3%, bringing the tech-heavy index 7.5% higher for the week--its strongest performance since mid-March. The Dow climbed 823 points, notching a 5.4% increase since last Friday’s (June 17) close. Volume totals reported were much higher than the prior session on the NYSE and on the Nasdaq exchange, indicating an increase in institutional buying demand. Advancers led decliners by almost a 5-1 margin on the NYSE and nearly 2-1 on the Nasdaq exchange. Leadership improved as there were 13 high-ranked companies from the Leaders List that hit a new 52-week high and were listed on the BreakOuts Page, versus the total of 5 on the prior session. New 52-week lows totals contracted yet still outnumbered new 52-week highs on the NYSE and on the Nasdaq exchange. Solid gains from all major averages on Friday with much higher volume, coupled with an increase in the number of stocks hitting new highs, marked a powerful follow-through day confirming a new market uptrend (M criteria). Any sustainable rally requires a healthy crop of leading stocks hitting new highs.
Chart courtesy of www.stockcharts.com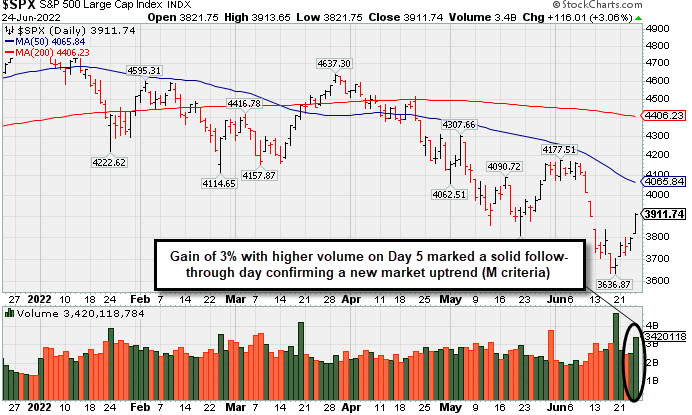 PICTURED: The S&P 500 Index posted a +3.06% gain with higher volume and an increase in the number of stocks hitting new highs, marking a solid follow-through on Day 5 of the new rally. The action serves as a confirmation day for a new market uptrend (M criteria).
U.S. stocks finished sharply higher on Friday, halting a three-week slide as Wall Street scaled back expectations for ultra-aggressive monetary policy tightening by the Federal Reserve (Fed). On the data front, a final June reading from the University of Michigan showed its measure of consumer sentiment was downwardly revised to a record low, though longer-term inflation expectations eased from an initially reported 14-year high. The update added credence to the hope that price pressures and steep rate hikes could peak sooner than anticipated. Also aiding the mood, St. Louis Fed President Bullard, one of the central bank’s most hawkish members, suggested that recession worries were overblown as consumer balance sheets were healthy.
Treasuries weakened, with the yield on the 10-year note up four basis points (0.04%) to 3.13%, paring its weekly pullback to 10 basis points (0.10%). In commodities, West Texas Intermediate crude trimmed a second straight weekly decline, settling at $107.56/barrel.
All 11 S&P 500 sectors closed in positive territory, with cyclical and growth-related shares outpacing defensive groups. Cruise line operators were also among the standouts after Carnival Corp. (CCL +12.44%) rallied after upbeat commentary around bookings. In earnings, FedEx Corp. (FDX +6.62%) rose on better-than-expected guidance.
|
 Kenneth J. Gruneisen started out as a licensed stockbroker in August 1987, a couple of months prior to the historic stock market crash that took the Dow Jones Industrial Average down -22.6% in a single day. He has published daily fact-based fundamental and technical analysis on high-ranked stocks online for two decades. Through FACTBASEDINVESTING.COM, Kenneth provides educational articles, news, market commentary, and other information regarding proven investment systems that work in good times and bad.
Comments contained in the body of this report are technical opinions only and are not necessarily those of Gruneisen Growth Corp. The material herein has been obtained from sources believed to be reliable and accurate, however, its accuracy and completeness cannot be guaranteed. Our firm, employees, and customers may effect transactions, including transactions contrary to any recommendation herein, or have positions in the securities mentioned herein or options with respect thereto. Any recommendation contained in this report may not be suitable for all investors and it is not to be deemed an offer or solicitation on our part with respect to the purchase or sale of any securities. |
|
 |
Financial, Retail, Tech, and Commodity-Linked Groups Rose
Kenneth J. Gruneisen - Passed the CAN SLIM® Master's Exam
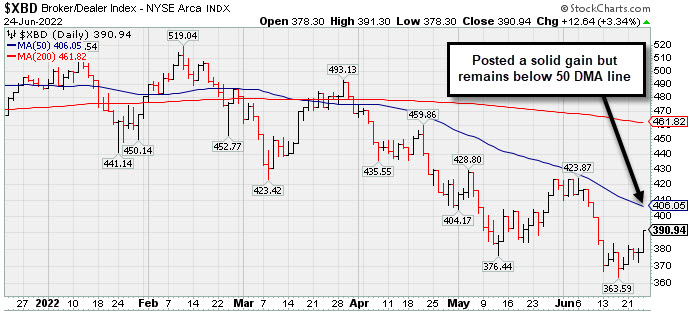
The Bank Index ($BKX +4.24%), Broker/Dealer Index ($XBD +3.34%), and Retail Index ($RLX +3.36%) all posted solid gains which underpinned the major averages' new rally. The Semiconductor Index ($SOX +4.45%) led the tech sector higher, followed by the Networking Index ($NWX +2.98%) and the Biotech Index ($BTK +1.72%). The Gold & Silver Index ($XAU +3.05%), Oil Services Index ($OSX +4.56%), and Integrated Oil Index ($XOI +1.77%) posted unanimous gains.
PICTURED: The Broker/Dealer Index ($XBD +3.34%) posted a solid gain but remains below its 50-day moving average (DMA) line as it recovers from its 2022 low.
| Oil Services |
$OSX |
65.23 |
+2.84 |
+4.56% |
+23.74% |
| Integrated Oil |
$XOI |
1,480.22 |
+25.76 |
+1.77% |
+25.63% |
| Semiconductor |
$SOX |
2,718.47 |
+115.73 |
+4.45% |
-31.11% |
| Networking |
$NWX |
708.80 |
+20.53 |
+2.98% |
-27.01% |
| Broker/Dealer |
$XBD |
390.94 |
+12.64 |
+3.34% |
-19.70% |
| Retail |
$RLX |
3,044.00 |
+98.99 |
+3.36% |
-27.98% |
| Gold & Silver |
$XAU |
119.34 |
+3.53 |
+3.05% |
-9.90% |
| Bank |
$BKX |
105.06 |
+4.28 |
+4.24% |
-20.54% |
| Biotech |
$BTK |
4,738.00 |
+80.08 |
+1.72% |
-14.14% |
|
|
|
 |
Featured Stocks
Kenneth J. Gruneisen - Passed the CAN SLIM® Master's Exam
|
|
|
Color Codes Explained :
Y - Better candidates highlighted by our
staff of experts.
G - Previously featured
in past reports as yellow but may no longer be buyable under the
guidelines.
***Last / Change / Volume data in this table is the closing quote data***
|
|
|
THESE ARE NOT BUY RECOMMENDATIONS!
Comments contained in the body of this report are technical
opinions only. The material herein has been obtained
from sources believed to be reliable and accurate, however,
its accuracy and completeness cannot be guaranteed.
This site is not an investment advisor, hence it does
not endorse or recommend any securities or other investments.
Any recommendation contained in this report may not
be suitable for all investors and it is not to be deemed
an offer or solicitation on our part with respect to
the purchase or sale of any securities. All trademarks,
service marks and trade names appearing in this report
are the property of their respective owners, and are
likewise used for identification purposes only.
This report is a service available
only to active Paid Premium Members.
You may opt-out of receiving report notifications
at any time. Questions or comments may be submitted
by writing to Premium Membership Services 665 S.E. 10 Street, Suite 201 Deerfield Beach, FL 33441-5634 or by calling 1-800-965-8307
or 954-785-1121.
|
|
|