You are not logged in.
This means you
CAN ONLY VIEW reports that were published prior to Tuesday, April 15, 2025.
You
MUST UPGRADE YOUR MEMBERSHIP if you want to see any current reports.
AFTER MARKET UPDATE - THURSDAY, JUNE 3RD, 2010
Previous After Market Report Next After Market Report >>>
|
|
|
|
DOW |
+5.74 |
10,255.28 |
+0.06% |
|
Volume |
1,221,679,010 |
-10% |
|
Volume |
2,132,119,030 |
+2% |
|
NASDAQ |
+21.96 |
2,303.03 |
+0.96% |
|
Advancers |
1,924 |
61% |
|
Advancers |
1,656 |
60% |
|
S&P 500 |
+4.45 |
1,102.83 |
+0.41% |
|
Decliners |
1,094 |
35% |
|
Decliners |
1,004 |
36% |
|
Russell 2000 |
+6.85 |
667.37 |
+1.04% |
|
52 Wk Highs |
54 |
|
|
52 Wk Highs |
52 |
|
|
S&P 600 |
+4.05 |
356.68 |
+1.15% |
|
52 Wk Lows |
8 |
|
|
52 Wk Lows |
27 |
|
|
 |
New Highs List Expanding As New Rally Gets Foothold
Adam Sarhan, Contributing Writer,
Stocks closed higher as investors digested a slew of mixed economic data. Volume totals in the US markets were reported mixed compared to Wednesday's totals; slightly higher on the Nasdaq exchange and lower on the NYSE. Advancers led decliners by almost a 2-to-1 ratio on the NYSE and by more than a 3-to-2 ratio on the Nasdaq exchange. There were 28 high-ranked companies from the CANSLIM.net Leaders List that made a new 52-week high and appeared on the CANSLIM.net BreakOuts Page, higher than the 10 issues that appeared on the prior session. New 52-week highs outnumbered new 52-week lows on the NYSE and the Nasdaq exchange. The expansion in leadership was a welcome sign that bodes well for the new rally effort.
Thursday's economic news did little to move the market: Retail sales lagged, weekly jobless claims slid, and the ISM service index rose. The Labor Department said jobless claims fell by -10,000 to 453,000 last week and the ADP Employer Services report, based on private-sector payrolls, rose by +55,000 jobs. The ADP reading fell short of the Street's +70,000 estimate. Before Friday's opening bell, the Labor Department is slated to released last month's payrolls report. Economists believe that payrolls rose +523,000 in May which would be the fifth consecutive monthly increase and the largest reading since 1983. Meanwhile, the Institute for Supply Management’s index of non-manufacturing businesses, which currently comprises approximately +90% of the economy, held steady at 55.4 for a third month.
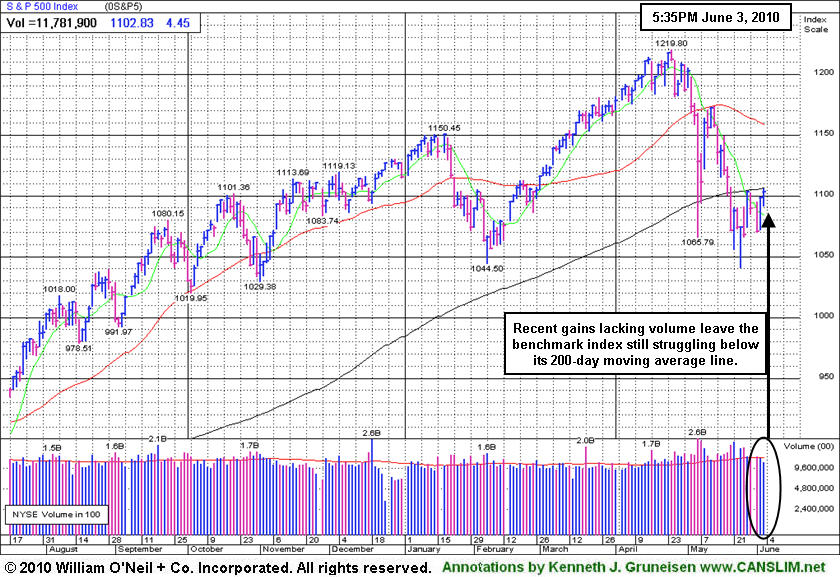
The author of "How To Make Money In Stocks", the book that explains the fact-based investment system, has observed in the past that a market should not be considered to be in "healthy" shape unless at least 2 of the 3 major averages are trading above their rising 200-day moving average (DMA) lines. Only the Nasdaq Composite Index is currently above its long-term average, meanwhile the S&P 500 and Dow are encountering resistance. In addition, the newspaper said that Wednesday's gain with higher volume for the Nasdaq Composite Index marked a follow-through day for that index. We have received numerous emails and phone calls inquiring about the discrepancy in yesterday's report, as the prior commentary published here failed to trumpet the session as a proper follow-through-day (FTD). The simple fact is that the paper is using May 25, 2010 as "Day 1" for the Nasdaq Composite even though it closed lower on the day. From their perspective, the "essence of Day 1" occurred, and that sufficed.
It would be very encouraging to see a proper follow-through-day (FTD) emerge for the benchmark S&P 500 and the Dow Jones Industrial Average to offer additional confirmation of a hearty new rally. Yet, acknowledging that we have a new confirmed rally based on the latest market improvements, the window is now considered to be open again to begin buying high-ranked stocks that trigger new technical buy signals. If you have any further questions on this matter or would like to discuss your portfolio, please feel free to contact me directly.
Professional Money Management Services - Free Portfolio Review:
If your portfolio is greater than $100,000 and you would like a free portfolio review, click here to get connected with one of our portfolio managers. ** Serious inquires only, please.
PICTURED: The gains lacking volume leave the benchmark index still struggling below its 200-day moving average line.
|
|
|
 |
Healthcare Group And Tech Sector Trade Up
Kenneth J. Gruneisen - Passed the CAN SLIM® Master's Exam
Financial shares were mixed as the Bank Index ($BKX -0.78%) fell, meanwhile the Broker/Dealer Index ($XBD +0.46%) posted a small gain along with the Retail Index ($RLX +0.18%). The tech sector was led higher by the Internet Index ($IIX +1.72%), while the Semiconductor Index ($SOX +1.18%), Biotechnology Index ($BTK +1.08%), and Networking Index ($NWX +0.88%) also rose. Gains in energy-related shares boosted the Oil Services Index ($OSX +0.82%) and the Integrated Oil Index ($XOI +1.29%). The Healthcare Index ($HMO +2.22%) also posted a solid gain, but the Gold & Silver Index ($XAU -2.16%) provided "safe haven" investors with one of the session's larger losses.
Charts courtesy www.stockcharts.com
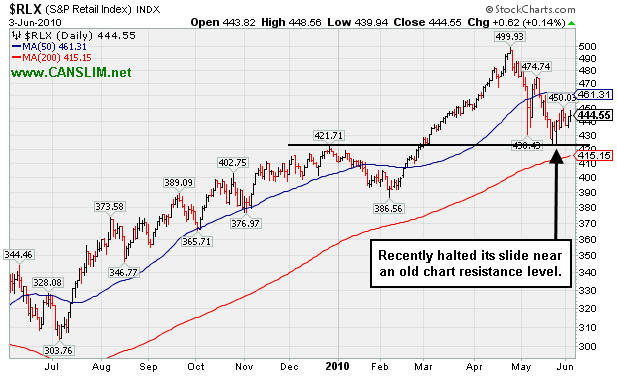
PICTURED: The Retail Index ($RLX +0.18%) recently halted its slide near an old chart resistance level.
| Oil Services |
$OSX |
169.27 |
+1.38 |
+0.82% |
-13.16% |
| Healthcare |
$HMO |
1,539.70 |
+33.50 |
+2.22% |
+4.53% |
| Integrated Oil |
$XOI |
955.74 |
+12.21 |
+1.29% |
-10.53% |
| Semiconductor |
$SOX |
364.45 |
+4.25 |
+1.18% |
+1.26% |
| Networking |
$NWX |
240.79 |
+2.10 |
+0.88% |
+4.21% |
| Internet |
$IIX |
242.46 |
+4.10 |
+1.72% |
+3.68% |
| Broker/Dealer |
$XBD |
109.81 |
+0.50 |
+0.46% |
-4.56% |
| Retail |
$RLX |
444.73 |
+0.80 |
+0.18% |
+8.18% |
| Gold & Silver |
$XAU |
173.21 |
-3.82 |
-2.16% |
+2.95% |
| Bank |
$BKX |
49.84 |
-0.39 |
-0.78% |
+16.69% |
| Biotech |
$BTK |
1,085.57 |
+11.64 |
+1.08% |
+15.23% |
|
|
|
 |
Consolidation After Breakout From Choppy 5-Week Base
Kenneth J. Gruneisen - Passed the CAN SLIM® Master's Exam
Thoratec Corp (THOR -$1.25 or -2.75% to $44.21) pulled back today after breaking out from a choppy 5-week base with a considerable gain on 6/02/10 backed by above average volume. Today's close leaves it -4.9% off its all-time high reached on the prior session. Healthy stocks typically do not slump back below their pivot point by more than -7% in a bullish market environment. In addition to its technical strength, recent quarterly comparisons showed impressive acceleration in its sales revenues increases while earnings above the +25% minimum guideline satisfied the C criteria. If the latest confirmed rally produces some strong performing leaders, this high-ranked Medical - Products firm could be among the winners. No overhead supply exists to act as resistance.
Based on weakness it was dropped from the Featured Stocks list on 2/23/09, yet it has shown especially bullish action since its breakout on 3/05/10. It was mentioned long ago in a 12/15/08 interview on WBBM 780AM - (listen here) and it was featured in yellow in the 12/05/08 Mid-Day Breakouts Report (read here) THOR had rebounded impressively after being featured in the past, then subsequently dropped from the CANSLIM.net Featured Stocks list on 2/2/2006.

|
|
|
Color Codes Explained :
Y - Better candidates highlighted by our
staff of experts.
G - Previously featured
in past reports as yellow but may no longer be buyable under the
guidelines.
***Last / Change / Volume data in this table is the closing quote data***
Symbol/Exchange
Company Name
Industry Group |
PRICE |
CHANGE
(%Change) |
Day High |
Volume
(% DAV)
(% 50 day avg vol) |
52 Wk Hi
% From Hi |
Featured
Date |
Price
Featured |
Pivot Featured |
|
Max Buy |
BIDU
-
NASDAQ
Baidu Inc Ads
INTERNET - Internet Information Providers
|
$76.66
|
+0.68
0.90% |
$77.97
|
14,223,851
85.42% of 50 DAV
50 DAV is 16,651,500
|
$82.29
-6.84%
|
1/13/2010
|
$43.13
|
PP = $42.68
|
|
MB = $44.81
|
 Most Recent Note - 6/3/2010 4:05:26 PM
G - Gain on light volume for a third session in a row, finishing today at its second highest close ever. It is extended from any sound base. A worrisome negative reversal from its all-time high on 5/13/10 followed a 10:1 stock split.
>>> The latest Featured Stock Update with an annotated graph appeared on 6/1/2010. Click here.
View all notes |
Alert me of new notes |
CANSLIM.net Company Profile |
SEC |
Zacks Reports |
StockTalk |
News |
Chart |
Request a new note
C
A N
S L
I M


|
BRLI
-
NASDAQ
Bio Reference Labs Inc
HEALTH SERVICES - Medical Laboratories and Researc
|
$23.39
|
+0.30
1.30% |
$23.75
|
148,138
77.48% of 50 DAV
50 DAV is 191,200
|
$24.67
-5.20%
|
2/12/2010
|
$39.02
|
PP = $20.49
|
|
MB = $21.51
|
Most Recent Note - 6/3/2010 3:52:41 PM
G - Gapped up today, rallying further above its 50 DMA line to now trade within -4.4% of its all-time high. It reported sales revenues and earnings increases near the +25% minimum guideline for the latest quarter ended April 30, 2010 versus the year ago period. Consolidating for about 6 weeks since a 2:1 stock split effective on 4/22/10.
>>> The latest Featured Stock Update with an annotated graph appeared on 5/26/2010. Click here.
View all notes |
Alert me of new notes |
CANSLIM.net Company Profile |
SEC |
Zacks Reports |
StockTalk |
News |
Chart |
Request a new note
C
A N
S L
I M
|
CRM
-
NYSE
Salesforce.Com Inc
INTERNET - Internet Software and Services
|
$95.20
|
+6.76
7.64% |
$95.78
|
6,636,869
310.90% of 50 DAV
50 DAV is 2,134,700
|
$89.84
5.97%
|
6/2/2010
|
$88.44
|
PP = $89.60
|
|
MB = $94.08
|
Most Recent Note - 6/3/2010 12:30:08 PM
Y - Gapped up today, rallying to new all-time high territory with above average volume. Color code was changed to yellow with new pivot point cited after recent gains including its positive reversal on 5/21/10. For the quarter ended April 30, 2010 it showed only a +7% earnings per share increase, a difficult comparison marking its first increase below the +25% minimum guideline in years.
>>> The latest Featured Stock Update with an annotated graph appeared on 6/2/2010. Click here.
View all notes |
Alert me of new notes |
CANSLIM.net Company Profile |
SEC |
Zacks Reports |
StockTalk |
News |
Chart |
Request a new note
C
A N
S L
I M
|
LL
-
NYSE
Lumber Liquidators Hldgs
RETAIL - Home Improvement Stores
|
$30.07
|
+0.82
2.80% |
$30.39
|
387,402
107.19% of 50 DAV
50 DAV is 361,400
|
$33.41
-10.00%
|
4/22/2010
|
$29.87
|
PP = $29.03
|
|
MB = $30.48
|
Most Recent Note - 6/3/2010 3:47:33 PM
G - Overcame recent weakness below its 50 DMA line and December '09 highs, and it has rebounded to within -10% of its 52-week high. A "negative reversal" on 4/26/10 marked its all-time high.
>>> The latest Featured Stock Update with an annotated graph appeared on 5/19/2010. Click here.
View all notes |
Alert me of new notes |
CANSLIM.net Company Profile |
SEC |
Zacks Reports |
StockTalk |
News |
Chart |
Request a new note
C
A N
S L
I M
|
LOPE
-
NASDAQ
Grand Canyon Education
DIVERSIFIED SERVICES - Education and; Training Services
|
$24.97
|
-0.07
-0.28% |
$25.30
|
494,796
114.56% of 50 DAV
50 DAV is 431,900
|
$28.46
-12.26%
|
4/13/2010
|
$27.71
|
PP = $27.33
|
|
MB = $28.70
|
Most Recent Note - 6/3/2010 3:55:12 PM
G - Still struggling below its 50 DMA line which is now acting as a resistance level. Now -12% off its 52-week high, it has been consolidating for an 8-week period since peaking on 4/13/10. Technically, its 4/29/10 low of $23.66 is the next important chart support.
>>> The latest Featured Stock Update with an annotated graph appeared on 5/27/2010. Click here.
View all notes |
Alert me of new notes |
CANSLIM.net Company Profile |
SEC |
Zacks Reports |
StockTalk |
News |
Chart |
Request a new note
C
A N
S L
I M
|
Symbol/Exchange
Company Name
Industry Group |
PRICE |
CHANGE
(%Change) |
Day High |
Volume
(% DAV)
(% 50 day avg vol) |
52 Wk Hi
% From Hi |
Featured
Date |
Price
Featured |
Pivot Featured |
|
Max Buy |
MELI
-
NASDAQ
Mercadolibre Inc
INTERNET - Internet Software and; Services
|
$55.90
|
+2.60
4.88% |
$56.16
|
887,965
137.65% of 50 DAV
50 DAV is 645,100
|
$55.75
0.27%
|
5/13/2010
|
$54.21
|
PP = $55.85
|
|
MB = $58.64
|
Most Recent Note - 6/3/2010 3:40:08 PM
Y - Gapped up today, rallying near its 52-week high, and its color code is changed to yellow. A powerful gain above its pivot point may confirm a new technical buy signal.
>>> The latest Featured Stock Update with an annotated graph appeared on 5/28/2010. Click here.
View all notes |
Alert me of new notes |
CANSLIM.net Company Profile |
SEC |
Zacks Reports |
StockTalk |
News |
Chart |
Request a new note
C
A N
S L
I M
|
ROVI
-
NASDAQ
Rovi Corp
COMPUTER SOFTWARE andamp; SERVICES - Security Software andamp; Services
|
$39.22
|
+1.76
4.70% |
$39.77
|
2,201,386
171.93% of 50 DAV
50 DAV is 1,280,400
|
$40.06
-2.10%
|
6/3/2010
|
$38.70
|
PP = $40.16
|
|
MB = $42.17
|
Most Recent Note - 6/3/2010 1:15:51 PM
Y - Gain today with higher volume, rallying above its 50 DMA line to within close striking distance (-3%) of its 52-week high. Color code is changed to yellow with new pivot point cited based upon its 4/26/10 high plus ten cents.
>>> The latest Featured Stock Update with an annotated graph appeared on 5/24/2010. Click here.
View all notes |
Alert me of new notes |
CANSLIM.net Company Profile |
SEC |
Zacks Reports |
StockTalk |
News |
Chart |
Request a new note
C
A N
S L
I M
|
SUMR
-
NASDAQ
Summer Infant Inc
CONSUMER NON-DURABLES - Personal Products
|
$8.10
|
+0.04
0.50% |
$8.40
|
173,356
267.11% of 50 DAV
50 DAV is 64,900
|
$8.42
-3.80%
|
5/4/2010
|
$6.85
|
PP = $7.09
|
|
MB = $7.44
|
Most Recent Note - 6/3/2010 1:19:37 PM
G - Holding its ground near all-time highs, extended from a sound base. Prior highs and its 50 DMA coincide near $7.00 as an important chart support level.
>>> The latest Featured Stock Update with an annotated graph appeared on 5/21/2010. Click here.
View all notes |
Alert me of new notes |
CANSLIM.net Company Profile |
SEC |
Zacks Reports |
StockTalk |
News |
Chart |
Request a new note
C
A N
S L
I M
|
THOR
-
NASDAQ
Thoratec Corp
HEALTH SERVICES - Medical Instruments and Supplies
|
$44.21
|
-1.25
-2.75% |
$45.61
|
1,580,658
187.70% of 50 DAV
50 DAV is 842,100
|
$46.50
-4.92%
|
6/3/2010
|
$44.38
|
PP = $45.35
|
|
MB = $47.62
|
Most Recent Note - 6/3/2010 1:30:48 PM
Y - Pulling back today after breaking out from a choppy 5-week base with a considerable gain on 6/02/10 backed by above average volume. Recent quarterly comparisons showed impressive acceleration in its sales revenues increases and earnings above the +25% minimum guideline, satisfying the C criteria. Based on weakness it was dropped from the Featured Stocks list on 2/23/09, yet it has shown especially bullish action since its breakout on 3/05/10. Mentioned long ago in a 12/15/08 interview on WBBM 780AM - (listen here). This high-ranked Medical - Products firm was featured in yellow in the 12/05/08 Mid-Day Breakouts Report (read here) THOR had rebounded impressively after being featured in the past, then subsequently dropped from the CANSLIM.net Featured Stocks list on 2/2/2006.
>>> The latest Featured Stock Update with an annotated graph appeared on 6/3/2010. Click here.
View all notes |
Alert me of new notes |
CANSLIM.net Company Profile |
SEC |
Zacks Reports |
StockTalk |
News |
Chart |
Request a new note
C
A N
S L
I M
|
ULTA
-
NASDAQ
Ulta Salon Cosm & Frag
SPECIALTY RETAIL - Specialty Retail, Other
|
$23.90
|
+0.31
1.31% |
$24.14
|
482,290
124.30% of 50 DAV
50 DAV is 388,000
|
$26.00
-8.08%
|
5/28/2010
|
$25.58
|
PP = $25.86
|
|
MB = $27.15
|
Most Recent Note - 6/3/2010 3:58:15 PM
G - Consolidating quietly above its 50 DMA line and -8% off its 52-week high today ahead of earnings news due after the session's close.
>>> The latest Featured Stock Update with an annotated graph appeared on 5/20/2010. Click here.
View all notes |
Alert me of new notes |
CANSLIM.net Company Profile |
SEC |
Zacks Reports |
StockTalk |
News |
Chart |
Request a new note
C
A N
S L
I M
|
Symbol/Exchange
Company Name
Industry Group |
PRICE |
CHANGE
(%Change) |
Day High |
Volume
(% DAV)
(% 50 day avg vol) |
52 Wk Hi
% From Hi |
Featured
Date |
Price
Featured |
Pivot Featured |
|
Max Buy |
|
|
|
THESE ARE NOT BUY RECOMMENDATIONS!
Comments contained in the body of this report are technical
opinions only. The material herein has been obtained
from sources believed to be reliable and accurate, however,
its accuracy and completeness cannot be guaranteed.
This site is not an investment advisor, hence it does
not endorse or recommend any securities or other investments.
Any recommendation contained in this report may not
be suitable for all investors and it is not to be deemed
an offer or solicitation on our part with respect to
the purchase or sale of any securities. All trademarks,
service marks and trade names appearing in this report
are the property of their respective owners, and are
likewise used for identification purposes only.
This report is a service available
only to active Paid Premium Members.
You may opt-out of receiving report notifications
at any time. Questions or comments may be submitted
by writing to Premium Membership Services 665 S.E. 10 Street, Suite 201 Deerfield Beach, FL 33441-5634 or by calling 1-800-965-8307
or 954-785-1121.
|
|
|


