You are not logged in.
This means you
CAN ONLY VIEW reports that were published prior to Wednesday, April 9, 2025.
You
MUST UPGRADE YOUR MEMBERSHIP if you want to see any current reports.
AFTER MARKET UPDATE - THURSDAY, MAY 30TH, 2024
Previous After Market Report Next After Market Report >>>
|
|
|
|
DOW |
-330.06 |
38,111.48 |
-0.86% |
|
Volume |
912,600,924 |
+4% |
|
Volume |
6,841,491,000 |
+2% |
|
NASDAQ |
-183.50 |
16,737.08 |
-1.08% |
|
Advancers |
2,074 |
76% |
|
Advancers |
2,434 |
58% |
|
S&P 500 |
-31.47 |
5,235.48 |
-0.60% |
|
Decliners |
657 |
24% |
|
Decliners |
1,752 |
42% |
|
Russell 2000 |
+20.41 |
2,056.60 |
+1.00% |
|
52 Wk Highs |
67 |
|
|
52 Wk Highs |
71 |
|
|
S&P 600 |
+15.76 |
1,315.53 |
+1.21% |
|
52 Wk Lows |
41 |
|
|
52 Wk Lows |
100 |
|
|
 |
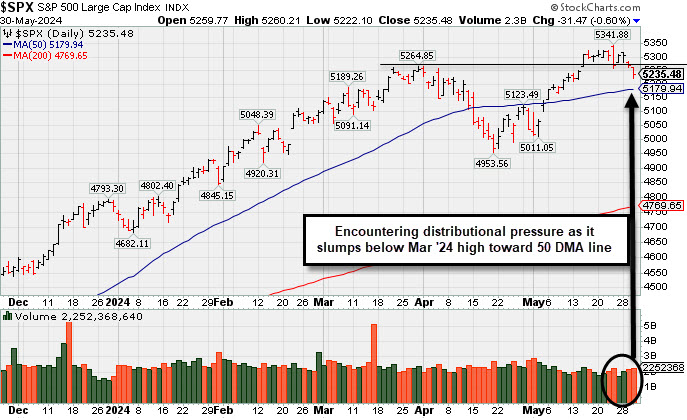
Major Indices Encounter Pressure Despite Signs of Underlying Strength
Kenneth J. Gruneisen - Passed the CAN SLIM® Master's Exam
The major indices closed with solid losses despite an underlying positive bias today. The market-cap weighted S&P 500 fell -0.6%. Volume was higher than the prior session on the NYSE and higher on the Nasdaq exchange. Breadth was positive as advancers led decliners by more than a 3-1 margin on the NYSE and by a 4-3 margin on the Nasdaq exchange. Leadership improved as there were 31 high-ranked companies from the Leaders List that hit new 52-week highs and were listed on the BreakOuts Page versus the total of 18 on the prior session. New 52-week highs outnumbered new 52-week lows on the NYSE but new lows again outnumbered new highs on the Nasdaq exchange. The major indices are in a confirmed uptrend (M criteria) that is coming under some pressure.
PICTURED: The S&P 500 Index is encountering distributional pressure as it slumps below the March 2024 high toward its 50-day moving average (DMA) line with losses marked by higher volume totals.
NVIDIA (NVDA -3.77%) ended lower following a Bloomberg report that the US is slowing the issuing of Middle East licenses for AI chip makers. Microsoft (MSFT -3.38%), Alphabet (GOOG -2.18%), and Meta Platforms (META -1.54%) were losing standouts from the mega cap space. Mixed earnings news came from retailers. Best Buy (BBY +13.42%) and Foot Locker (FL +14.96%) were winners. Meanwhile, Kohl's (KSS -22.86%) and Dollar General (DG -8.14%) both slid after reporting quarterly results. Dow component Salesforce (CRM -19.74%) was another influential laggard after it gave disappointing guidance.
The information technology sector fell -2.5% and the communication services sector fell -1.1%. The remaining nine sectors closed with gains ranging from +0.1% to +1.5%. The only sectors to close more than +1.0% higher were the rate-sensitive real estate (+1.5%) and utilities (+1.4%) sectors, benefitting from a drop in market rates. The 2-yr note yield fell five basis points to 4.93% and the 10-yr note yield declined seven basis points to 4.55%.
The latest economic date included a downward revision to Q1 GDP, a widening in the goods deficit in April, a -7.7% decline in pending home sales in April. Initial jobless claims figures were considered to be decent. Reportedly, the CME Group index pricing for the Dow Jones Industrial Average and S&P 500 briefly froze around 10:41 ET, but began updating as usual around 12:00 ET.
|
 Kenneth J. Gruneisen started out as a licensed stockbroker in August 1987, a couple of months prior to the historic stock market crash that took the Dow Jones Industrial Average down -22.6% in a single day. He has published daily fact-based fundamental and technical analysis on high-ranked stocks online for two decades. Through FACTBASEDINVESTING.COM, Kenneth provides educational articles, news, market commentary, and other information regarding proven investment systems that work in good times and bad.
Comments contained in the body of this report are technical opinions only and are not necessarily those of Gruneisen Growth Corp. The material herein has been obtained from sources believed to be reliable and accurate, however, its accuracy and completeness cannot be guaranteed. Our firm, employees, and customers may effect transactions, including transactions contrary to any recommendation herein, or have positions in the securities mentioned herein or options with respect thereto. Any recommendation contained in this report may not be suitable for all investors and it is not to be deemed an offer or solicitation on our part with respect to the purchase or sale of any securities. |
|
 |
Financial, Networking, and Commodity-Linked Indexes Rose
Kenneth J. Gruneisen - Passed the CAN SLIM® Master's Exam
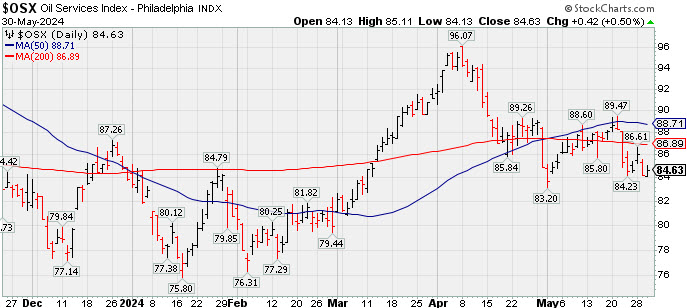
The Bank Index ($BKX +0.50%) and the Broker/Dealer Index ($XBD +0.46%) both posted small gains while the Retail Index ($RLX -0.52%) edged lower. The tech sector was mixed as the Semiconductor Index ($SOX -0.88%) edged lower while the Biotech Index ($BTK +0.12%) finished virtually flat and the Networking Index ($NWX +0.80%) eked out a modest gain. Commodity-linked groups had a positive bias as the Gold & Silver Index ($XAU +1.13%) outpaced the Oil Services ($OSX +0.50%) while the Integrated Oil Index ($XOI +0.00%) was unchanged.
![]() PICTURED: The Oil Services ($OSX +0.50%) is consolidating below its 50-day and 200-day moving average (DMA) lines in recent weeks, sputtering toward the May 1, 2024 low.
| Oil Services |
$OSX |
84.63 |
+0.42 |
+0.50% |
+0.90% |
| Integrated Oil |
$XOI |
2,043.52 |
+0.00 |
+0.00% |
+9.72% |
| Semiconductor |
$SOX |
5,173.26 |
-46.07 |
-0.88% |
+23.90% |
| Networking |
$NWX |
796.46 |
+6.32 |
+0.80% |
-4.37% |
| Broker/Dealer |
$XBD |
626.41 |
+2.89 |
+0.46% |
+12.40% |
| Retail |
$RLX |
4,310.23 |
-22.47 |
-0.52% |
+10.84% |
| Gold & Silver |
$XAU |
145.92 |
+1.63 |
+1.13% |
+16.09% |
| Bank |
$BKX |
103.09 |
+0.51 |
+0.50% |
+7.36% |
| Biotech |
$BTK |
5,114.60 |
+6.07 |
+0.12% |
-5.61% |
|
|
|
 |
Volume-Driven Loss Triggered Technical Sell Signal
Kenneth J. Gruneisen - Passed the CAN SLIM® Master's Exam
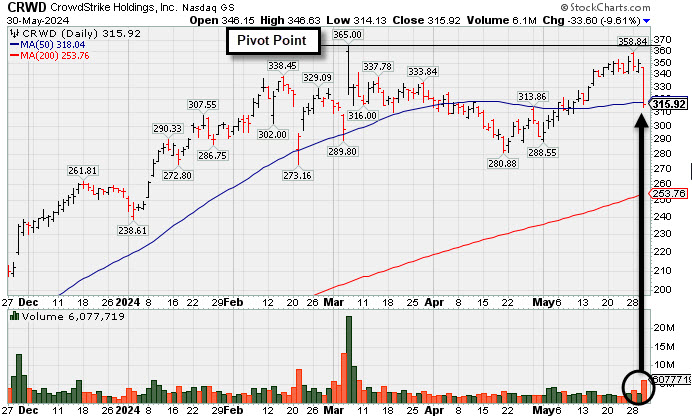
CrowdStrike Holdings (CRWD -$33.60 or -9.61% to $315.92) suffered a considerable loss today with +160% above average volume as it violated its 50-day moving average (DMA) line ($318) triggering a technical sell signal. The action was clearly indicative of distributional pressure. Only a promt rebound above the 50 DMA line would help its outlook improve.
The number of top-rated funds owning its shares rose from 1,880 in Jun 23 to 2,430 in Mar '24, a reassuring sign concerning the I criteria. Its current Up/Down Volume Ratio of 1.2 is an unbiased indication its shares have been under accumulation over the past 50 days. CRWD completed its $34 IPO on 6/12/19.
The Austin, TX-based company is due to report Apr '24 quarterly results on 6/04/24. Volume and volatility often increase near earnings news. It has a highest possible 99 Earnings Per Share Rating. Its annual earnings (A criteria) history has been strong.Fundamentals have been strong through the Jan '24 quarter with an extended streak of earnings increases well above the +25% minimum guideline (C criteria) in quarterly comparisons backed by solid sales revenues growth.
Historical studies have shown that odds are most favorable when investors buy stocks as they are showing fresh signs of institutional buying demand - action that can lead to a meaningful advance in price. Disciplined investors will note that CRWD did not breakout above the pivot point to trigger a proper technical buy signal after it was recently highlighted in the 5/28/24 mid-day report (read here). It was recovering from a deeper trip below its 50 DMA line since last shown in detail in this FSU section on 4/01/24 with an annotated graph under the headline "50-Day Moving Average Line Support Being Tested".
|
|
|
Color Codes Explained :
Y - Better candidates highlighted by our
staff of experts.
G - Previously featured
in past reports as yellow but may no longer be buyable under the
guidelines.
***Last / Change / Volume data in this table is the closing quote data***
Symbol/Exchange
Company Name
Industry Group |
PRICE |
CHANGE
(%Change) |
Day High |
Volume
(% DAV)
(% 50 day avg vol) |
52 Wk Hi
% From Hi |
Featured
Date |
Price
Featured |
Pivot Featured |
|
Max Buy |
 TDG
-
NYSE
TDG
-
NYSE
TransDigm Group
Aerospace/Defense
|
$1,321.85
|
+9.56
0.73% |
$1,324.07
|
143,546
72.13% of 50 DAV
50 DAV is 199,000
|
$1,363.66
-3.07%
|
4/12/2024
|
$1,224.21
|
PP = $1,246.32
|
|
MB = $1,308.64
|
Most Recent Note - 5/29/2024 2:25:22 PM
G - There was a "negative reversal" on the prior session after hitting yet another new all-time high. It is extended from any sound base and its 50 DMA line ($1,257) defines near-term support to watch on pullbacks. Fundamentals remain strong.
>>> FEATURED STOCK ARTICLE : Aerospace/Defense Firm Hitting Another All-Time High - 5/21/2024 |
View all notes |
Set NEW NOTE alert |
Company Profile |
SEC
News |
Chart |
Request a new note
C
A
S
I |
USLM
-
NASDAQ
U.S. Lime & Minerals
Bldg-Cement/Concrt/Ag
|
$345.78
|
+5.99
1.76% |
$351.06
|
14,028
56.11% of 50 DAV
50 DAV is 25,000
|
$378.78
-8.71%
|
2/9/2024
|
$254.68
|
PP = $265.09
|
|
MB = $278.34
|
 Most Recent Note - 5/30/2024 6:13:44 PM
G - Posted a small gain today with below average volume, breaking a streak of 10 consecutive small losses. Its 50 DMA line ($323.25) defines important near-term support to watch. Fundamentals remain strong.
>>> FEATURED STOCK ARTICLE : Stubbornly Held Ground and Posted Quiet Gain for Best-Ever Close - 5/14/2024 |
View all notes |
Set NEW NOTE alert |
Company Profile |
SEC
News |
Chart |
Request a new note
C
A
S
I |
CLS
-
NYSE
Celestica
Elec-Contract Mfg
|
$57.40
|
-1.83
-3.09% |
$59.23
|
1,855,320
80.63% of 50 DAV
50 DAV is 2,301,000
|
$61.06
-5.99%
|
5/15/2024
|
$51.52
|
PP = $51.22
|
|
MB = $53.78
|
Most Recent Note - 5/30/2024 6:09:41 PM
G - Pulled back for a 2nd consecutive loss with below-average volume, retreating from its all-time high. Noted recently - "Extended from the previously noted base. Prior highs in the $51 area define initial support to watch above its 50 DMA line ($47.83)."
>>> FEATURED STOCK ARTICLE : Strong Breakout After 6-Week Flat Base - 5/15/2024 |
View all notes |
Set NEW NOTE alert |
Company Profile |
SEC
News |
Chart |
Request a new note
C
A
S
I |
AROC
-
NYSE
Archrock
OilandGas-Machinery/Equip
|
$19.69
|
+0.11
0.56% |
$19.80
|
1,499,864
101.69% of 50 DAV
50 DAV is 1,475,000
|
$21.61
-8.88%
|
5/20/2024
|
$21.23
|
PP = $21.50
|
|
MB = $22.58
|
Most Recent Note - 5/29/2024 12:03:31 PM
G - Volume totals have been cooling while lingering below its 50 DMA line ($19.98) after volume-driven losses raised concerns. Only a prompt rebound above the 50 DMA line would help its outlook improve. There was a "negative reversal" and it closed near the session low on 5/21/24 after hitting new multi-year highs.
>>> FEATURED STOCK ARTICLE : Strong Finish for Archrock After Highlighted in Mid-Day Report - 5/20/2024 |
View all notes |
Set NEW NOTE alert |
Company Profile |
SEC
News |
Chart |
Request a new note
C
A
S
I |
DECK
-
NYSE
Deckers Outdoor
Apparel-Shoes and Rel Mfg
|
$1,082.58
|
+17.66
1.66% |
$1,095.48
|
417,723
112.29% of 50 DAV
50 DAV is 372,000
|
$1,083.71
-0.10%
|
5/24/2024
|
$1,010.60
|
PP = $956.27
|
|
MB = $1,004.08
|
Most Recent Note - 5/30/2024 6:12:18 PM
G - Hit another new all-time high with today's gain. Rallied well above its "max buy" level, quickly getting extended from prior highs in the $956 area that define initial support to watch on pullbacks.
>>> FEATURED STOCK ARTICLE : Big "Breakaway Gap" for Deckers Outdoor - 5/24/2024 |
View all notes |
Set NEW NOTE alert |
Company Profile |
SEC
News |
Chart |
Request a new note
C
A
S
I |
Symbol/Exchange
Company Name
Industry Group |
PRICE |
CHANGE
(%Change) |
Day High |
Volume
(% DAV)
(% 50 day avg vol) |
52 Wk Hi
% From Hi |
Featured
Date |
Price
Featured |
Pivot Featured |
|
Max Buy |
ELF
-
NYSE
e.l.f. Beauty
Cosmetics/Personal Care
|
$182.40
|
-1.37
-0.75% |
$187.30
|
1,144,354
67.79% of 50 DAV
50 DAV is 1,688,000
|
$221.83
-17.77%
|
5/24/2024
|
$193.79
|
PP = $182.73
|
|
MB = $191.87
|
Most Recent Note - 5/29/2024 5:12:45 PM
Y - Pulled back today with lighter volume following 3 consecutive gains. Color code was changed to yellow in the 5/24/24 mid-day report with pivot point cited based on its 4/29/24 high after breaking out a "double-bottom" base. Rallied further after gapping up and rebounding above its 50 DMA line ($173) helping its technical stance and outlook improve. Found support above its 200 DMA line since dropped from the Featured Stocks list on 4/03/24. Reported Mar '24 quarterly earnings +26% on +71% sales revenues versus the year-ago period and fundamentals remain strong. See the latest FSU analysis for more details and a new annotated graph.
>>> FEATURED STOCK ARTICLE : Down on Lighter Volume After Breakout From "Double Bottom" Base - 5/29/2024 |
View all notes |
Set NEW NOTE alert |
Company Profile |
SEC
News |
Chart |
Request a new note
C
A
S
I |
PDD
-
NASDAQ
PDD Holdings ADR
Retail-Internet
|
$152.03
|
+0.76
0.50% |
$155.50
|
9,135,961
86.97% of 50 DAV
50 DAV is 10,505,000
|
$164.69
-7.69%
|
5/24/2024
|
$161.85
|
PP = $153.09
|
|
MB = $160.74
|
Most Recent Note - 5/29/2024 12:29:50 PM
Y - Consolidating near prior highs, showing resilience today with a "positive reversal" after undercutting the prior high raising concerns. Color code was changed to yellow in the 5/24/24 mid-day report with pivot point cited based on its 1/11/24 high plus 10 cents. Rallied to new 52-week highs with 3 consecutive volume-driven gains clearing a 20-week base during which it found prompt support at its 200 DMA line. Quarterly comparisons through Mar '24 showed encouraging sales revenues and greatly improved earnings versus the year-ago periods with growth rate acceleration. After years of losses, it had a profitable FY '21-23 helping it better match the fundamental annual earnings (A criteria) guidelines of the fact-based investment system. See the latest FSU analysis for more details and an annotated graph.
>>> FEATURED STOCK ARTICLE : Pulled Back Below Prior Highs Raising Concerns - 5/28/2024 |
View all notes |
Set NEW NOTE alert |
Company Profile |
SEC
News |
Chart |
Request a new note
C
A
S
I |
CRWD
-
NASDAQ
CrowdStrike Holdings
Computer Sftwr-Security
|
$315.92
|
-33.60
-9.61% |
$346.63
|
6,128,469
257.93% of 50 DAV
50 DAV is 2,376,000
|
$365.00
-13.45%
|
5/28/2024
|
$351.47
|
PP = $365.10
|
|
MB = $383.36
|
Most Recent Note - 5/30/2024 6:07:01 PM
G - Color code is changed to green after violating its 50 DMA line ($318) with a volume-driven loss today triggering a technical sell signal. Due to report Apr '24 quarterly results on 6/04/24. See the latest FSU analysis for more details and a new annotated graph.
>>> FEATURED STOCK ARTICLE : Volume-Driven Loss Triggered Technical Sell Signal - 5/30/2024 |
View all notes |
Set NEW NOTE alert |
Company Profile |
SEC
News |
Chart |
Request a new note
C
A
S
I |
|
|
|
THESE ARE NOT BUY RECOMMENDATIONS!
Comments contained in the body of this report are technical
opinions only. The material herein has been obtained
from sources believed to be reliable and accurate, however,
its accuracy and completeness cannot be guaranteed.
This site is not an investment advisor, hence it does
not endorse or recommend any securities or other investments.
Any recommendation contained in this report may not
be suitable for all investors and it is not to be deemed
an offer or solicitation on our part with respect to
the purchase or sale of any securities. All trademarks,
service marks and trade names appearing in this report
are the property of their respective owners, and are
likewise used for identification purposes only.
This report is a service available
only to active Paid Premium Members.
You may opt-out of receiving report notifications
at any time. Questions or comments may be submitted
by writing to Premium Membership Services 665 S.E. 10 Street, Suite 201 Deerfield Beach, FL 33441-5634 or by calling 1-800-965-8307
or 954-785-1121.
|
|
|