You are not logged in.
This means you
CAN ONLY VIEW reports that were published prior to Wednesday, April 9, 2025.
You
MUST UPGRADE YOUR MEMBERSHIP if you want to see any current reports.
AFTER MARKET UPDATE - WEDNESDAY, MAY 29TH, 2024
Previous After Market Report Next After Market Report >>>
|
|
|
|
DOW |
-411.32 |
38,441.54 |
-1.06% |
|
Volume |
876,446,494 |
-5% |
|
Volume |
6,706,857,800 |
+4% |
|
NASDAQ |
-99.30 |
16,920.58 |
-0.58% |
|
Advancers |
449 |
16% |
|
Advancers |
1,114 |
26% |
|
S&P 500 |
-39.09 |
5,266.95 |
-0.74% |
|
Decliners |
2,315 |
84% |
|
Decliners |
3,111 |
74% |
|
Russell 2000 |
-30.66 |
2,036.19 |
-1.48% |
|
52 Wk Highs |
35 |
|
|
52 Wk Highs |
63 |
|
|
S&P 600 |
-16.05 |
1,299.77 |
-1.22% |
|
52 Wk Lows |
85 |
|
|
52 Wk Lows |
159 |
|
|
 |
Breadth Negative and Leadership Thinned as Major Indices Fell
Kenneth J. Gruneisen - Passed the CAN SLIM® Master's Exam
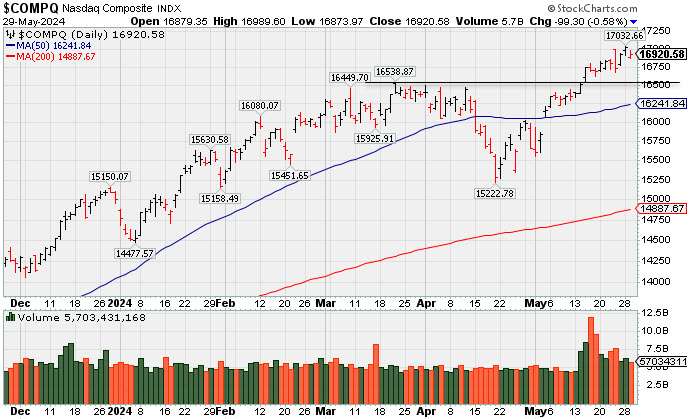
The major indices ended Wednesday's session with unanimous losses ranging from -1.06% for the Dow Industrials to -0.58% for the Nasdaq Composite Index. Volume was mixed, lighter than the prior session on the NYSE and higher on the Nasdaq exchange. Breadth was clearly negative as decliners led advancers by a 5-1 margin on the NYSE and by almost a 3-1 margin on the Nasdaq exchange. Leadership waned as there were 18 high-ranked companies from the Leaders List that hit new 52-week highs and were listed on the BreakOuts Page versus the total of 68 on the prior session. New 52-week lows totals expanded and outnumbered shrinking new 52-week highs totals on the NYSE and on the Nasdaq exchange. The major indices are in a confirmed uptrend (M criteria).
PICTURED: The Nasdaq Composite Index is consolidating near its all-time high. It closed above 17,000 for the first time on the prior session.
The weekly MBA Mortgage Applications Index declined -5.7% with refinance applications plunging -14% and purchase applications dropping -1%. The Fed's latest Beige Book said national economic activity continued to expand from early April to mid-May. The 10-yr note yield rose eight basis points to 4.62% and the 2-year note yield settled unchanged at 4.98%. A fresh $44 billion 7-year Treasury note sale met weak demand.
A broad retreat left all 11 S&P 500 sectors with losses. The energy sector dropped -1.8% amid falling commodity prices. WTI crude oil futures fell -0.8% to $79.25/bbl and natural gas futures slid -5.7% to $2.66/mmbtu. Marathon Oil (MRO +8.43%) went against the grain, rising on news that ConocoPhillips (COP -3.12%) will acquire MRO in an all-stock transaction. The industrial sector was the next worst performer, dropping -1.4%. Weak airline components weighed on the sector after American Airlines (AAL -13.5%) lowered its Q2 EPS below consensus.
|
 Kenneth J. Gruneisen started out as a licensed stockbroker in August 1987, a couple of months prior to the historic stock market crash that took the Dow Jones Industrial Average down -22.6% in a single day. He has published daily fact-based fundamental and technical analysis on high-ranked stocks online for two decades. Through FACTBASEDINVESTING.COM, Kenneth provides educational articles, news, market commentary, and other information regarding proven investment systems that work in good times and bad.
Comments contained in the body of this report are technical opinions only and are not necessarily those of Gruneisen Growth Corp. The material herein has been obtained from sources believed to be reliable and accurate, however, its accuracy and completeness cannot be guaranteed. Our firm, employees, and customers may effect transactions, including transactions contrary to any recommendation herein, or have positions in the securities mentioned herein or options with respect thereto. Any recommendation contained in this report may not be suitable for all investors and it is not to be deemed an offer or solicitation on our part with respect to the purchase or sale of any securities. |
|
 |
Financial, Semiconductor, Biotech, and Commodity-Linked Groups Fell
Kenneth J. Gruneisen - Passed the CAN SLIM® Master's Exam
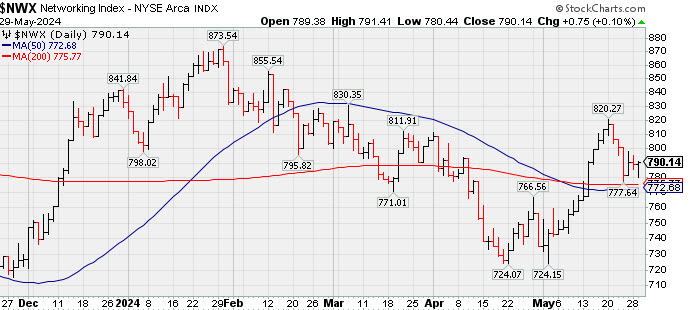
The Bank Index ($BKX -1.17%) and the Broker/Dealer Index ($XBD -0.96%) both lost ground and the Retail Index ($RLX -0.28%) also edged lower. The Semiconductor Index ($SOX -1.85%) and the Biotech Index ($BTK -1.39%) both lost ground while the Networking Index ($NWX +0.10%) eked out a tiny gain. Commodity-linked groups had a negative bias as the Gold & Silver Index ($XAU -2.10%), Oil Services ($OSX -2.16%) and the Integrated Oil Index ($XOI -2.21%) ended unanimously lower.
![]() PICTURED: The Networking Index ($NWX +0.10%) is consolidating above its 50-day and 200-day moving average (DMA) lines.
| Oil Services |
$OSX |
84.21 |
-1.86 |
-2.16% |
+0.40% |
| Integrated Oil |
$XOI |
2,043.52 |
-46.15 |
-2.21% |
+9.72% |
| Semiconductor |
$SOX |
5,219.32 |
-98.55 |
-1.85% |
+25.00% |
| Networking |
$NWX |
790.14 |
+0.75 |
+0.10% |
-5.12% |
| Broker/Dealer |
$XBD |
623.52 |
-6.02 |
-0.96% |
+11.88% |
| Retail |
$RLX |
4,332.70 |
-12.17 |
-0.28% |
+11.42% |
| Gold & Silver |
$XAU |
144.29 |
-3.09 |
-2.10% |
+14.79% |
| Bank |
$BKX |
102.58 |
-1.21 |
-1.17% |
+6.83% |
| Biotech |
$BTK |
5,108.53 |
-71.83 |
-1.39% |
-5.73% |
|
|
|
 |
Down on Lighter Volume After Breakout From "Double Bottom" Base
Kenneth J. Gruneisen - Passed the CAN SLIM® Master's Exam
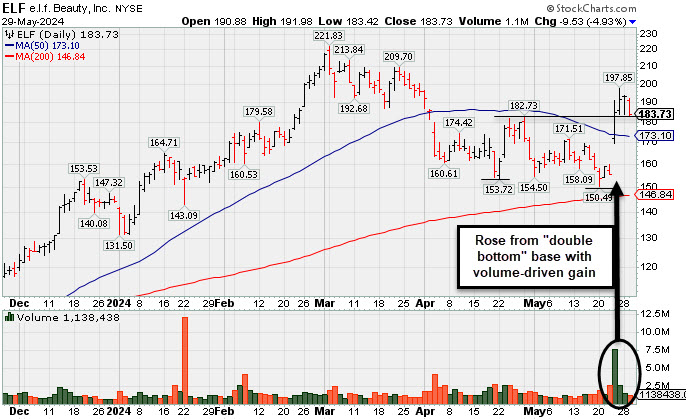
e.l.f. Beauty (ELF -$9.47 or -4.90% to $183.77) pulled back today with lighter volume after 3 consecutive gains. It was highlighted in yellow in the 5/24/24 mid-day report (read here) with pivot point cited based on its 4/29/24 high after breaking out a "double-bottom" base. It rallied further after gapping up and rebounding above its 50-day moving average (DMA) line ($173) with volume-driven gains.
ELF found support above its 200 DMA line since dropped from the Featured Stocks list on 4/03/24. It was last shown in detail in the 3/28/24 report with an annotated graph under the headline, "ELF Consolidating Above 50-Day Moving Average Line". It currently has a 98 Earnings Per Share rating. It reported Mar '24 quarterly earnings +26% on +71% sales revenues versus the year-ago period, adding to its streak of very strong quarterly results above the +25% minimum earnings guideline (C criteria). Annual earnings (A criteria) history over the past 3 years has been strong, making it a better match with the fact-based investment system's fundamental guidelines.
The number of top-rated funds owning its shares rose from 510 in Mar '23 to 818 in Mar '24, a very reassuring sign concerning the I criteria. Its current Up/Down Volume Ratio of 0.8 is an unbiased indication its shares have been under distributional pressure over the past 50 days. Its small supply (S criteria) of only 55.9 million shares outstanding can contribute to greater price volatility in the event of institutional buying or selling.
|
|
|
Color Codes Explained :
Y - Better candidates highlighted by our
staff of experts.
G - Previously featured
in past reports as yellow but may no longer be buyable under the
guidelines.
***Last / Change / Volume data in this table is the closing quote data***
Symbol/Exchange
Company Name
Industry Group |
PRICE |
CHANGE
(%Change) |
Day High |
Volume
(% DAV)
(% 50 day avg vol) |
52 Wk Hi
% From Hi |
Featured
Date |
Price
Featured |
Pivot Featured |
|
Max Buy |
 TDG
-
NYSE
TDG
-
NYSE
TransDigm Group
Aerospace/Defense
|
$1,312.29
|
-5.65
-0.43% |
$1,333.85
|
200,663
101.34% of 50 DAV
50 DAV is 198,000
|
$1,363.66
-3.77%
|
4/12/2024
|
$1,224.21
|
PP = $1,246.32
|
|
MB = $1,308.64
|
 Most Recent Note - 5/29/2024 2:25:22 PM
G - There was a "negative reversal" on the prior session after hitting yet another new all-time high. It is extended from any sound base and its 50 DMA line ($1,257) defines near-term support to watch on pullbacks. Fundamentals remain strong.
>>> FEATURED STOCK ARTICLE : Aerospace/Defense Firm Hitting Another All-Time High - 5/21/2024 |
View all notes |
Set NEW NOTE alert |
Company Profile |
SEC
News |
Chart |
Request a new note
C
A
S
I |
USLM
-
NASDAQ
U.S. Lime & Minerals
Bldg-Cement/Concrt/Ag
|
$339.79
|
-4.10
-1.19% |
$342.50
|
17,973
69.13% of 50 DAV
50 DAV is 26,000
|
$378.78
-10.29%
|
2/9/2024
|
$254.68
|
PP = $265.09
|
|
MB = $278.34
|
Most Recent Note - 5/29/2024 12:54:39 PM
G - Pulling back today on track for a 10th consecutive small loss without heavy volume following noted volume-driven gains into new all-time high territory. Its 50 DMA line ($322) defines important near-term support to watch. Fundamentals remain strong.
>>> FEATURED STOCK ARTICLE : Stubbornly Held Ground and Posted Quiet Gain for Best-Ever Close - 5/14/2024 |
View all notes |
Set NEW NOTE alert |
Company Profile |
SEC
News |
Chart |
Request a new note
C
A
S
I |
CLS
-
NYSE
Celestica
Elec-Contract Mfg
|
$59.23
|
-0.18
-0.30% |
$59.70
|
1,371,607
59.51% of 50 DAV
50 DAV is 2,305,000
|
$61.06
-3.00%
|
5/15/2024
|
$51.52
|
PP = $51.22
|
|
MB = $53.78
|
Most Recent Note - 5/29/2024 2:24:10 PM
G - Holding its ground stubbornly and perched at its all-time high with today's 5th consecutive gain, extended from the previously noted base. Prior highs in the $51 area define initial support to watch above its 50 DMA line ($47.55).
>>> FEATURED STOCK ARTICLE : Strong Breakout After 6-Week Flat Base - 5/15/2024 |
View all notes |
Set NEW NOTE alert |
Company Profile |
SEC
News |
Chart |
Request a new note
C
A
S
I |
AROC
-
NYSE
Archrock
OilandGas-Machinery/Equip
|
$19.58
|
-0.12
-0.61% |
$19.95
|
1,770,934
121.05% of 50 DAV
50 DAV is 1,463,000
|
$21.61
-9.39%
|
5/20/2024
|
$21.23
|
PP = $21.50
|
|
MB = $22.58
|
Most Recent Note - 5/29/2024 12:03:31 PM
G - Volume totals have been cooling while lingering below its 50 DMA line ($19.98) after volume-driven losses raised concerns. Only a prompt rebound above the 50 DMA line would help its outlook improve. There was a "negative reversal" and it closed near the session low on 5/21/24 after hitting new multi-year highs.
>>> FEATURED STOCK ARTICLE : Strong Finish for Archrock After Highlighted in Mid-Day Report - 5/20/2024 |
View all notes |
Set NEW NOTE alert |
Company Profile |
SEC
News |
Chart |
Request a new note
C
A
S
I |
DECK
-
NYSE
Deckers Outdoor
Apparel-Shoes and Rel Mfg
|
$1,064.92
|
-14.22
-1.32% |
$1,083.71
|
362,335
97.40% of 50 DAV
50 DAV is 372,000
|
$1,079.87
-1.38%
|
5/24/2024
|
$1,010.60
|
PP = $956.27
|
|
MB = $1,004.08
|
Most Recent Note - 5/28/2024 6:07:06 PM
G - Color code is changed to green today after rallying well above its "max buy" level, quickly getting extended from prior highs. See the latest FSU analysis for more details and an annotated graph.
>>> FEATURED STOCK ARTICLE : Big "Breakaway Gap" for Deckers Outdoor - 5/24/2024 |
View all notes |
Set NEW NOTE alert |
Company Profile |
SEC
News |
Chart |
Request a new note
C
A
S
I |
Symbol/Exchange
Company Name
Industry Group |
PRICE |
CHANGE
(%Change) |
Day High |
Volume
(% DAV)
(% 50 day avg vol) |
52 Wk Hi
% From Hi |
Featured
Date |
Price
Featured |
Pivot Featured |
|
Max Buy |
ELF
-
NYSE
e.l.f. Beauty
Cosmetics/Personal Care
|
$183.77
|
-9.47
-4.90% |
$191.99
|
1,138,217
67.43% of 50 DAV
50 DAV is 1,688,000
|
$221.83
-17.16%
|
5/24/2024
|
$193.79
|
PP = $182.73
|
|
MB = $191.87
|
Most Recent Note - 5/29/2024 5:12:45 PM
Y - Pulled back today with lighter volume following 3 consecutive gains. Color code was changed to yellow in the 5/24/24 mid-day report with pivot point cited based on its 4/29/24 high after breaking out a "double-bottom" base. Rallied further after gapping up and rebounding above its 50 DMA line ($173) helping its technical stance and outlook improve. Found support above its 200 DMA line since dropped from the Featured Stocks list on 4/03/24. Reported Mar '24 quarterly earnings +26% on +71% sales revenues versus the year-ago period and fundamentals remain strong. See the latest FSU analysis for more details and a new annotated graph.
>>> FEATURED STOCK ARTICLE : Down on Lighter Volume After Breakout From "Double Bottom" Base - 5/29/2024 |
View all notes |
Set NEW NOTE alert |
Company Profile |
SEC
News |
Chart |
Request a new note
C
A
S
I |
PDD
-
NASDAQ
PDD Holdings ADR
Retail-Internet
|
$151.27
|
+1.55
1.04% |
$154.28
|
12,088,238
115.49% of 50 DAV
50 DAV is 10,467,000
|
$164.69
-8.15%
|
5/24/2024
|
$161.85
|
PP = $153.09
|
|
MB = $160.74
|
Most Recent Note - 5/29/2024 12:29:50 PM
Y - Consolidating near prior highs, showing resilience today with a "positive reversal" after undercutting the prior high raising concerns. Color code was changed to yellow in the 5/24/24 mid-day report with pivot point cited based on its 1/11/24 high plus 10 cents. Rallied to new 52-week highs with 3 consecutive volume-driven gains clearing a 20-week base during which it found prompt support at its 200 DMA line. Quarterly comparisons through Mar '24 showed encouraging sales revenues and greatly improved earnings versus the year-ago periods with growth rate acceleration. After years of losses, it had a profitable FY '21-23 helping it better match the fundamental annual earnings (A criteria) guidelines of the fact-based investment system. See the latest FSU analysis for more details and an annotated graph.
>>> FEATURED STOCK ARTICLE : Pulled Back Below Prior Highs Raising Concerns - 5/28/2024 |
View all notes |
Set NEW NOTE alert |
Company Profile |
SEC
News |
Chart |
Request a new note
C
A
S
I |
CRWD
-
NASDAQ
CrowdStrike Holdings
Computer Sftwr-Security
|
$349.52
|
+2.70
0.78% |
$353.54
|
2,609,849
109.75% of 50 DAV
50 DAV is 2,378,000
|
$365.00
-4.24%
|
5/28/2024
|
$351.47
|
PP = $365.10
|
|
MB = $383.36
|
Most Recent Note - 5/28/2024 12:09:32 PM
Y - Color code is changed to yellow with pivot point cited based on its 3/06/24 high plus 10 cents. Perched near its 52-week high after wedging back above its 50 DMA line. Subsequent gains above the pivot point backed by at least +40% above average volume are needed to trigger a new technical buy signal. It was dropped from the Featured Stocks list on 4/17/24. Due to report Apr '24 quarterly results on 6/04/24. Fundamentals have been strong through the Jan '24 quarter when it reported earnings +102% on +33% sales revenues versus the year-ago period.
>>> FEATURED STOCK ARTICLE : 50-Day Moving Average Line Support Being Tested - 4/1/2024 |
View all notes |
Set NEW NOTE alert |
Company Profile |
SEC
News |
Chart |
Request a new note
C
A
S
I |
|
|
|
THESE ARE NOT BUY RECOMMENDATIONS!
Comments contained in the body of this report are technical
opinions only. The material herein has been obtained
from sources believed to be reliable and accurate, however,
its accuracy and completeness cannot be guaranteed.
This site is not an investment advisor, hence it does
not endorse or recommend any securities or other investments.
Any recommendation contained in this report may not
be suitable for all investors and it is not to be deemed
an offer or solicitation on our part with respect to
the purchase or sale of any securities. All trademarks,
service marks and trade names appearing in this report
are the property of their respective owners, and are
likewise used for identification purposes only.
This report is a service available
only to active Paid Premium Members.
You may opt-out of receiving report notifications
at any time. Questions or comments may be submitted
by writing to Premium Membership Services 665 S.E. 10 Street, Suite 201 Deerfield Beach, FL 33441-5634 or by calling 1-800-965-8307
or 954-785-1121.
|
|
|