You are not logged in.
This means you
CAN ONLY VIEW reports that were published prior to Monday, March 17, 2025.
You
MUST UPGRADE YOUR MEMBERSHIP if you want to see any current reports.
AFTER MARKET UPDATE - THURSDAY, MAY 29TH, 2014
Previous After Market Report Next After Market Report >>>
|
|
|
|
DOW |
+65.56 |
16,698.74 |
+0.39% |
|
Volume |
532,282,760 |
-14% |
|
Volume |
1,567,080,580 |
-4% |
|
NASDAQ |
+22.87 |
4,247.95 |
+0.54% |
|
Advancers |
2,054 |
65% |
|
Advancers |
1,562 |
57% |
|
S&P 500 |
+10.25 |
1,920.03 |
+0.54% |
|
Decliners |
1,011 |
32% |
|
Decliners |
1,072 |
39% |
|
Russell 2000 |
+3.39 |
1,140.07 |
+0.30% |
|
52 Wk Highs |
191 |
|
|
52 Wk Highs |
83 |
|
|
S&P 600 |
+1.29 |
655.41 |
+0.20% |
|
52 Wk Lows |
17 |
|
|
52 Wk Lows |
26 |
|
|
 |
Major Averages Rose With Less Volume Conviction
Kenneth J. Gruneisen - Passed the CAN SLIM® Master's Exam
Stocks returned to their winning ways on Thursday. The volume was reported lighter than the prior session totals on the NYSE and on the Nasdaq exchange, a sign that institutional buying demand was not on the rise. Advancers led decliners by a 2-1 margin on the NYSE and by a 3-2 margin on the Nasdaq exchange. There were 57 high-ranked companies from the CANSLIM.net Leaders List that made new 52-week highs and appeared on the CANSLIM.net BreakOuts Page, up from the total of 54 stocks on the prior session. New 52-week highs easily outnumbered new 52-week lows on the NYSE and on the Nasdaq exchange. There were gains for 6 of the 10 high-ranked companies currently included on the Featured Stocks Page. Technically, the S&P 500 Index's latest surge into new high territory coupled with an expansion in leadership (new 52-week highs) helped signal that the market direction (M criteria) is in a "confirmed uptrend". Any new buying efforts should be selective and focused in stocks meeting all key criteria of the fact-based investment system.
 The Dow rose 65 points to 16,698. The S&P 500 closed at a new record high for the second time this week as it gained 10 points to 1,920. The NASDAQ increased 22 points to 4,247.
Equities advanced thanks to encouraging updates on employment and housing. Claims for unemployment benefits unexpectedly fell by 27,000 last week to 300,000 and pending home sales rose for a second month in April. This data helped overshadow a report showing the U.S. economy contracted in the first-quarter for the first time since 2011.
Overall, nine of the 10 S&P 500 sectors advanced. Materials and energy were the best performing groups as Dow Chemical (DOW +1.4%) and Marathon Petroleum (MRO +2.7%). Gains in technology also helped lift the market. Apple (AAPL +1.8%) rose after news that it will acquire Beats Electronics for $3 billion. Frontier Communications (FTR -2.4%) pulled back as the more defensive telecommunications sector declined amid the renewed appeal for risk assets.
Treasuries pared yesterday's rally. The 10-year note fell 5/32 to yield 2.46%. The 30-year bond declined 16/32 to yield 3.32%.
Keep in mind that any sustained and meaningful market advance requires leadership - a healthy crop of stocks hitting new 52-week highs. The CANSLIM.net Featured Stocks Page shows the most action-worthy candidates and their latest notes and a Headline Link directs members to the latest detailed analysis with data-packed graphs annotated by a Certified expert along with links to additional resources. The Premium Member Homepage includes "dynamic archives" to all prior pay reports published. Watch for an announcement via email concerning the next WEBCAST.
PICTURED: The Dow Jones Industrial Average finished -0.6% off its all-time high. Near-term support to watch is at its 50-day moving average (DMA) line and an upward trendline, levels where subsequent violations would raise concerns.
|
 Kenneth J. Gruneisen started out as a licensed stockbroker in August 1987, a couple of months prior to the historic stock market crash that took the Dow Jones Industrial Average down -22.6% in a single day. He has published daily fact-based fundamental and technical analysis on high-ranked stocks online for two decades. Through FACTBASEDINVESTING.COM, Kenneth provides educational articles, news, market commentary, and other information regarding proven investment systems that work in good times and bad.
Comments contained in the body of this report are technical opinions only and are not necessarily those of Gruneisen Growth Corp. The material herein has been obtained from sources believed to be reliable and accurate, however, its accuracy and completeness cannot be guaranteed. Our firm, employees, and customers may effect transactions, including transactions contrary to any recommendation herein, or have positions in the securities mentioned herein or options with respect thereto. Any recommendation contained in this report may not be suitable for all investors and it is not to be deemed an offer or solicitation on our part with respect to the purchase or sale of any securities. |
|
 |
Retail, Tech, and Commodity-Linked Groups Rose
Kenneth J. Gruneisen - Passed the CAN SLIM® Master's Exam
The tech sector had a positive bias as the Networking Index ($NWX +0.43%) and the Biotechnology Index ($BTK +0.47%) posted modest gains and the Semiconductor Index ($SOX +0.22%) posted a smaller gain. The Retail Index ($RLX +0.77%) posted a gain which was influential on the major averages while the Broker/Dealer Index ($XBD +0.23%) posted a small gain and the Bank Index ($BKX +0.03%) finished flat. Commodity-linked groups had a positive bias as the Gold & Silver Index ($XAU +0.94%), Integrated Oil Index ($XOI +0.58%) and the Oil Services Index ($OSX +1.28%) rose.
Charts courtesy www.stockcharts.com
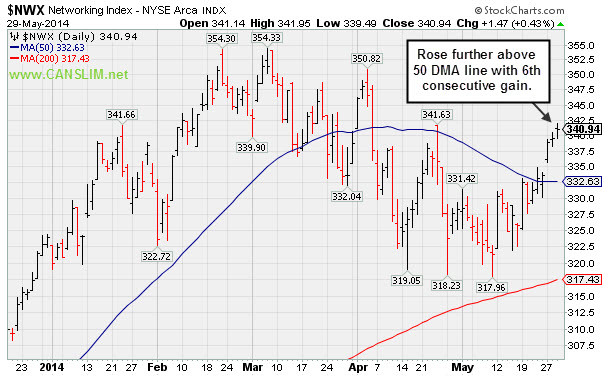
PICTURED: The Networking Index ($NWX +0.43%) rose further above its 50-day moving average (DMA) line with its 6th consecutive gain.
| Oil Services |
$OSX |
291.03 |
+3.67 |
+1.28% |
+3.56% |
| Integrated Oil |
$XOI |
1,629.02 |
+9.33 |
+0.58% |
+8.37% |
| Semiconductor |
$SOX |
598.96 |
+1.30 |
+0.22% |
+11.95% |
| Networking |
$NWX |
340.94 |
+1.47 |
+0.43% |
+5.25% |
| Broker/Dealer |
$XBD |
154.00 |
+0.35 |
+0.23% |
-4.09% |
| Retail |
$RLX |
875.99 |
+6.70 |
+0.77% |
-6.79% |
| Gold & Silver |
$XAU |
84.43 |
+0.79 |
+0.94% |
+0.33% |
| Bank |
$BKX |
68.66 |
+0.02 |
+0.03% |
-0.87% |
| Biotech |
$BTK |
2,601.56 |
+12.15 |
+0.47% |
+11.63% |
|
|
|
 |
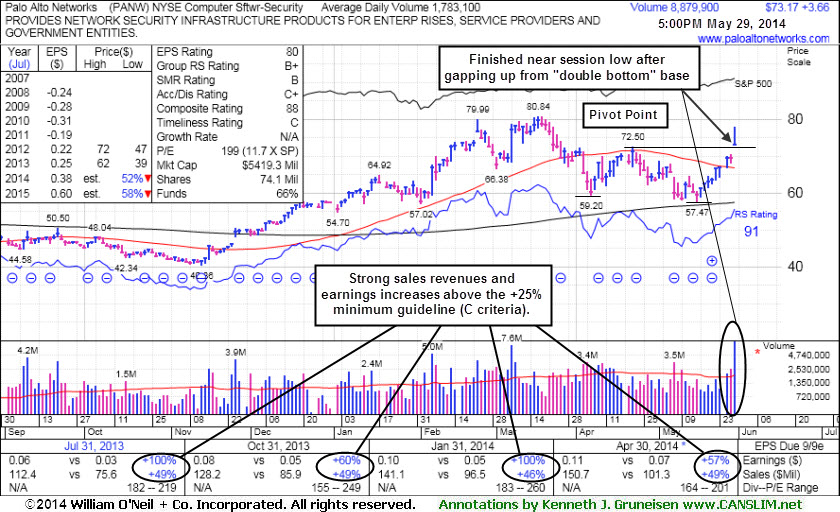
Finish Near Session Low Following Gap Up From Double Bottom Base
Kenneth J. Gruneisen - Passed the CAN SLIM® Master's Exam
Palo Alto Networks (PANW +$3.66 or +5.27% to $73.17) finished near the session low today, a sign that it was encountering distributional pressure after highlighted in yellow with pivot point cited based on its 4/22/14 high in the earlier mid-day report (read here). The gap up gain was backed by 5 times average volume as it completed a bullish "double bottom" base and triggered a technical buy signal. There is some near-term resistance due to overhead supply up through the $80 level, meanwhile it finished -9.5% off its 52-week high.
Subsequent gains into new high territory (N criteria) could help it gain additional upward momentum. Deterioration below the pivot point would raise concerns. Keep in mind that disciplined investors avoid chasing stocks extended more than +5% above their prior high or pivot point, and they always limit losses by selling any stocks that fall more than -7% from their purchase price.
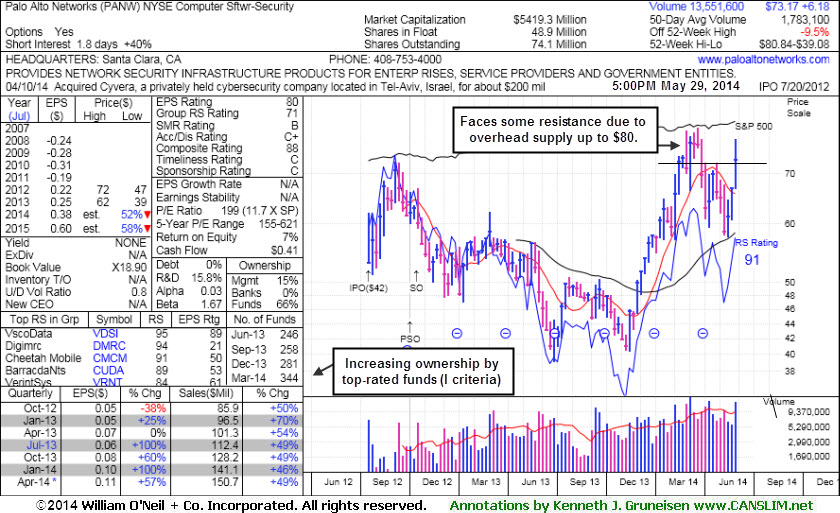
Strong sales revenues increases and earnings through the Apr '14 quarter above the +25% minimum guideline satisfy the C criteria. Its annual earnings (A criteria) history is a bit limited, but growth has been strong since its July 2012 IPO at $42. The number of top-rated funds owning its shares rose from 246 in Jun '13 to 344 in Mar '14, a reassuring sign concerning the I criteria. Its small supply (S criteria) of only 48.9 million shares in the public float is another favorable characteristic. The Computer Software - Security group currently has a B+ rating, reflecting decent leadership (L criteria) in the group.
|
|
|
Color Codes Explained :
Y - Better candidates highlighted by our
staff of experts.
G - Previously featured
in past reports as yellow but may no longer be buyable under the
guidelines.
***Last / Change / Volume data in this table is the closing quote data***
Symbol/Exchange
Company Name
Industry Group |
PRICE |
CHANGE
(%Change) |
Day High |
Volume
(% DAV)
(% 50 day avg vol) |
52 Wk Hi
% From Hi |
Featured
Date |
Price
Featured |
Pivot Featured |
|
Max Buy |
AFSI
-
NASDAQ
Amtrust Financial Svcs
INSURANCE - Property and; Casualty Insurance
|
$44.30
|
-0.44
-0.98% |
$45.30
|
604,983
101.85% of 50 DAV
50 DAV is 594,000
|
$47.10
-5.94%
|
5/21/2014
|
$44.85
|
PP = $44.85
|
|
MB = $47.09
|
Most Recent Note - 5/28/2014 12:13:30 PM
Y - Enduring distributional pressure after hitting a new 52-week high last week with volume-driven gains. Rose from an advanced "3-weeks tight" base with volume-driven gains triggering a technical buy signal. Recent lows near $42-43 define near-term support and any deterioration below that area would raise concerns.
>>> FEATURED STOCK ARTICLE : Finished Strong With Gain From Advanced Base Pattern - 5/21/2014
View all notes |
Set NEW NOTE alert |
CANSLIM.net Company Profile |
SEC
News |
Chart |
Request a new note
C
A N
S L
I M


|
AL
-
NYSE
Air Lease Corp Cl A
DIVERSIFIED SERVICES - Rental and Leasing Services
|
$41.19
|
+1.17
2.92% |
$41.25
|
1,237,563
160.93% of 50 DAV
50 DAV is 769,000
|
$40.68
1.25%
|
5/9/2014
|
$38.27
|
PP = $38.25
|
|
MB = $40.16
|
 Most Recent Note - 5/29/2014 2:23:34 PM
G - Hitting another new 52-week high with today's 5th consecutive gain and its color code is changed to green while rallying beyond its "max buy" level. Prior highs near $38 acted as support during its consolidation after its latest technical breakout. See latest FSU analysis for more details and annotated graphs.
>>> FEATURED STOCK ARTICLE : Finished Near Session Low and Below "Max Buy" Level After Gain on Volume - 5/28/2014
View all notes |
Set NEW NOTE alert |
CANSLIM.net Company Profile |
SEC
News |
Chart |
Request a new note
C
A N
S L
I M
|
EQM
-
NYSE
E Q T Midstream Partners
ENERGY - Oil and Gas Pipelines
|
$81.72
|
+0.02
0.02% |
$82.90
|
144,025
60.77% of 50 DAV
50 DAV is 237,000
|
$81.78
-0.07%
|
12/12/2013
|
$53.17
|
PP = $56.51
|
|
MB = $59.34
|
Most Recent Note - 5/28/2014 6:13:12 PM
G - Hit another new 52-week high today with a gain on light volume. Completed a new Public Offering of 10.75 Million common units on 5/01/14. Fundamental concerns remain after 2 consecutive sub par quarters below the +25% minimum earnings guideline. Its 50 DMA line defines near-term support where a violation may trigger a technical sell signal.
>>> FEATURED STOCK ARTICLE : Best Ever Close With Light Volume Gain - 5/16/2014
View all notes |
Set NEW NOTE alert |
CANSLIM.net Company Profile |
SEC
News |
Chart |
Request a new note
C
A N
S L
I M
|
GRFS
-
NASDAQ
Grifols Sa Ads
Medical-Ethical Drugs
|
$41.38
|
-0.17
-0.41% |
$42.06
|
241,605
39.87% of 50 DAV
50 DAV is 606,000
|
$43.50
-4.87%
|
5/15/2014
|
$41.14
|
PP = $43.55
|
|
MB = $45.73
|
Most Recent Note - 5/28/2014 6:14:10 PM
Y - Pulled back today with slightly higher volume and it has been encountering resistance at prior highs. This Spanish firm from the Medical- Ethical Drugs industry needs subsequent volume-driven gains for new highs to trigger a technical buy signal.
>>> FEATURED STOCK ARTICLE : Perched Within Close Striking Distance of New Highs - 5/15/2014
View all notes |
Set NEW NOTE alert |
CANSLIM.net Company Profile |
SEC
News |
Chart |
Request a new note
C
A N
S L
I M
|
ICON
-
NASDAQ
Iconix Brand Group Inc
CONSUMER NON-DURABLES - Textile - Apparel Footwear
|
$42.17
|
-0.13
-0.31% |
$42.73
|
221,947
41.18% of 50 DAV
50 DAV is 539,000
|
$43.34
-2.70%
|
4/30/2014
|
$42.50
|
PP = $42.57
|
|
MB = $44.70
|
Most Recent Note - 5/28/2014 6:15:01 PM
Y - Pulled back from its all-time high today with a small loss on lighter and well below average volume. Confirming gains above the pivot point with above average volume could trigger a new (or add-on) technical buy signal.
>>> FEATURED STOCK ARTICLE : Consolidating Above 50 DMA Line Still Perched Near 52-Week High - 5/20/2014
View all notes |
Set NEW NOTE alert |
CANSLIM.net Company Profile |
SEC
News |
Chart |
Request a new note
C
A N
S L
I M
|
Symbol/Exchange
Company Name
Industry Group |
PRICE |
CHANGE
(%Change) |
Day High |
Volume
(% DAV)
(% 50 day avg vol) |
52 Wk Hi
% From Hi |
Featured
Date |
Price
Featured |
Pivot Featured |
|
Max Buy |
KORS
-
NYSE
Michael Kors Hldgs Ltd
RETAIL - Apparel Stores
|
$92.28
|
-4.73
-4.88% |
$97.14
|
7,865,799
300.45% of 50 DAV
50 DAV is 2,618,000
|
$101.04
-8.67%
|
5/27/2014
|
$96.70
|
PP = $101.14
|
|
MB = $106.20
|
Most Recent Note - 5/29/2014 12:28:40 PM
Y - Pulling back today and testing support at its 50 DMA line again. Deterioration below that important short-term average would raise concerns. Reported better than expected earnings +56% on +54% sales revenues for the Mar '14 quarter. Highlighted in yellow with new pivot point cited based on its 2/25/14 high plus 10 cents in the 5/27/14 mid-day report (read here). Volume and volatility increase near earnings news. A breakout with volume is needed to trigger a new technical buy signal. See the latest FSU analysis for more details and annotated graphs.
>>> FEATURED STOCK ARTICLE : Earnings News May Prompt Volume and Volatility - 5/27/2014
View all notes |
Set NEW NOTE alert |
CANSLIM.net Company Profile |
SEC
News |
Chart |
Request a new note
C
A N
S L
I M
|
PANW
-
NYSE
Palo Alto Networks
Computer Sftwr-Security
|
$73.17
|
+3.66
5.27% |
$78.00
|
8,878,897
497.98% of 50 DAV
50 DAV is 1,783,000
|
$80.84
-9.49%
|
5/29/2014
|
$75.95
|
PP = $72.50
|
|
MB = $76.13
|
Most Recent Note - 5/29/2014 5:54:12 PM
Y - Finished near the session low, encountering distributional pressure after highlighted in yellow with pivot point cited based on its 4/22/14 high in the earlier mid-day report (read here). Its gap up gain with 5 times average volume completed a bullish "double bottom" base and triggered a technical buy signal. Strong sales revenues increases and earnings through the Apr '14 quarter above the +25% minimum guideline satisfy the C criteria. See the latest FSU analysis for more details and new annotated graphs.
>>> FEATURED STOCK ARTICLE : Finish Near Session Low Following Gap Up From Double Bottom Base - 5/29/2014
View all notes |
Set NEW NOTE alert |
CANSLIM.net Company Profile |
SEC
News |
Chart |
Request a new note
C
A N
S L
I M
|
SN
-
NYSE
Sanchez Energy Corp
ENERGY - Independent Oil and Gas
|
$35.05
|
+1.14
3.36% |
$35.28
|
2,887,556
267.86% of 50 DAV
50 DAV is 1,078,000
|
$34.50
1.59%
|
5/22/2014
|
$33.00
|
PP = $31.59
|
|
MB = $33.17
|
Most Recent Note - 5/29/2014 12:51:10 PM
G - Hitting another new 52-week high with today's 3rd consecutive gain, getting extended from its prior base. Disciplined investors avoid chasing extended stocks. Prior highs near $31-32 define initial support to watch on pullbacks.
>>> FEATURED STOCK ARTICLE : Finish Near Low a Sign of Distributional Pressure Following Gap Up and New High - 5/22/2014
View all notes |
Set NEW NOTE alert |
CANSLIM.net Company Profile |
SEC
News |
Chart |
Request a new note
C
A N
S L
I M
|
TRN
-
NYSE
Trinity Industries Inc
TRANSPORTATION - Railroads
|
$87.48
|
+1.46
1.70% |
$87.65
|
1,647,047
123.93% of 50 DAV
50 DAV is 1,329,000
|
$87.10
0.44%
|
4/30/2014
|
$75.57
|
PP = $76.05
|
|
MB = $79.85
|
Most Recent Note - 5/27/2014 5:59:00 PM
G - Posted a 4th consecutive gain today, getting more extended from its prior base. Traded up as much as +15.26% since first highlighted in yellow in the 4/30/14 mid-day report. Prior highs in the $75-76 area define near-term support to watch on pullbacks.
>>> FEATURED STOCK ARTICLE : Rose Beyond "Max Buy" Level With 7th Consecutive Gain - 5/12/2014
View all notes |
Set NEW NOTE alert |
CANSLIM.net Company Profile |
SEC
News |
Chart |
Request a new note
C
A N
S L
I M
|
WLK
-
NYSE
Westlake Chemical Corp
CHEMICALS - Specialty Chemicals
|
$81.24
|
+2.10
2.65% |
$81.46
|
847,872
120.10% of 50 DAV
50 DAV is 706,000
|
$79.64
2.01%
|
4/29/2014
|
$72.79
|
PP = $69.31
|
|
MB = $72.78
|
Most Recent Note - 5/27/2014 6:01:28 PM
G - Touched a new 52-week high today after stubbornly holding its ground. Prior highs in the $69 area define near-term support to watch.
>>> FEATURED STOCK ARTICLE : Extended From Base Following Volume Driven Gains - 5/8/2014
View all notes |
Set NEW NOTE alert |
CANSLIM.net Company Profile |
SEC
News |
Chart |
Request a new note
C
A N
S L
I M
|
Symbol/Exchange
Company Name
Industry Group |
PRICE |
CHANGE
(%Change) |
Day High |
Volume
(% DAV)
(% 50 day avg vol) |
52 Wk Hi
% From Hi |
Featured
Date |
Price
Featured |
Pivot Featured |
|
Max Buy |
|
|
|
THESE ARE NOT BUY RECOMMENDATIONS!
Comments contained in the body of this report are technical
opinions only. The material herein has been obtained
from sources believed to be reliable and accurate, however,
its accuracy and completeness cannot be guaranteed.
This site is not an investment advisor, hence it does
not endorse or recommend any securities or other investments.
Any recommendation contained in this report may not
be suitable for all investors and it is not to be deemed
an offer or solicitation on our part with respect to
the purchase or sale of any securities. All trademarks,
service marks and trade names appearing in this report
are the property of their respective owners, and are
likewise used for identification purposes only.
This report is a service available
only to active Paid Premium Members.
You may opt-out of receiving report notifications
at any time. Questions or comments may be submitted
by writing to Premium Membership Services 665 S.E. 10 Street, Suite 201 Deerfield Beach, FL 33441-5634 or by calling 1-800-965-8307
or 954-785-1121.
|
|
|

