You are not logged in.
This means you
CAN ONLY VIEW reports that were published prior to Monday, April 14, 2025.
You
MUST UPGRADE YOUR MEMBERSHIP if you want to see any current reports.
AFTER MARKET UPDATE - WEDNESDAY, MAY 28TH, 2014
Previous After Market Report Next After Market Report >>>
|
|
|
|
DOW |
-42.32 |
16,633.18 |
-0.25% |
|
Volume |
621,355,470 |
-4% |
|
Volume |
1,632,215,120 |
-4% |
|
NASDAQ |
-12.00 |
4,225.07 |
-0.28% |
|
Advancers |
1,593 |
50% |
|
Advancers |
1,060 |
38% |
|
S&P 500 |
-2.13 |
1,909.78 |
-0.11% |
|
Decliners |
1,468 |
46% |
|
Decliners |
1,663 |
59% |
|
Russell 2000 |
-5.52 |
1,136.68 |
-0.48% |
|
52 Wk Highs |
144 |
|
|
52 Wk Highs |
74 |
|
|
S&P 600 |
-4.20 |
654.12 |
-0.64% |
|
52 Wk Lows |
27 |
|
|
52 Wk Lows |
27 |
|
|
 |
Major Indices Pulled Back Slightly With Lighter Volume Totals
Kenneth J. Gruneisen - Passed the CAN SLIM® Master's Exam
The major averages finished slightly lower on Wednesday. The volume was reported lighter than the prior session totals on the NYSE and on the Nasdaq exchange, a sign that institutional selling pressure was not on the rise. Advancers narrowly led decliners on the NYSE but decliners led advancers by an 8-5 margin on the Nasdaq exchange. There were 54 high-ranked companies from the CANSLIM.net Leaders List that made new 52-week highs and appeared on the CANSLIM.net BreakOuts Page, down from the total of 78 stocks on the prior session. New 52-week highs easily outnumbered new 52-week lows on the NYSE and on the Nasdaq exchange. There were gains for 6 of the 9 high-ranked companies currently included on the Featured Stocks Page. Technically, the S&P 500 Index's latest surge into new high territory coupled with an expansion in leadership (new 52-week highs) helped signal that the market direction (M criteria) is in a "confirmed uptrend". Any new buying efforts should be selective and focused in stocks meeting all key criteria of the fact-based investment system.
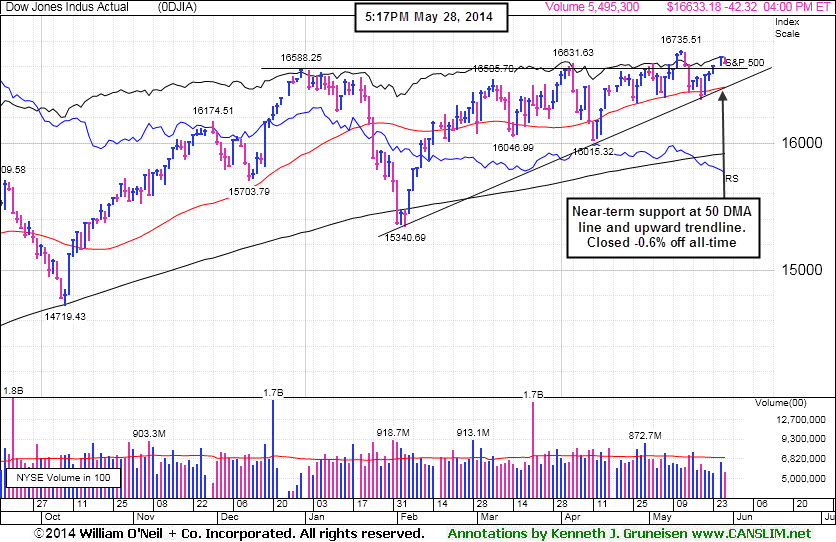
The Dow declined 42 points to 16,633. The S&P 500 fell from a record high as it lost 2 points to 1,909. The NASDAQ retreated 12 points to 4,225.
Equities gave up some ground ahead of Thursday's GDP update. The report is expected to show the economy contracted by -0.5% in the first-quarter after a preliminary reading of +0.1% growth. Investors also digested a batch of earnings results. Toll Brothers (TOL +2.1%) and Workday (WDAY +2.4%) rose after both companies reported better-than-expected profit tallies. On the downside, DSW (DSW -27%) fell hard after slashing its full-year earnings outlook.
Overall, six of the 10 S&P 500 sectors finished in positive territory. A drop in Treasury yields boosted the appeal of dividend-paying stocks in telecommunications and utilities. AT&T (T +0.4%) and Exelon (EXC +1.7%). Health care was one of the worst performing groups. Allergan (AGN -5.3%) following news that Valeant Pharmaceuticals (VRX raised its takeover offer for the drugmaker.
Treasuries rallied and a government auction of five-year notes received stronger-than-average demand. The 10-year note rose 21/32 to yield 2.44%. The 30-year bond increased more than a full point to yield 3.29%.
Keep in mind that any sustained and meaningful market advance requires leadership - a healthy crop of stocks hitting new 52-week highs. The CANSLIM.net Featured Stocks Page shows the most action-worthy candidates and their latest notes and a Headline Link directs members to the latest detailed analysis with data-packed graphs annotated by a Certified expert along with links to additional resources. The Premium Member Homepage includes "dynamic archives" to all prior pay reports published. Watch for an announcement via email concerning the next WEBCAST.
PICTURED: The Dow Jones Industrial Average finished -0.6% off its all-time high. Near-term support to watch is at its 50-day moving average (DMA) line and an upward trendline, levels where subsequent violations would raise concerns.
|
 Kenneth J. Gruneisen started out as a licensed stockbroker in August 1987, a couple of months prior to the historic stock market crash that took the Dow Jones Industrial Average down -22.6% in a single day. He has published daily fact-based fundamental and technical analysis on high-ranked stocks online for two decades. Through FACTBASEDINVESTING.COM, Kenneth provides educational articles, news, market commentary, and other information regarding proven investment systems that work in good times and bad.
Comments contained in the body of this report are technical opinions only and are not necessarily those of Gruneisen Growth Corp. The material herein has been obtained from sources believed to be reliable and accurate, however, its accuracy and completeness cannot be guaranteed. Our firm, employees, and customers may effect transactions, including transactions contrary to any recommendation herein, or have positions in the securities mentioned herein or options with respect thereto. Any recommendation contained in this report may not be suitable for all investors and it is not to be deemed an offer or solicitation on our part with respect to the purchase or sale of any securities. |
|
 |
Retail and Financial Groups Edged Lower; Tech and Energy Groups Mixed
Kenneth J. Gruneisen - Passed the CAN SLIM® Master's Exam
The Retail Index ($RLX -0.29%) edged lower and influential financial groups also had a slightly negative bias on Wednesday as the Broker/Dealer Index ($XBD -0.67%) and the Bank Index ($BKX -0.10%) fell. The Semiconductor Index ($SOX +0.10%) and the Networking Index ($NWX +0.17%) eked out tiny gains while the Biotechnology Index ($BTK -0.41%) dragged the tech sector lower. Energy-related shares were mixed as the Integrated Oil Index ($XOI +0.43%) posted a small gain while the Oil Services Index ($OSX -0.54%) fell. The Gold & Silver Index ($XAU -1.70%) was a standout decliner.
Charts courtesy www.stockcharts.com
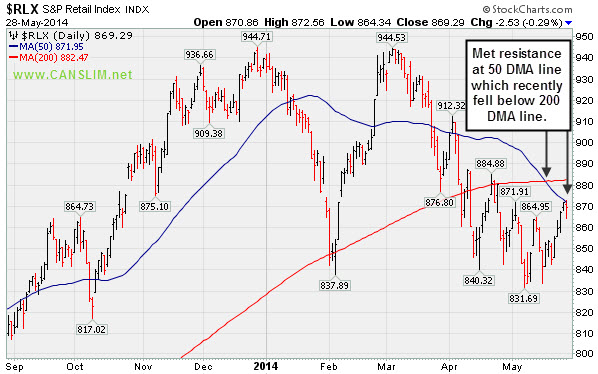
PICTURED: The Retail Index ($RLX -0.29%) met resistance at its 50-day moving average (DMA) line. Technically, that important short-term average recently slumped below the longer-term 200 DMA line, which is a discouraging sign.
| Oil Services |
$OSX |
287.36 |
-1.55 |
-0.54% |
+2.25% |
| Integrated Oil |
$XOI |
1,619.69 |
+6.92 |
+0.43% |
+7.75% |
| Semiconductor |
$SOX |
597.66 |
+0.58 |
+0.10% |
+11.71% |
| Networking |
$NWX |
339.47 |
+0.58 |
+0.17% |
+4.79% |
| Broker/Dealer |
$XBD |
153.65 |
-1.03 |
-0.67% |
-4.30% |
| Retail |
$RLX |
869.29 |
-2.53 |
-0.29% |
-7.50% |
| Gold & Silver |
$XAU |
83.64 |
-1.45 |
-1.70% |
-0.61% |
| Bank |
$BKX |
68.64 |
-0.07 |
-0.10% |
-0.90% |
| Biotech |
$BTK |
2,589.41 |
-10.71 |
-0.41% |
+11.11% |
|
|
|
 |
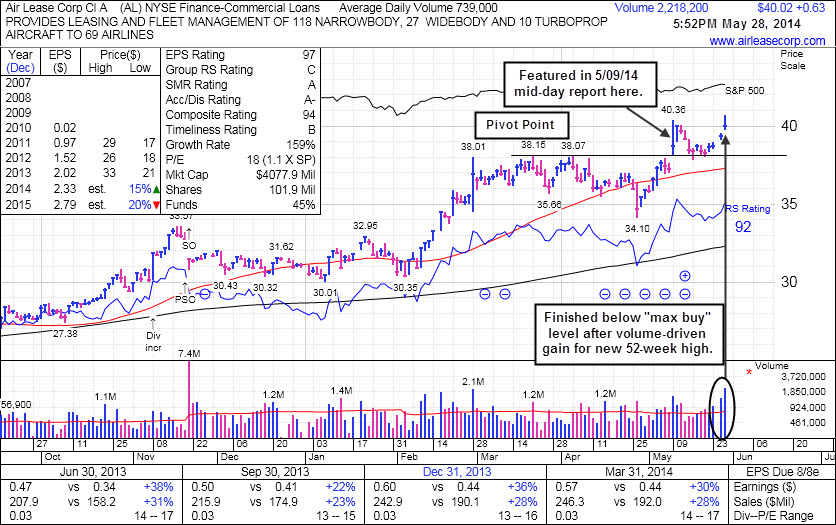
Finished Near Session Low and Below "Max Buy" Level After Gain on Volume
Kenneth J. Gruneisen - Passed the CAN SLIM® Master's Exam
Air Lease Corp (AL +$0.63 or +1.60% to $40.02) gapped up today and hit a new 52-week high with 3 times average volume behind its gain, however it appears to have encountered some distributional pressure as it finished near the session low after slumping back below its "max buy" level. It was highlighted in yellow with pivot point based on its 3/21/14 high plus 10 cents in the 5/09/14 mid-day report (read here) when its gain backed by +119% above average volume clinched a convincing technical buy signal. Disciplined investors always avoid chasing stocks more than +5% above their pivot point and always limit losses by selling if any stock falls more than -7% from their purchase price.
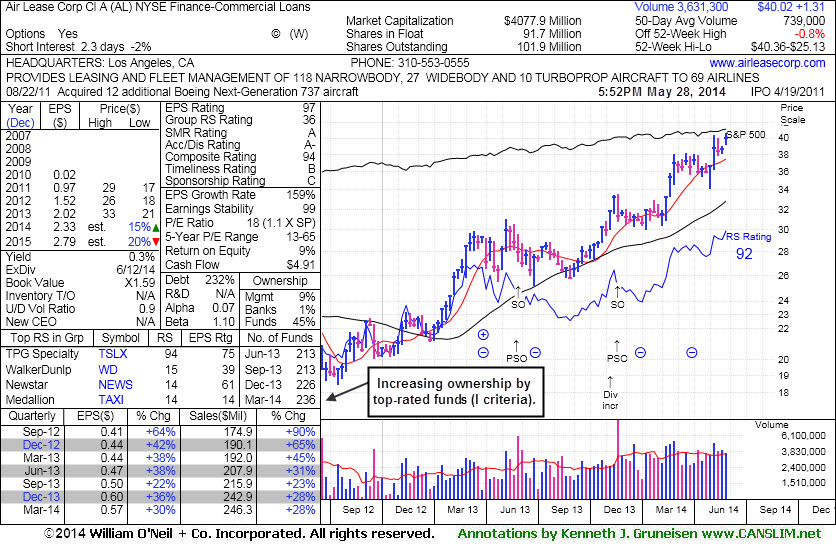
It reported earnings +30% on +28% sales revenues for the Mar '14 quarter, and 3 of the past 4 quarterly comparisons showed earnings increases above the +25% minimum guideline (C criteria). It completed a Secondary Offering on 11/21/13 and an earlier Secondary Offering on 5/31/13. The Commercial Services - Leasing firm has seen the number of top-rated funds owning its shares rise from 177 in Sep '12 to 236 in Mar '14, which is reassuring concerning the I criteria.
Its earnings Per Share Rank is 97, well above the 80+ minimum for buy candidates. Its Relative Strength Rating of 92 is above the 80+ minimum guideline. Those ratings had slumped below the minimum threshold when AL was shown in this FSU section on 6/17/13 with an annotated graph under the headline, "Faltering Fundamental and Technical Characteristics Raise Concerns".
|
|
|
Color Codes Explained :
Y - Better candidates highlighted by our
staff of experts.
G - Previously featured
in past reports as yellow but may no longer be buyable under the
guidelines.
***Last / Change / Volume data in this table is the closing quote data***
Symbol/Exchange
Company Name
Industry Group |
PRICE |
CHANGE
(%Change) |
Day High |
Volume
(% DAV)
(% 50 day avg vol) |
52 Wk Hi
% From Hi |
Featured
Date |
Price
Featured |
Pivot Featured |
|
Max Buy |
AFSI
-
NASDAQ
Amtrust Financial Svcs
INSURANCE - Property and; Casualty Insurance
|
$44.74
|
-0.16
-0.36% |
$45.49
|
1,004,532
171.13% of 50 DAV
50 DAV is 587,000
|
$47.10
-5.01%
|
5/21/2014
|
$44.85
|
PP = $44.85
|
|
MB = $47.09
|
 Most Recent Note - 5/28/2014 12:13:30 PM
Y - Enduring distributional pressure after hitting a new 52-week high last week with volume-driven gains. Rose from an advanced "3-weeks tight" base with volume-driven gains triggering a technical buy signal. Recent lows near $42-43 define near-term support and any deterioration below that area would raise concerns.
>>> FEATURED STOCK ARTICLE : Finished Strong With Gain From Advanced Base Pattern - 5/21/2014
View all notes |
Set NEW NOTE alert |
CANSLIM.net Company Profile |
SEC
News |
Chart |
Request a new note
C
A N
S L
I M


|
AL
-
NYSE
Air Lease Corp Cl A
DIVERSIFIED SERVICES - Rental and Leasing Services
|
$40.02
|
+0.63
1.60% |
$40.68
|
2,218,340
300.18% of 50 DAV
50 DAV is 739,000
|
$40.36
-0.84%
|
5/9/2014
|
$38.27
|
PP = $38.25
|
|
MB = $40.16
|
Most Recent Note - 5/28/2014 6:12:09 PM
Y - Hit a new 52-week high with today's gain backed by 3 times average volume. Color code is changed to yellow after finishing just below its "max buy" level. Prior highs near $38 acted as support during its consolidation after its latest technical breakout. See latest FSU analysis for more details and new annotated graphs.
>>> FEATURED STOCK ARTICLE : Finished Near Session Low and Below "Max Buy" Level After Gain on Volume - 5/28/2014
View all notes |
Set NEW NOTE alert |
CANSLIM.net Company Profile |
SEC
News |
Chart |
Request a new note
C
A N
S L
I M
|
EQM
-
NYSE
E Q T Midstream Partners
ENERGY - Oil and Gas Pipelines
|
$81.70
|
+1.67
2.09% |
$81.78
|
124,823
52.89% of 50 DAV
50 DAV is 236,000
|
$80.20
1.87%
|
12/12/2013
|
$53.17
|
PP = $56.51
|
|
MB = $59.34
|
Most Recent Note - 5/28/2014 6:13:12 PM
G - Hit another new 52-week high today with a gain on light volume. Completed a new Public Offering of 10.75 Million common units on 5/01/14. Fundamental concerns remain after 2 consecutive sub par quarters below the +25% minimum earnings guideline. Its 50 DMA line defines near-term support where a violation may trigger a technical sell signal.
>>> FEATURED STOCK ARTICLE : Best Ever Close With Light Volume Gain - 5/16/2014
View all notes |
Set NEW NOTE alert |
CANSLIM.net Company Profile |
SEC
News |
Chart |
Request a new note
C
A N
S L
I M
|
GRFS
-
NASDAQ
Grifols Sa Ads
Medical-Ethical Drugs
|
$41.55
|
-0.31
-0.74% |
$42.22
|
454,197
74.58% of 50 DAV
50 DAV is 609,000
|
$43.50
-4.48%
|
5/15/2014
|
$41.14
|
PP = $43.55
|
|
MB = $45.73
|
Most Recent Note - 5/28/2014 6:14:10 PM
Y - Pulled back today with slightly higher volume and it has been encountering resistance at prior highs. This Spanish firm from the Medical- Ethical Drugs industry needs subsequent volume-driven gains for new highs to trigger a technical buy signal.
>>> FEATURED STOCK ARTICLE : Perched Within Close Striking Distance of New Highs - 5/15/2014
View all notes |
Set NEW NOTE alert |
CANSLIM.net Company Profile |
SEC
News |
Chart |
Request a new note
C
A N
S L
I M
|
ICON
-
NASDAQ
Iconix Brand Group Inc
CONSUMER NON-DURABLES - Textile - Apparel Footwear
|
$42.30
|
-0.48
-1.12% |
$42.82
|
331,503
60.27% of 50 DAV
50 DAV is 550,000
|
$43.34
-2.40%
|
4/30/2014
|
$42.50
|
PP = $42.57
|
|
MB = $44.70
|
Most Recent Note - 5/28/2014 6:15:01 PM
Y - Pulled back from its all-time high today with a small loss on lighter and well below average volume. Confirming gains above the pivot point with above average volume could trigger a new (or add-on) technical buy signal.
>>> FEATURED STOCK ARTICLE : Consolidating Above 50 DMA Line Still Perched Near 52-Week High - 5/20/2014
View all notes |
Set NEW NOTE alert |
CANSLIM.net Company Profile |
SEC
News |
Chart |
Request a new note
C
A N
S L
I M
|
Symbol/Exchange
Company Name
Industry Group |
PRICE |
CHANGE
(%Change) |
Day High |
Volume
(% DAV)
(% 50 day avg vol) |
52 Wk Hi
% From Hi |
Featured
Date |
Price
Featured |
Pivot Featured |
|
Max Buy |
KORS
-
NYSE
Michael Kors Hldgs Ltd
RETAIL - Apparel Stores
|
$97.01
|
+1.27
1.33% |
$97.60
|
11,323,092
467.32% of 50 DAV
50 DAV is 2,423,000
|
$101.04
-3.99%
|
5/27/2014
|
$96.70
|
PP = $101.14
|
|
MB = $106.20
|
Most Recent Note - 5/28/2014 6:18:01 PM
Y - Managed a "positive reversal" today and finished near the session high with a volume-driven gain after early lows testing support at its 50 DMA line. Reported better than expected earnings +56% on +54% sales revenues for the Mar '14 quarter. Highlighted in yellow with new pivot point cited based on its 2/25/14 high plus 10 cents in the 5/27/14 mid-day report (read here). Volume and volatility increase near earnings news. A breakout with volume is needed to trigger a new technical buy signal. See the latest FSU analysis for more details and annotated graphs.
>>> FEATURED STOCK ARTICLE : Earnings News May Prompt Volume and Volatility - 5/27/2014
View all notes |
Set NEW NOTE alert |
CANSLIM.net Company Profile |
SEC
News |
Chart |
Request a new note
C
A N
S L
I M
|
SN
-
NYSE
Sanchez Energy Corp
ENERGY - Independent Oil and Gas
|
$33.91
|
+1.08
3.29% |
$34.18
|
2,445,093
235.11% of 50 DAV
50 DAV is 1,040,000
|
$34.50
-1.71%
|
5/22/2014
|
$33.00
|
PP = $31.59
|
|
MB = $33.17
|
Most Recent Note - 5/28/2014 1:13:16 PM
G - Gapped up today following a strong finish on the prior session, rallying above its pivot point with +75% above average and clinching a technical buy signal. Color code is changed to green after getting extended more than +5% above the pivot point.
>>> FEATURED STOCK ARTICLE : Finish Near Low a Sign of Distributional Pressure Following Gap Up and New High - 5/22/2014
View all notes |
Set NEW NOTE alert |
CANSLIM.net Company Profile |
SEC
News |
Chart |
Request a new note
C
A N
S L
I M
|
TRN
-
NYSE
Trinity Industries Inc
TRANSPORTATION - Railroads
|
$86.02
|
+0.38
0.44% |
$86.46
|
1,278,852
97.10% of 50 DAV
50 DAV is 1,317,000
|
$87.10
-1.24%
|
4/30/2014
|
$75.57
|
PP = $76.05
|
|
MB = $79.85
|
Most Recent Note - 5/27/2014 5:59:00 PM
G - Posted a 4th consecutive gain today, getting more extended from its prior base. Traded up as much as +15.26% since first highlighted in yellow in the 4/30/14 mid-day report. Prior highs in the $75-76 area define near-term support to watch on pullbacks.
>>> FEATURED STOCK ARTICLE : Rose Beyond "Max Buy" Level With 7th Consecutive Gain - 5/12/2014
View all notes |
Set NEW NOTE alert |
CANSLIM.net Company Profile |
SEC
News |
Chart |
Request a new note
C
A N
S L
I M
|
WLK
-
NYSE
Westlake Chemical Corp
CHEMICALS - Specialty Chemicals
|
$79.14
|
+2.25
2.92% |
$79.64
|
1,013,727
145.86% of 50 DAV
50 DAV is 695,000
|
$78.00
1.46%
|
4/29/2014
|
$72.79
|
PP = $69.31
|
|
MB = $72.78
|
Most Recent Note - 5/27/2014 6:01:28 PM
G - Touched a new 52-week high today after stubbornly holding its ground. Prior highs in the $69 area define near-term support to watch.
>>> FEATURED STOCK ARTICLE : Extended From Base Following Volume Driven Gains - 5/8/2014
View all notes |
Set NEW NOTE alert |
CANSLIM.net Company Profile |
SEC
News |
Chart |
Request a new note
C
A N
S L
I M
|
|
|
|
THESE ARE NOT BUY RECOMMENDATIONS!
Comments contained in the body of this report are technical
opinions only. The material herein has been obtained
from sources believed to be reliable and accurate, however,
its accuracy and completeness cannot be guaranteed.
This site is not an investment advisor, hence it does
not endorse or recommend any securities or other investments.
Any recommendation contained in this report may not
be suitable for all investors and it is not to be deemed
an offer or solicitation on our part with respect to
the purchase or sale of any securities. All trademarks,
service marks and trade names appearing in this report
are the property of their respective owners, and are
likewise used for identification purposes only.
This report is a service available
only to active Paid Premium Members.
You may opt-out of receiving report notifications
at any time. Questions or comments may be submitted
by writing to Premium Membership Services 665 S.E. 10 Street, Suite 201 Deerfield Beach, FL 33441-5634 or by calling 1-800-965-8307
or 954-785-1121.
|
|
|

