You are not logged in.
This means you
CAN ONLY VIEW reports that were published prior to Sunday, March 23, 2025.
You
MUST UPGRADE YOUR MEMBERSHIP if you want to see any current reports.
AFTER MARKET UPDATE - THURSDAY, MAY 23RD, 2019
Previous After Market Report Next After Market Report >>>
|
|
|
|
DOW |
-286.14 |
25,490.47 |
-1.11% |
|
Volume |
869,912,550 |
+27% |
|
Volume |
2,256,174,650 |
+21% |
|
NASDAQ |
-122.56 |
7,628.28 |
-1.58% |
|
Advancers |
642 |
23% |
|
Advancers |
664 |
22% |
|
S&P 500 |
-34.03 |
2,822.24 |
-1.19% |
|
Decliners |
2,181 |
77% |
|
Decliners |
2,394 |
78% |
|
Russell 2000 |
-30.25 |
1,501.38 |
-1.97% |
|
52 Wk Highs |
77 |
|
|
52 Wk Highs |
51 |
|
|
S&P 600 |
-20.79 |
909.45 |
-2.23% |
|
52 Wk Lows |
178 |
|
|
52 Wk Lows |
191 |
|
|
 |
Major Indices Show More Worrisome Distributional Action
Kenneth J. Gruneisen - Passed the CAN SLIM® Master's Exam
The Dow fell 286 points while the S&P 500 declined 1.2%. The Nasdaq Composite retreated 1.6%. The volume totals reported were higher on the NYSE and on the Nasdaq exchange, revealing greater conviction behind the institutional selling. Breadth was negative as decliners led advancers by a 3-1 margin on the NYSE and by more than a 3-1 margin on the Nasdaq exchange. There were 19 high-ranked companies from the Leaders List that hit new 52-week highs and were listed on the BreakOuts Page, versus the total of 49 on the prior session. New 52-week lows totals swelled and easily outnumbered new 52-week highs on the NYSE and on the Nasdaq exchange. While the major indices (M criteria) are showing action indicative of a market "correction" the fact-based investment system discourages any new buying efforts and suggests selling stocks on a case-by-case basis, raising cash levels to reduce market exposure. The Featured Stocks Page provides the most timely analysis on high-ranked leaders. Charts used courtesy of www.stockcharts.com
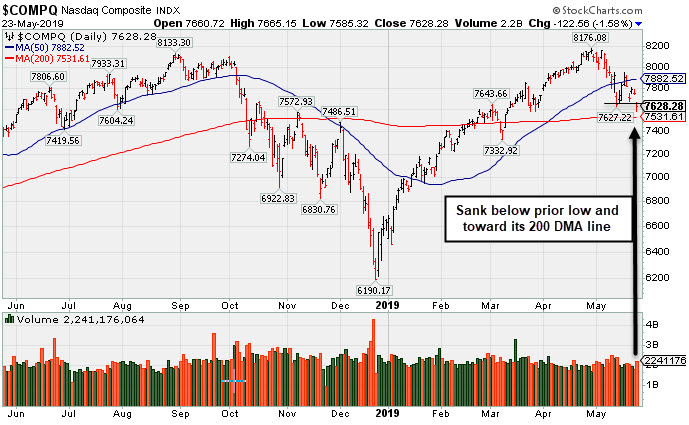
PICTURED: The Nasdaq Composite Index undercut its prior low, ending its brief rally attempt, while slumping toward its 200 DMA line. Disciplined investors have been watching for a follow-through day of big gains (more than +1%) from at least one of the major indices backed with higher volume and an expansion in stocks reaching new 52-week highs - all of which are critical components for a new confirmed uptrend under the fact-based system.
U.S. equities finished firmly lower Thursday as renewed trade concerns weighed on investor sentiment. Overnight, Beijing’s Ministry of Commerce said the U.S. needs to correct its “wrong actions” in order for trade negotiations to continue.
Treasuries strengthened amid increased demand for perceived “safe haven” assets. The yield on the 10-year note tumbled six basis points to 2.31%, the lowest level since late 2017. Also notably, the yield spread between the benchmark note and three-month bill inverted amid the equity sell-off. The short-dated bill sits at 2.36%. On the data front, a preliminary update from Markit on U.S. manufacturing showed activity expanded at the slowest pace since September 2009. An additional reading revealed new home sales dropped 6.9% in April, from the prior month’s upwardly revised 8.1% gain.
The Energy sector paced the decline as WTI crude slumped 5.7%. With today’s sharp weakness, WTI crude is on pace for its worst week in more than five months. Industrials and Technology stocks also underperformed with the sectors shedding 1.6% and 1.7%, respectively. The defensive Real Estate and Utilities groups were the only sectors to finish the session in positive territory. In earnings, Best Buy (BBY -4.84%) fell despite topping consensus profit, revenue and same-store sales projections. Meanwhile, L Brands (LB +12.84%) after posting a surprise first-quarter profit. |
 Kenneth J. Gruneisen started out as a licensed stockbroker in August 1987, a couple of months prior to the historic stock market crash that took the Dow Jones Industrial Average down -22.6% in a single day. He has published daily fact-based fundamental and technical analysis on high-ranked stocks online for two decades. Through FACTBASEDINVESTING.COM, Kenneth provides educational articles, news, market commentary, and other information regarding proven investment systems that work in good times and bad.
Comments contained in the body of this report are technical opinions only and are not necessarily those of Gruneisen Growth Corp. The material herein has been obtained from sources believed to be reliable and accurate, however, its accuracy and completeness cannot be guaranteed. Our firm, employees, and customers may effect transactions, including transactions contrary to any recommendation herein, or have positions in the securities mentioned herein or options with respect thereto. Any recommendation contained in this report may not be suitable for all investors and it is not to be deemed an offer or solicitation on our part with respect to the purchase or sale of any securities. |
|
 |
Energy, Technology, Retail, and Financial Groups Fell
Kenneth J. Gruneisen - Passed the CAN SLIM® Master's Exam
The Bank Index ($BKX -1.82%) and Broker/Dealer Index ($XBD -1.24%) posted losses along with the Retail Index ($RLX -1.39%). The tech sector had a negative bias as the Semiconductor Index ($SOX -1.65%), Networking Index ($NWX -2.05%), and the Biotech Index ($BTK -1.28%) fell. Energy-linked groups clearly had a negative bias as the Oil Services Index ($OSX -5.81%) and the Integrated Oil Index ($XOI -3.42%) both were standout decliners. Meanwhile, the Gold & Silver Index ($XAU +0.10%) held its ground.
Charts courtesy of www.stockcharts.com
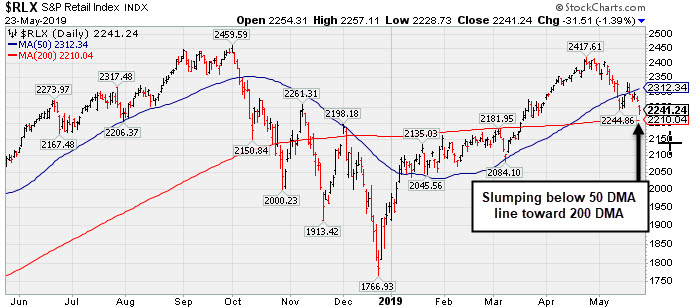
PICTURED: The Retail Index ($RLX -1.39%) is sputtering below its 50-day toward its 200-day moving average (DMA) line.
| Oil Services |
$OSX |
79.14 |
-4.88 |
-5.81% |
-1.81% |
| Integrated Oil |
$XOI |
1,216.68 |
-43.06 |
-3.42% |
+4.97% |
| Semiconductor |
$SOX |
1,322.84 |
-22.20 |
-1.65% |
+14.51% |
| Networking |
$NWX |
552.13 |
-11.58 |
-2.05% |
+12.99% |
| Broker/Dealer |
$XBD |
260.28 |
-3.28 |
-1.24% |
+9.67% |
| Retail |
$RLX |
2,241.24 |
-31.51 |
-1.39% |
+14.85% |
| Gold & Silver |
$XAU |
66.21 |
+0.07 |
+0.11% |
-6.30% |
| Bank |
$BKX |
94.91 |
-1.77 |
-1.83% |
+10.63% |
| Biotech |
$BTK |
4,469.77 |
-57.91 |
-1.28% |
+5.90% |
|
|
|
 |
Pulling Back From High After Impressive Rally
Kenneth J. Gruneisen - Passed the CAN SLIM® Master's Exam
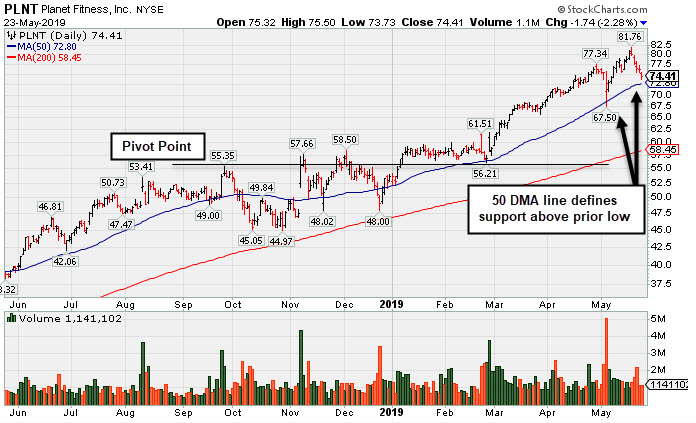
Planet Fitness Inc Cl A (PLNT -$1.74 or -2.28% to $74.41) pulled back today for a 5th consecutive loss after getting very extended from any sound base. Its 50-day moving average (DMA) line ($72.80) and prior low define near-term support.
Fundamentals remain strong as it recently reported earnings +30% on +23% sales revenues for its first quarter ended March 31, 2019, marking a 5th consecutive quarterly earnings comparison above the +25% minimum guideline (C criteria). Annual earnings (A criteria) history included a small downturn in FY '15 but has been strong since. Completed its Aug 2015 IPO at $14.06 and completed Secondary Offerings on 6/22/16, 9/26/16, 3/10/17 and 5/08/17.
PLNT traded up as much as +43% since first highlighted in yellow with pivot point cited based on its 9/26/18 high plus 10 cents in the 11/07/18 mid-day report (read here). It rallied impressively into new high territory since last shown in this FSU section on 4/05/19 with an annotated graph under the headline, "Perched Near High Very Extended From Prior Base".
The number of top-rated funds owning its shares rose from 373 in Dec '17 to 595 in Mar '19, a reassuring sign concerning the I criteria. The current Up/Down Volume Ratio of 1.2 is an unbiased indication its shares have been under slight accumulation over the past 50 days. It has earned a Timeliness Rating of A and Sponsorship Rating of B. Its small supply of 76.1 million shares in the public float can contribute to greater price volatility in the event of institutional buying or selling.
Charts courtesy of www.stockcharts.com
|
|
|
Color Codes Explained :
Y - Better candidates highlighted by our
staff of experts.
G - Previously featured
in past reports as yellow but may no longer be buyable under the
guidelines.
***Last / Change / Volume data in this table is the closing quote data***
Symbol/Exchange
Company Name
Industry Group |
PRICE |
CHANGE
(%Change) |
Day High |
Volume
(% DAV)
(% 50 day avg vol) |
52 Wk Hi
% From Hi |
Featured
Date |
Price
Featured |
Pivot Featured |
|
Max Buy |
SPSC
-
NASDAQ
S P S Commerce Inc
COMPUTER SOFTWARE and SERVICES - Application Software
|
$100.57
|
-4.38
-4.17% |
$104.51
|
109,003
71.71% of 50 DAV
50 DAV is 152,000
|
$115.00
-12.55%
|
3/26/2019
|
$107.12
|
PP = $113.41
|
|
MB = $119.08
|
 Most Recent Note - 5/23/2019 4:47:32 PM
G - Met resistance while sputtering below its 50 DMA line ($104.72) and it faces resistance due to overhead supply up to the $115 level. Recent low ($98.59 on 4/18/19) defines important near-term support to watch. Fundamentals remain strong.
>>> FEATURED STOCK ARTICLE : Sputtering Near 50-Day Average Line Building Base-On-Base - 5/1/2019 |
View all notes |
Set NEW NOTE alert |
Company Profile |
SEC
News |
Chart |
Request a new note
C
A
S
I |
EPAM
-
NYSE
Epam Systems Inc
COMPUTER SOFTWARE and SERVICES - Information Technology Service
|
$166.41
|
-4.82
-2.81% |
$170.33
|
325,819
87.12% of 50 DAV
50 DAV is 374,000
|
$180.55
-7.83%
|
5/9/2019
|
$169.25
|
PP = $180.55
|
|
MB = $189.58
|
Most Recent Note - 5/23/2019 4:53:00 PM
G - Met resistance near its 50 DMA line ($171) and a rebound above that important short-term average is needed for its outlook to improve. Reported earnings +34% on +23% sales revenues for the Mar '19 quarter, continuing its strong earnings track record.
>>> FEATURED STOCK ARTICLE : Found Support and Closed in Upper Third of Day's Range - 5/9/2019 |
View all notes |
Set NEW NOTE alert |
Company Profile |
SEC
News |
Chart |
Request a new note
C
A
S
I |
ENV
-
NYSE
Envestnet Inc
FINANCIAL SERVICES - Diversified Investments
|
$67.50
|
-1.00
-1.46% |
$68.05
|
175,121
56.67% of 50 DAV
50 DAV is 309,000
|
$72.67
-7.11%
|
3/15/2019
|
$66.05
|
PP = $64.90
|
|
MB = $68.15
|
Most Recent Note - 5/21/2019 5:49:23 PM
G - Rebounded above its 50 DMA line ($67.79) with today's gain on average volume. Weak action came after recently reporting earnings +5% on +1% sales revenues for the Mar '19 quarter, below the +25% minimum earnings guideline (C criteria). The prior high ($64.80 on 9/14/18) defines important near-term support to watch.
>>> FEATURED STOCK ARTICLE : Negative Reversal After Another New High - 4/24/2019 |
View all notes |
Set NEW NOTE alert |
Company Profile |
SEC
News |
Chart |
Request a new note
C
A
S
I |
TPL
-
NYSE
Texas Pacific Land Trust
Real Estate Dvlpmt/Ops
|
$785.63
|
-43.54
-5.25% |
$820.00
|
11,258
75.05% of 50 DAV
50 DAV is 15,000
|
$915.66
-14.20%
|
5/15/2019
|
$850.01
|
PP = $915.76
|
|
MB = $961.55
|
Most Recent Note - 5/23/2019 12:57:01 PM
G - Color code is changed to green while slumping below its 50 DMA line ($817) with today's loss raising concerns. A prompt rebound is needed for its outlook to improve. Subsequent gains above the pivot point backed by at least +40% above average volume may trigger a technical buy signal. Keep in mind that the major averages (M criteria) need a follow-through day to confirm a new uptrend before any new buying efforts are justified under the fact-based investment system. Reported earnings +222% on +219% sales revenues for the Mar '19 quarter continuing its strong earnings track record.
>>> FEATURED STOCK ARTICLE : Recently Found Support and Rose Toward All-Time High - 5/17/2019 |
View all notes |
Set NEW NOTE alert |
Company Profile |
SEC
News |
Chart |
Request a new note
C
A
S
I |
LHCG
-
NASDAQ
L H C Group Inc
HEALTH SERVICES - Home Health Care
|
$114.00
|
-4.87
-4.10% |
$119.63
|
327,919
126.61% of 50 DAV
50 DAV is 259,000
|
$122.20
-6.71%
|
4/29/2019
|
$110.94
|
PP = $115.64
|
|
MB = $121.42
|
Most Recent Note - 5/23/2019 4:39:43 PM
Y - Slumped back below its "max buy" level and undercut its pivot point with a loss today on higher volume and its color code is changed to yellow. Its 50 DMA line ($111) defines near-term support Fundamentals remain strong.
>>> FEATURED STOCK ARTICLE : Long-Term Care Firm Hovering Near All-Time High - 5/14/2019 |
View all notes |
Set NEW NOTE alert |
Company Profile |
SEC
News |
Chart |
Request a new note
C
A
S
I |
Symbol/Exchange
Company Name
Industry Group |
PRICE |
CHANGE
(%Change) |
Day High |
Volume
(% DAV)
(% 50 day avg vol) |
52 Wk Hi
% From Hi |
Featured
Date |
Price
Featured |
Pivot Featured |
|
Max Buy |
ENSG
-
NASDAQ
Ensign Group Inc
HEALTH SERVICES - Long-Term Care Facilities
|
$53.74
|
-2.46
-4.38% |
$56.03
|
270,642
89.32% of 50 DAV
50 DAV is 303,000
|
$58.14
-7.57%
|
4/30/2019
|
$51.46
|
PP = $53.30
|
|
MB = $55.97
|
Most Recent Note - 5/23/2019 4:45:01 PM
Y - Pulled back toward its pivot point with today's big loss. Reported earnings +22% on +12% sales revenues for the Mar '19 quarter, below the +25% minimum earnings guideline (C criteria), raising fundamental concerns.
>>> FEATURED STOCK ARTICLE : Two Damaging Losses Hurt Outlook - 4/17/2019 |
View all notes |
Set NEW NOTE alert |
Company Profile |
SEC
News |
Chart |
Request a new note
C
A
S
I |
LULU
-
NASDAQ
Lululemon Athletica
MANUFACTURING - Textile Manufacturing
|
$170.20
|
-5.52
-3.14% |
$174.93
|
1,616,419
72.94% of 50 DAV
50 DAV is 2,216,000
|
$179.50
-5.18%
|
3/28/2019
|
$169.20
|
PP = $164.89
|
|
MB = $173.13
|
Most Recent Note - 5/23/2019 4:49:34 PM
Y - Color code is changed to yellow after pulling back below its "max buy" level. Its 50 DMA line ($166.91) defines important near-term support above prior highs in the $164 area.
>>> FEATURED STOCK ARTICLE : Volume Light While Hovering Near High - 5/10/2019 |
View all notes |
Set NEW NOTE alert |
Company Profile |
SEC
News |
Chart |
Request a new note
C
A
S
I |
NXST
-
NASDAQ
Nexstar Media Group Cl A
MEDIA - Broadcasting - TV
|
$103.25
|
-0.68
-0.65% |
$104.10
|
629,079
126.83% of 50 DAV
50 DAV is 496,000
|
$119.93
-13.91%
|
5/1/2019
|
$115.33
|
PP = $120.03
|
|
MB = $126.03
|
Most Recent Note - 5/23/2019 12:37:34 PM
G - Slumping further below its 50 DMA line ($110) and raising greater concerns. A rebound above the 50 DMA line is needed for its outlook to improve. Reported earnings +14% on +2% sales revenues for the Mar '19 quarter, below the +25% minimum earnings guideline (C criteria). See the latest FSU analysis for more details and an annotated graph.
>>> FEATURED STOCK ARTICLE : Technical and Fundamental Concerns Recently Raised - 5/21/2019 |
View all notes |
Set NEW NOTE alert |
Company Profile |
SEC
News |
Chart |
Request a new note
C
A
S
I |
ULTA
-
NASDAQ
Ulta Beauty Inc
SPECIALTY RETAIL - Specialty Retail, Other
|
$337.83
|
-11.26
-3.23% |
$347.14
|
1,025,607
137.85% of 50 DAV
50 DAV is 744,000
|
$359.69
-6.08%
|
3/15/2019
|
$341.27
|
PP = $322.59
|
|
MB = $338.72
|
Most Recent Note - 5/23/2019 4:55:27 PM
G - Slumped below its 50 DMA line ($345) with a volume-driven loss today hurting its outlook. Prior low ($325.62 on 5/14/19) defines important near-term support. It may be forming a new base and there is little resistance remaining up to the $359 level.
>>> FEATURED STOCK ARTICLE : Volume Totals Cooling in Recent Weeks While Hovering Near High - 4/26/2019 |
View all notes |
Set NEW NOTE alert |
Company Profile |
SEC
News |
Chart |
Request a new note
C
A
S
I |
ESNT
-
NYSE
Essent Group Ltd
Finance-MrtgandRel Svc
|
$47.74
|
-0.32
-0.67% |
$48.02
|
588,219
90.22% of 50 DAV
50 DAV is 652,000
|
$48.88
-2.33%
|
3/18/2019
|
$45.84
|
PP = $45.06
|
|
MB = $47.31
|
Most Recent Note - 5/21/2019 5:53:26 PM
Y - Traded near its 52-week high today but erased its gain and ended near the session low. Recently reported earnings +15% on +20% sales revenues for the Mar '19 quarter, below the +25% minimum earnings guideline (C criteria), raising fundamental concerns. Its 50 DMA line ($45.82 defines near term support to watch. Faces very little resistance due to overhead supply up to the $50 level.
>>> FEATURED STOCK ARTICLE : Perched Above Pivot Point With Earnings News Due May 3rd - 4/25/2019 |
View all notes |
Set NEW NOTE alert |
Company Profile |
SEC
News |
Chart |
Request a new note
C
A
S
I |
Symbol/Exchange
Company Name
Industry Group |
PRICE |
CHANGE
(%Change) |
Day High |
Volume
(% DAV)
(% 50 day avg vol) |
52 Wk Hi
% From Hi |
Featured
Date |
Price
Featured |
Pivot Featured |
|
Max Buy |
FIVE
-
NASDAQ
Five Below Inc
Retail-DiscountandVariety
|
$130.82
|
-1.36
-1.03% |
$132.93
|
801,811
70.09% of 50 DAV
50 DAV is 1,144,000
|
$148.22
-11.74%
|
4/11/2019
|
$132.05
|
PP = $133.75
|
|
MB = $140.44
|
Most Recent Note - 5/21/2019 5:47:24 PM
Y - Color code is changed to yellow after rebounding above its 50 DMA line ($130) with volume-driven gains helping its outlook to improve. Recent low defines important near-term support above its 200 DMA line.
>>> FEATURED STOCK ARTICLE : Finished Strong After Featured Again in Mid-Day Report - 4/11/2019 |
View all notes |
Set NEW NOTE alert |
Company Profile |
SEC
News |
Chart |
Request a new note
C
A
S
I |
NOW
-
NYSE
Servicenow Inc
Computer Sftwr-Enterprse
|
$264.79
|
-8.60
-3.15% |
$270.87
|
1,454,447
79.52% of 50 DAV
50 DAV is 1,829,000
|
$281.74
-6.02%
|
4/22/2019
|
$242.64
|
PP = $251.75
|
|
MB = $264.34
|
Most Recent Note - 5/23/2019 4:51:48 PM
G - Its 50 DMA line ($253.61) and prior high ($251.65 on 3/21/19) define important near-term support to watch while pulling back from its all-time high. Recently reported earnings +20% on +34% sales revenues for the Mar '19 quarter, below the +25% minimum earnings guideline (C criteria), raising concerns, fundamentally.
>>> FEATURED STOCK ARTICLE : Found Recent Support at 50-Day Moving Average - 4/15/2019 |
View all notes |
Set NEW NOTE alert |
Company Profile |
SEC
News |
Chart |
Request a new note
C
A
S
I |
QLYS
-
NASDAQ
Qualys Inc
Computer Sftwr-Security
|
$90.17
|
+0.02
0.02% |
$90.65
|
725,922
229.00% of 50 DAV
50 DAV is 317,000
|
$98.30
-8.27%
|
5/23/2019
|
$90.43
|
PP = $98.40
|
|
MB = $103.32
|
Most Recent Note - 5/23/2019 12:45:09 PM
Y - Color code is change to yellow while subsequent volume-driven gains above the pivot point are needed to trigger a technical buy signal. Its Relative Strength Rating has improved to 88, above the 80+ minimum guideline for buy candidates. Found support near its 50 DMA line ($85.28) after encountering distributional pressure in recent weeks and dropped from the Featured Stocks list on 5/13/19. Met stubborn resistance in the $97-98 area. Reported earnings +36% on +16% sales revenues for the Mar '19 quarter, continuing its strong earnings history.
>>> FEATURED STOCK ARTICLE : Rallying to Challenge Previously Stubborn Resistance - 5/2/2019 |
View all notes |
Set NEW NOTE alert |
Company Profile |
SEC
News |
Chart |
Request a new note
C
A
S
I |
SPLK
-
NASDAQ
Splunk Inc
Computer Sftwr-Database
|
$128.73
|
-7.39
-5.43% |
$134.16
|
3,281,999
244.56% of 50 DAV
50 DAV is 1,342,000
|
$143.70
-10.42%
|
5/22/2019
|
$136.52
|
PP = $143.80
|
|
MB = $150.99
|
Most Recent Note - 5/23/2019 12:47:52 PM
G - Due to report earnings news after the close today. Volume and volatility often increase near earnings news. Color code is changed to green after slumping below its 50 DMA line with today's big loss. Finished with a loss on higher volume after highlighted in yellow with new pivot point cited based on its 3/01/19 high plus 10 cents in the prior mid-day report. Subsequent volume-driven gains above the pivot point are needed to trigger a technical buy signal. See the latest FSU analysis for more details and an annotated graph.
>>> FEATURED STOCK ARTICLE : Perched Near Prior High With Earnings News Due - 5/22/2019 |
View all notes |
Set NEW NOTE alert |
Company Profile |
SEC
News |
Chart |
Request a new note
C
A
S
I |
PAYC
-
NYSE
Paycom Software Inc
COMPUTER SOFTWARE and SERVICES - Application Software
|
$206.77
|
-6.30
-2.96% |
$210.21
|
615,776
95.17% of 50 DAV
50 DAV is 647,000
|
$215.65
-4.12%
|
2/6/2019
|
$171.66
|
PP = $164.18
|
|
MB = $172.39
|
Most Recent Note - 5/23/2019 12:58:05 PM
G - Pulling back after getting extended from any sound base. Its 50 DMA line ($194) defines important near-term support to watch. Reported earnings +25% on +30% sales revenues for the Mar '19 quarter.
>>> FEATURED STOCK ARTICLE : Paycom Software Quietly Hovering Near All-Time High - 4/16/2019 |
View all notes |
Set NEW NOTE alert |
Company Profile |
SEC
News |
Chart |
Request a new note
C
A
S
I |
Symbol/Exchange
Company Name
Industry Group |
PRICE |
CHANGE
(%Change) |
Day High |
Volume
(% DAV)
(% 50 day avg vol) |
52 Wk Hi
% From Hi |
Featured
Date |
Price
Featured |
Pivot Featured |
|
Max Buy |
PYPL
-
NASDAQ
Paypal Holdings Inc
Finance-CrdtCard/PmtPr
|
$109.90
|
-2.57
-2.29% |
$111.71
|
7,169,455
115.15% of 50 DAV
50 DAV is 6,226,000
|
$114.66
-4.15%
|
1/24/2019
|
$92.56
|
PP = $93.80
|
|
MB = $98.49
|
Most Recent Note - 5/23/2019 4:57:30 PM
G - Pulling back from its all-time high after getting very extended from any sound base. Well above its 50 DMA line ($107.37) and prior low which define near-term support to watch. Recently reported earnings +37% on +12% sales revenues for the Mar '19 quarter, continuing its strong earnings track record.
>>> FEATURED STOCK ARTICLE : Hovering Near All Time High Extended From Any Sound Base - 5/15/2019 |
View all notes |
Set NEW NOTE alert |
Company Profile |
SEC
News |
Chart |
Request a new note
C
A
S
I |
PLNT
-
NYSE
Planet Fitness Inc Cl A
Leisure-Services
|
$74.41
|
-1.74
-2.28% |
$75.50
|
1,138,900
80.09% of 50 DAV
50 DAV is 1,422,000
|
$81.76
-8.99%
|
11/7/2018
|
$57.10
|
PP = $55.45
|
|
MB = $58.22
|
Most Recent Note - 5/23/2019 5:59:05 PM
G - Pulled back today for a 5th consecutive loss after getting very extended from any sound base. Its 50 DMA line ($72.80) and prior low define near-term support. Reported earnings +30% on +23% sales revenues for its first quarter ended March 31, 2019. See the latest FSU analysis for more details and a new annotated graph.
>>> FEATURED STOCK ARTICLE : Pulling Back From High After Impressive Rally - 5/23/2019 |
View all notes |
Set NEW NOTE alert |
Company Profile |
SEC
News |
Chart |
Request a new note
C
A
S
I |
BLD
-
NYSE
Topbuild Corp
Bldg-Constr Prds/Misc
|
$78.34
|
-2.88
-3.55% |
$81.30
|
361,766
116.32% of 50 DAV
50 DAV is 311,000
|
$87.21
-10.17%
|
5/17/2019
|
$82.19
|
PP = $87.31
|
|
MB = $91.68
|
Most Recent Note - 5/23/2019 4:40:59 PM
Y - Encountered distributional pressure after highlighted in the 5/17/19 mid-day report. Subsequent gains above the pivot point backed by at least +40% above average volume may trigger a technical buy signal. Reported earnings +45% on +26% sales revenues for the Mar '19 quarter. Quarterly earnings increases have been above the +25% minimum guideline (C criteria). Annual earnings (A criteria) history has been strong and steady since turning profitable in FY '14.
>>> FEATURED STOCK ARTICLE : Encountered Distributional Pressure Near Prior High - 5/20/2019 |
View all notes |
Set NEW NOTE alert |
Company Profile |
SEC
News |
Chart |
Request a new note
C
A
S
I |
TEAM
-
NASDAQ
Atlassian Corp Plc Cl A
Comp Sftwr-Spec Enterprs
|
$127.26
|
+1.01
0.80% |
$127.84
|
1,823,806
99.34% of 50 DAV
50 DAV is 1,836,000
|
$131.99
-3.58%
|
4/16/2019
|
$114.77
|
PP = $116.80
|
|
MB = $122.64
|
Most Recent Note - 5/20/2019 1:27:49 PM
G - Color code is changed to green while perched near its all-time high and above its "max buy" level. Reported earnings +133% on +38% sales revenues for the Mar '19 quarter, continuing its strong earnings track record.
>>> FEATURED STOCK ARTICLE : Perched Near High Enduring Distributional Pressure - 4/9/2019 |
View all notes |
Set NEW NOTE alert |
Company Profile |
SEC
News |
Chart |
Request a new note
C
A
S
I |
GLOB
-
NYSE
Globant SA
Computer-Tech Services
|
$88.46
|
-0.88
-0.99% |
$88.85
|
368,340
158.77% of 50 DAV
50 DAV is 232,000
|
$89.71
-1.39%
|
2/15/2019
|
$69.35
|
PP = $70.00
|
|
MB = $73.50
|
Most Recent Note - 5/21/2019 5:45:21 PM
G - Posted another gain with above average volume today for a new all-time high, getting more extended from any sound base. Its 50 DMA line ($77.85) defines important support above the prior high ($74). Violations would raise concerns and trigger technical sell signals. Reported earnings +32% on +22% sales revenues for the quarter ended March 31st, 2019 versus the year ago period, continuing its strong earning track record.
>>> FEATURED STOCK ARTICLE : Earnings News Due While Perched Near All-Time High - 5/7/2019 |
View all notes |
Set NEW NOTE alert |
Company Profile |
SEC
News |
Chart |
Request a new note
C
A
S
I |
Symbol/Exchange
Company Name
Industry Group |
PRICE |
CHANGE
(%Change) |
Day High |
Volume
(% DAV)
(% 50 day avg vol) |
52 Wk Hi
% From Hi |
Featured
Date |
Price
Featured |
Pivot Featured |
|
Max Buy |
|
|
|
THESE ARE NOT BUY RECOMMENDATIONS!
Comments contained in the body of this report are technical
opinions only. The material herein has been obtained
from sources believed to be reliable and accurate, however,
its accuracy and completeness cannot be guaranteed.
This site is not an investment advisor, hence it does
not endorse or recommend any securities or other investments.
Any recommendation contained in this report may not
be suitable for all investors and it is not to be deemed
an offer or solicitation on our part with respect to
the purchase or sale of any securities. All trademarks,
service marks and trade names appearing in this report
are the property of their respective owners, and are
likewise used for identification purposes only.
This report is a service available
only to active Paid Premium Members.
You may opt-out of receiving report notifications
at any time. Questions or comments may be submitted
by writing to Premium Membership Services 665 S.E. 10 Street, Suite 201 Deerfield Beach, FL 33441-5634 or by calling 1-800-965-8307
or 954-785-1121.
|
|
|

