You are not logged in.
This means you
CAN ONLY VIEW reports that were published prior to Tuesday, April 15, 2025.
You
MUST UPGRADE YOUR MEMBERSHIP if you want to see any current reports.
AFTER MARKET UPDATE - WEDNESDAY, MAY 18TH, 2011
Previous After Market Report Next After Market Report >>>
|
|
|
|
DOW |
+80.60 |
12,560.18 |
+0.65% |
|
Volume |
883,835,860 |
-9% |
|
Volume |
1,822,003,550 |
-16% |
|
NASDAQ |
+31.79 |
2,815.00 |
+1.14% |
|
Advancers |
2,316 |
74% |
|
Advancers |
1,911 |
71% |
|
S&P 500 |
+11.70 |
1,340.68 |
+0.88% |
|
Decliners |
712 |
23% |
|
Decliners |
686 |
25% |
|
Russell 2000 |
+13.09 |
833.45 |
+1.60% |
|
52 Wk Highs |
122 |
|
|
52 Wk Highs |
52 |
|
|
S&P 600 |
+6.16 |
445.86 |
+1.40% |
|
52 Wk Lows |
22 |
|
|
52 Wk Lows |
53 |
|
|
 |
Major Averages Rise On Lighter Volume
Kenneth J. Gruneisen - Passed the CAN SLIM® Master's Exam
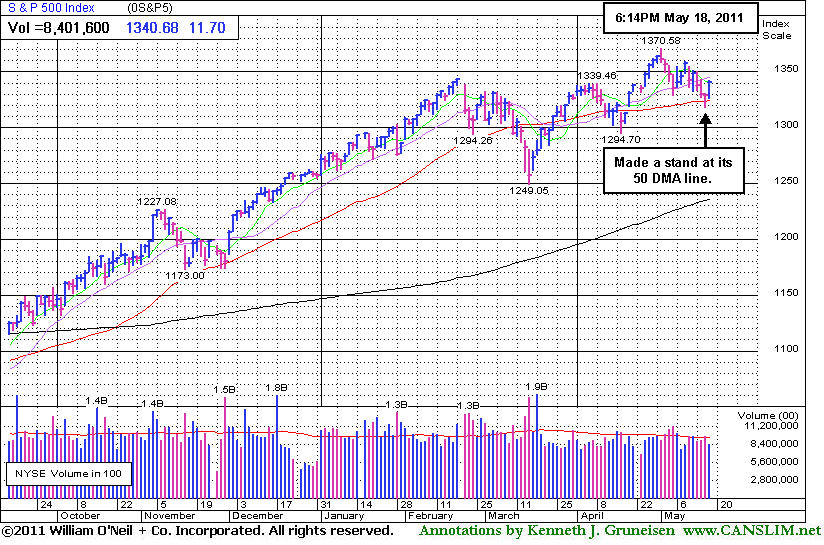
The tone of the stock market quickly improved after a slow start on Wednesday, and the market added to its advance after the minutes of the April FOMC meeting suggested the central bank may not raise interest rates this year. Advancing issues beat decliners by about 3-1 on both the NYSE and the Nasdaq. Volume totals were reported lighter than the prior session totals on the NYSE and on the Nasdaq exchange, revealing a lack of great buying conviction coming from the institutional crowd. New 52-week highs easily outnumbered new 52-week lows on the NYSE, but 52-week lows were evenly matched with new highs on the Nasdaq exchange. There were 32 high-ranked companies from the CANSLIM.net Leaders List that made new 52-week highs and appeared on the CANSLIM.net BreakOuts Page, up from the total of 18 on the prior session. On the Featured Stocks Page there were 13 gainers out of the 15 high-ranked leaders currently included.
Oil prices rose back above $100 per barrel after dropping to a three-month low yesterday. The Energy Department released its survey of U.S. oil and gasoline stockpiles and inventories unexpectedly declined last week. Chevron Corp (CVX +2.4%) was a standout among the Dow Industrials while energy and mining stocks were among the top performers. Raw materials from copper to crude rallied on the outlook for increased demand from emerging markets.
Analog Devices Inc (ADI +5.9%), Dell Inc (DELL +5.35%) and Target Corp (TGT +1.61%) reported earnings that were better than expected. Meanwhile, Staples Inc (SPLS -15.37%) slumped after lowering its earnings forecast. Aflac Inc (AFL -6.3%) also lowered their profit forecasts. Allstate Corp (ALL +0.09%) agreed to buy Esurance from White Mountains Insurance Group (WTM +15%) for almost $1 billion.
PICTURED: The benchmark S&P 500 Index made a stand at its 50-day moving average (DMA) line.
|
 Kenneth J. Gruneisen started out as a licensed stockbroker in August 1987, a couple of months prior to the historic stock market crash that took the Dow Jones Industrial Average down -22.6% in a single day. He has published daily fact-based fundamental and technical analysis on high-ranked stocks online for two decades. Through FACTBASEDINVESTING.COM, Kenneth provides educational articles, news, market commentary, and other information regarding proven investment systems that work in good times and bad.
Comments contained in the body of this report are technical opinions only and are not necessarily those of Gruneisen Growth Corp. The material herein has been obtained from sources believed to be reliable and accurate, however, its accuracy and completeness cannot be guaranteed. Our firm, employees, and customers may effect transactions, including transactions contrary to any recommendation herein, or have positions in the securities mentioned herein or options with respect thereto. Any recommendation contained in this report may not be suitable for all investors and it is not to be deemed an offer or solicitation on our part with respect to the purchase or sale of any securities. |
|
 |
Tech and Commodity-Linked Groups Led Widespread Gains
Kenneth J. Gruneisen - Passed the CAN SLIM® Master's Exam
The Broker/Dealer Index ($XBD +1.52%) and Bank Index ($BKX +0.32%) posted gains on Wednesday, providing a positive influence on the major averages along with the Retail Index ($RLX +0.48%). The tech sector had a positive bias as the Internet Index ($IIX +1.25%), Networking Index ($NWX +1.46%), Semiconductor Index ($SOX +1.89%), and Biotechnology Index ($BTK +1.24%) finished unanimously higher. The Healthcare Index ($HMO +2.34%) and commodity-linked groups posted solid gains as the Gold & Silver Index ($XAU +1.14%), Oil Services Index ($OSX +2.63%), and Integrated Oil Index ($XOI +1.34%) rallied.
Charts courtesy www.stockcharts.com
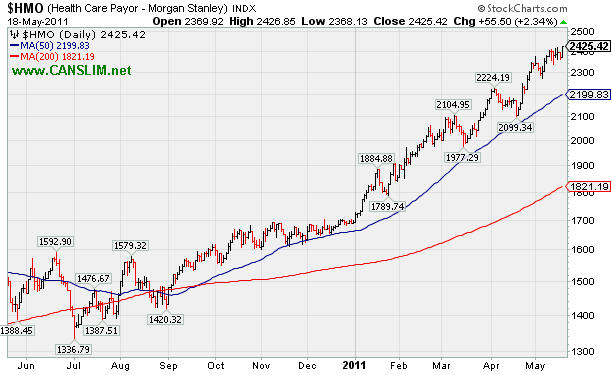
PICTURED: The Healthcare Index ($HMO +2.34%) has been the standout gainer among the industry groups regularly followed in the Industry Group Watch section.
| Oil Services |
$OSX |
265.52 |
+6.80 |
+2.63% |
+8.32% |
| Healthcare |
$HMO |
2,425.42 |
+55.50 |
+2.34% |
+43.35% |
| Integrated Oil |
$XOI |
1,289.11 |
+17.02 |
+1.34% |
+6.26% |
| Semiconductor |
$SOX |
437.59 |
+8.11 |
+1.89% |
+6.26% |
| Networking |
$NWX |
322.31 |
+4.63 |
+1.46% |
+14.88% |
| Internet |
$IIX |
318.80 |
+3.93 |
+1.25% |
+3.60% |
| Broker/Dealer |
$XBD |
116.38 |
+1.74 |
+1.52% |
-4.23% |
| Retail |
$RLX |
539.53 |
+2.57 |
+0.48% |
+6.13% |
| Gold & Silver |
$XAU |
198.63 |
+2.24 |
+1.14% |
-12.34% |
| Bank |
$BKX |
50.55 |
+0.16 |
+0.32% |
-3.18% |
| Biotech |
$BTK |
1,487.62 |
+18.27 |
+1.24% |
+14.64% |
|
|
|
 |
Consolidating Above 50-Day Average and Upward Trendline
Kenneth J. Gruneisen - Passed the CAN SLIM® Master's Exam
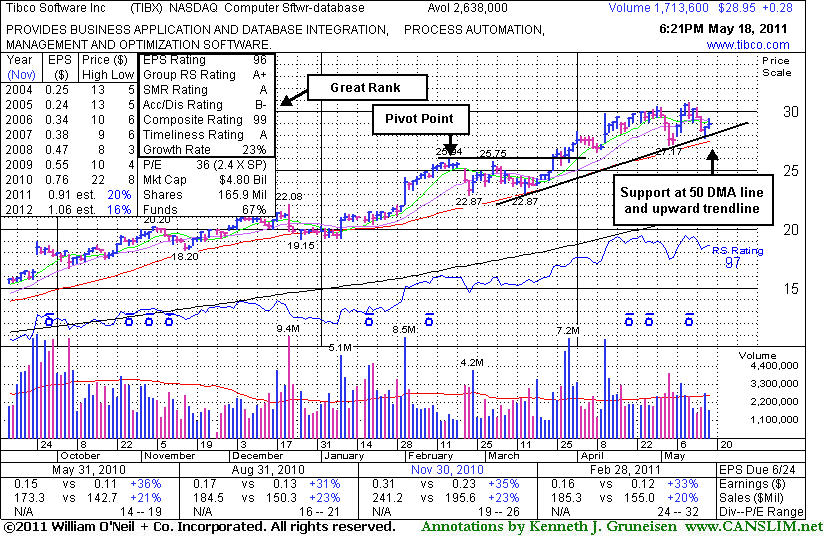
Tibco Software Inc (TIBX +$0.28 or +0.77% to $28.95) volume totals have been cooling while recently consolidating above its 50-day moving average (DMA) line and upward trendline. It is extended from a sound base pattern. Technically, its short-term average and recent low ($27.17) mark important chart support levels to watch where violations may trigger sell signals. Following its last appearance in the FSU section on 4/14/11 with an annotated graph under the headline, "Volume-Driven Gains Lift Software Firm From New Base", it made steady progress and stayed above its 50 DMA line on pullbacks. It found support well above prior highs in the $25-26 area during the recent consolidation, and never seriously threatened to negate its latest breakout.
This high-ranked Computer Software - Database firm based in Palo Alto, CA has maintained a steady annual earnings (A criteria) history and earnings increases have been impressive in the 5 most recent quarterly comparisons, above the +25% guideline (C criteria). The number of top-rated funds owning its shares rose from 591 in Mar '10 to to 710 in Mar '11, a reassuring sign concerning the I criteria. It has traded as much as session +28.2% from $23.98 when it was included in the February 2011 issue of CANSLIM.net News (read here).
|
|
|
Color Codes Explained :
Y - Better candidates highlighted by our
staff of experts.
G - Previously featured
in past reports as yellow but may no longer be buyable under the
guidelines.
***Last / Change / Volume data in this table is the closing quote data***
Symbol/Exchange
Company Name
Industry Group |
PRICE |
CHANGE
(%Change) |
Day High |
Volume
(% DAV)
(% 50 day avg vol) |
52 Wk Hi
% From Hi |
Featured
Date |
Price
Featured |
Pivot Featured |
|
Max Buy |
CMG
-
NYSE
Chipotle Mexican Grill
LEISURE - Restaurants
|
$278.75
|
+4.24
1.54% |
$280.03
|
513,769
45.22% of 50 DAV
50 DAV is 1,136,100
|
$289.35
-3.66%
|
4/1/2011
|
$274.00
|
PP = $275.10
|
|
MB = $288.86
|
Most Recent Note - 5/17/2011 6:03:08 PM
G - Perched only -5.1% off its 52-week high with no resistance due to overhead supply, but it has not formed a sound base after negating latest breakout. See latest FSU analysis for details and a new annotated graph.
>>> The latest Featured Stock Update with an annotated graph appeared on 5/17/2011. Click here.
View all notes |
Alert me of new notes |
CANSLIM.net Company Profile |
SEC |
Zacks Reports |
StockTalk |
News |
Chart |
Request a new note
C
A N
S L
I M


|
CTSH
-
NASDAQ
Cognizant Tech Sol Cl A
COMPUTER SOFTWARE and SERVICES - Business Software and Services
|
$73.37
|
-0.35
-0.47% |
$73.80
|
3,394,323
135.95% of 50 DAV
50 DAV is 2,496,700
|
$83.48
-12.11%
|
2/7/2011
|
$75.09
|
PP = $76.46
|
|
MB = $80.28
|
Most Recent Note - 5/16/2011 3:15:32 PM
G - Considerable loss today with near average volume, slumping toward prior lows in the $70.50 range and its 200 DMA line. Overhead supply up through the $83 level may also hinder upward progress for the near term.
>>> The latest Featured Stock Update with an annotated graph appeared on 5/16/2011. Click here.
View all notes |
Alert me of new notes |
CANSLIM.net Company Profile |
SEC |
Zacks Reports |
StockTalk |
News |
Chart |
Request a new note
C
A N
S L
I M
|
EZPW
-
NASDAQ
Ezcorp Inc Cl A
SPECIALTY RETAIL - Specialty Retail, Other
|
$30.38
|
+0.57
1.91% |
$30.43
|
177,682
49.99% of 50 DAV
50 DAV is 355,400
|
$33.08
-8.16%
|
2/18/2011
|
$27.94
|
PP = $30.04
|
|
MB = $31.54
|
 Most Recent Note - 5/18/2011 5:25:09 PM
G - Quiet gain today continued its consolidation above its 50 DMA line. Volume totals have been cooling in recent weeks. Recent lows define important nearby chart support to watch where technical violations would raise more serious concerns. It has not formed a sound new base pattern.
>>> The latest Featured Stock Update with an annotated graph appeared on 5/10/2011. Click here.
View all notes |
Alert me of new notes |
CANSLIM.net Company Profile |
SEC |
Zacks Reports |
StockTalk |
News |
Chart |
Request a new note
C
A N
S L
I M
|
FOSL
-
NASDAQ
Fossil Inc
CONSUMER DURABLES - Recreational Goods, Other
|
$102.13
|
-0.09
-0.09% |
$103.57
|
754,603
86.95% of 50 DAV
50 DAV is 867,900
|
$107.54
-5.03%
|
2/1/2011
|
$73.30
|
PP = $74.44
|
|
MB = $78.16
|
Most Recent Note - 5/13/2011 10:55:51 AM
G - Stubbornly holding its ground in a tight range with volume totals cooling since its considerable gap up gain on 5/10/11 for a new all-time high. It is extended from a sound base. Prior highs near $96 define initial support to watch above its 50 DMA line.
>>> The latest Featured Stock Update with an annotated graph appeared on 5/2/2011. Click here.
View all notes |
Alert me of new notes |
CANSLIM.net Company Profile |
SEC |
Zacks Reports |
StockTalk |
News |
Chart |
Request a new note
C
A N
S L
I M
|
HMSY
-
NASDAQ
H M S Holdings Corp
COMPUTER SOFTWARE and SERVICES - Healthcare Information Service
|
$77.57
|
+1.37
1.80% |
$78.27
|
158,577
95.30% of 50 DAV
50 DAV is 166,400
|
$84.82
-8.55%
|
11/19/2010
|
$61.89
|
PP = $63.01
|
|
MB = $66.16
|
Most Recent Note - 5/18/2011 5:29:06 PM
G - Gain today on near average volume, rallying toward its 50 DMA line which may now act as resistance. A rally above it would improve its technical stance. Deterioration below its recent chart low ($73.27) would raise more serious concerns and trigger an additional sell signal.
>>> The latest Featured Stock Update with an annotated graph appeared on 4/26/2011. Click here.
View all notes |
Alert me of new notes |
CANSLIM.net Company Profile |
SEC |
Zacks Reports |
StockTalk |
News |
Chart |
Request a new note
C
A N
S L
I M
|
Symbol/Exchange
Company Name
Industry Group |
PRICE |
CHANGE
(%Change) |
Day High |
Volume
(% DAV)
(% 50 day avg vol) |
52 Wk Hi
% From Hi |
Featured
Date |
Price
Featured |
Pivot Featured |
|
Max Buy |
HS
-
NYSE
Healthspring Inc
HEALTH SERVICES - Health Care Plans
|
$44.24
|
+0.89
2.05% |
$44.35
|
594,538
62.26% of 50 DAV
50 DAV is 955,000
|
$44.87
-1.40%
|
3/22/2011
|
$38.29
|
PP = $38.85
|
|
MB = $40.79
|
Most Recent Note - 5/18/2011 4:56:15 PM
G - Finished at a new high close with a gain on light volume today. It is extended from any sound base pattern. Prior highs define important chart support to watch along with its 50 DMA line in the $39-40 area. Violations would trigger technical sell signals.
>>> The latest Featured Stock Update with an annotated graph appeared on 4/21/2011. Click here.
View all notes |
Alert me of new notes |
CANSLIM.net Company Profile |
SEC |
Zacks Reports |
StockTalk |
News |
Chart |
Request a new note
C
A N
S L
I M
|
INFA
-
NASDAQ
Informatica Corp
COMPUTER SOFTWARE and SERVICES - Business Software and Services
|
$54.88
|
+2.02
3.82% |
$55.22
|
1,272,869
117.58% of 50 DAV
50 DAV is 1,082,600
|
$56.49
-2.85%
|
3/24/2011
|
$50.04
|
PP = $49.86
|
|
MB = $52.35
|
Most Recent Note - 5/18/2011 4:24:09 PM
G - Considerable gain today with above average volume. It has not formed a sound new base pattern. Prior highs in the $49 area and its 50 DMA line, important chart support to watch. Subsequent violations would trigger technical sell signals.
>>> The latest Featured Stock Update with an annotated graph appeared on 4/27/2011. Click here.
View all notes |
Alert me of new notes |
CANSLIM.net Company Profile |
SEC |
Zacks Reports |
StockTalk |
News |
Chart |
Request a new note
C
A N
S L
I M
|
LULU
-
NASDAQ
Lululemon Athletica
MANUFACTURING - Textile Manufacturing
|
$98.15
|
+3.30
3.48% |
$98.25
|
1,178,147
55.68% of 50 DAV
50 DAV is 2,115,800
|
$102.83
-4.55%
|
5/18/2011
|
$98.15
|
PP = $102.93
|
|
MB = $108.08
|
Most Recent Note - 5/18/2011 4:47:05 PM
Y - Volume totals have been cooling and lighter than average in recent weeks while this high-ranked Retail-Apparel firm has been consolidating near its all-time highs. Color code is changed to yellow with new pivot point cited based on a "square box" base pattern formed since its 4/21/11 high. Its 50 DMA line defines support above prior highs in the $85 area, important levels to watch on pullbacks.
>>> The latest Featured Stock Update with an annotated graph appeared on 5/3/2011. Click here.
View all notes |
Alert me of new notes |
CANSLIM.net Company Profile |
SEC |
Zacks Reports |
StockTalk |
News |
Chart |
Request a new note
C
A N
S L
I M
|
MG
-
NYSE
Mistras Group Inc
DIVERSIFIED SERVICES - Bulding and Faci;ity Management Services
|
$16.68
|
+0.24
1.46% |
$16.85
|
35,839
19.75% of 50 DAV
50 DAV is 181,500
|
$18.46
-9.64%
|
3/15/2011
|
$15.48
|
PP = $15.90
|
|
MB = $16.70
|
Most Recent Note - 5/13/2011 4:48:51 PM
G - It has not formed a sound base pattern and today it slumped to a close below its 50 DMA line. Completed a new Public Offering on 5/05/11 and it is consolidating -8.9% off its 52-week high. See the latest FSU analysis for more details and a new annotated graph.
>>> The latest Featured Stock Update with an annotated graph appeared on 5/12/2011. Click here.
View all notes |
Alert me of new notes |
CANSLIM.net Company Profile |
SEC |
Zacks Reports |
StockTalk |
News |
Chart |
Request a new note
C
A N
S L
I M
|
MWIV
-
NASDAQ
M W I Veterinary Supply
HEALTH SERVICES - Medical Instruments and; Supplies
|
$82.85
|
+0.26
0.31% |
$83.59
|
99,095
101.53% of 50 DAV
50 DAV is 97,600
|
$86.99
-4.76%
|
11/4/2010
|
$61.79
|
PP = $59.60
|
|
MB = $62.58
|
Most Recent Note - 5/13/2011 10:49:03 AM
G - Hovering near its all-time high with volume totals cooling since 5/05/11 while stubbornly holding its ground. It has not formed a sound base pattern. Its 50 DMA line defines important support to watch.
>>> The latest Featured Stock Update with an annotated graph appeared on 5/5/2011. Click here.
View all notes |
Alert me of new notes |
CANSLIM.net Company Profile |
SEC |
Zacks Reports |
StockTalk |
News |
Chart |
Request a new note
C
A N
S L
I M
|
Symbol/Exchange
Company Name
Industry Group |
PRICE |
CHANGE
(%Change) |
Day High |
Volume
(% DAV)
(% 50 day avg vol) |
52 Wk Hi
% From Hi |
Featured
Date |
Price
Featured |
Pivot Featured |
|
Max Buy |
OPNT
-
NASDAQ
Opnet Technologies
INTERNET - Internet Software and Services
|
$38.69
|
+1.00
2.65% |
$38.89
|
67,626
51.35% of 50 DAV
50 DAV is 131,700
|
$42.51
-8.99%
|
5/11/2011
|
$41.21
|
PP = $40.50
|
|
MB = $42.53
|
Most Recent Note - 5/18/2011 5:10:48 PM
G - Gain today on light volume helped it make a stand at its 50 DMA line. Concerns were raised after it slumped more than -7% below its pivot point and undercut its prior high close ($39.44 on 4/01/11). Its color code was changed to green after it completely negated its latest breakout.
>>> The latest Featured Stock Update with an annotated graph appeared on 5/11/2011. Click here.
View all notes |
Alert me of new notes |
CANSLIM.net Company Profile |
SEC |
Zacks Reports |
StockTalk |
News |
Chart |
Request a new note
C
A N
S L
I M
|
PCLN
-
NASDAQ
Priceline.Com Inc
INTERNET - Internet Software and Services
|
$518.38
|
+13.98
2.77% |
$521.01
|
1,290,713
114.88% of 50 DAV
50 DAV is 1,123,500
|
$561.88
-7.74%
|
1/3/2011
|
$399.55
|
PP = $428.20
|
|
MB = $449.61
|
Most Recent Note - 5/18/2011 4:50:35 PM
G - Technically, it found support at its 50 DMA line this week and posted 2 consecutive gains with slightly above average volume. That short-term average has been a reliable support level this year. It is now -7.7% off its 52-week high.
>>> The latest Featured Stock Update with an annotated graph appeared on 4/20/2011. Click here.
View all notes |
Alert me of new notes |
CANSLIM.net Company Profile |
SEC |
Zacks Reports |
StockTalk |
News |
Chart |
Request a new note
C
A N
S L
I M
|
RAX
-
NYSE
Rackspace Hosting Inc
INTERNET - Internet Software and; Services
|
$42.33
|
+1.21
2.94% |
$42.41
|
1,825,612
103.90% of 50 DAV
50 DAV is 1,757,100
|
$46.50
-8.96%
|
3/16/2011
|
$36.28
|
PP = $40.72
|
|
MB = $42.76
|
Most Recent Note - 5/18/2011 4:52:25 PM
G - Gains this week helped it make a stand near its 50 DMA line. It has not formed a sound new base. Deterioration below its short-term average and recent chart low ($38.84) would trigger a more worrisome technical sell signals.
>>> The latest Featured Stock Update with an annotated graph appeared on 5/13/2011. Click here.
View all notes |
Alert me of new notes |
CANSLIM.net Company Profile |
SEC |
Zacks Reports |
StockTalk |
News |
Chart |
Request a new note
C
A N
S L
I M
|
TIBX
-
NASDAQ
Tibco Software Inc
COMPUTER SOFTWARE and SERVICES - Business Software and Services
|
$28.95
|
+0.28
0.98% |
$29.41
|
1,745,122
66.15% of 50 DAV
50 DAV is 2,638,000
|
$30.75
-5.85%
|
3/18/2011
|
$23.88
|
PP = $26.04
|
|
MB = $27.34
|
Most Recent Note - 5/18/2011 6:43:06 PM
G - Volume totals have been cooling while consolidating above its 50 DMA line, extended from a sound base pattern. Technically, that short-term average and recent low ($27.17) mark important chart support levels to watch where violations may trigger sell signals. See the latest FSU analysis for details and a new annotated graph.
>>> The latest Featured Stock Update with an annotated graph appeared on 5/18/2011. Click here.
View all notes |
Alert me of new notes |
CANSLIM.net Company Profile |
SEC |
Zacks Reports |
StockTalk |
News |
Chart |
Request a new note
C
A N
S L
I M
|
ULTA
-
NASDAQ
Ulta Salon Cosm & Frag
SPECIALTY RETAIL - Specialty Retail, Other
|
$53.77
|
+1.54
2.95% |
$53.95
|
431,915
72.41% of 50 DAV
50 DAV is 596,500
|
$56.87
-5.45%
|
1/6/2011
|
$36.12
|
PP = $37.34
|
|
MB = $39.21
|
Most Recent Note - 5/18/2011 4:53:57 PM
G - Posted a small gain on light volume today. It is extended from any sound base pattern, and its 50 DMA line (now $50.22) defines chart support to watch where a violation may trigger a technical sell signal.
>>> The latest Featured Stock Update with an annotated graph appeared on 4/28/2011. Click here.
View all notes |
Alert me of new notes |
CANSLIM.net Company Profile |
SEC |
Zacks Reports |
StockTalk |
News |
Chart |
Request a new note
C
A N
S L
I M
|
Symbol/Exchange
Company Name
Industry Group |
PRICE |
CHANGE
(%Change) |
Day High |
Volume
(% DAV)
(% 50 day avg vol) |
52 Wk Hi
% From Hi |
Featured
Date |
Price
Featured |
Pivot Featured |
|
Max Buy |
|
|
|
THESE ARE NOT BUY RECOMMENDATIONS!
Comments contained in the body of this report are technical
opinions only. The material herein has been obtained
from sources believed to be reliable and accurate, however,
its accuracy and completeness cannot be guaranteed.
This site is not an investment advisor, hence it does
not endorse or recommend any securities or other investments.
Any recommendation contained in this report may not
be suitable for all investors and it is not to be deemed
an offer or solicitation on our part with respect to
the purchase or sale of any securities. All trademarks,
service marks and trade names appearing in this report
are the property of their respective owners, and are
likewise used for identification purposes only.
This report is a service available
only to active Paid Premium Members.
You may opt-out of receiving report notifications
at any time. Questions or comments may be submitted
by writing to Premium Membership Services 665 S.E. 10 Street, Suite 201 Deerfield Beach, FL 33441-5634 or by calling 1-800-965-8307
or 954-785-1121.
|
|
|

