You are not logged in.
This means you
CAN ONLY VIEW reports that were published prior to Tuesday, April 15, 2025.
You
MUST UPGRADE YOUR MEMBERSHIP if you want to see any current reports.
AFTER MARKET UPDATE - TUESDAY, MAY 17TH, 2011
Previous After Market Report Next After Market Report >>>
|
|
|
|
DOW |
-68.79 |
12,479.58 |
-0.55% |
|
Volume |
971,450,000 |
+7% |
|
Volume |
2,165,818,750 |
+8% |
|
NASDAQ |
+0.90 |
2,783.21 |
+0.03% |
|
Advancers |
1,240 |
40% |
|
Advancers |
1,075 |
39% |
|
S&P 500 |
-0.49 |
1,328.98 |
-0.04% |
|
Decliners |
1,751 |
56% |
|
Decliners |
1,539 |
56% |
|
Russell 2000 |
-2.55 |
820.36 |
-0.31% |
|
52 Wk Highs |
80 |
|
|
52 Wk Highs |
32 |
|
|
S&P 600 |
-1.41 |
439.70 |
-0.32% |
|
52 Wk Lows |
47 |
|
|
52 Wk Lows |
94 |
|
|
 |
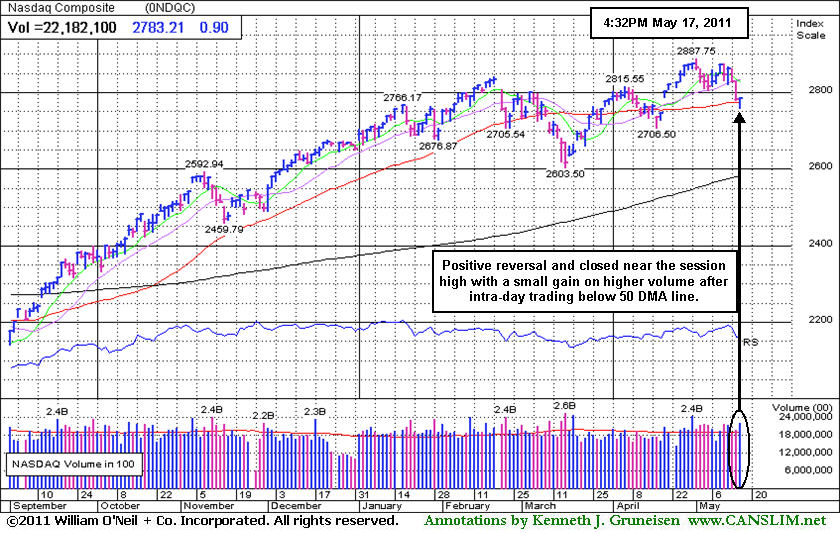
Nasdaq Manages Positive Reversal
Kenneth J. Gruneisen - Passed the CAN SLIM® Master's Exam
The major U.S. indexes enjoyed an afternoon comeback, but the Dow Industrials and the benchmark S&P 500 Index were unable to erase their early deficits. Declining issues beat advancers by 4-3 on the NYSE and by 3-2 on the Nasdaq exchange. New 52-week highs outnumbered new 52-week lows on the NYSE, but again new 52-week lows outnumbered new highs on the Nasdaq exchange. Volume totals were reported slightly higher than the prior session totals on the NYSE and on the Nasdaq exchange. There were 18 high-ranked companies from the CANSLIM.net Leaders List that made new 52-week highs and appeared on the CANSLIM.net BreakOuts Page, down from the total of 26 on the prior session. On the Featured Stocks Page there were 7 gainers out of the 15 high-ranked leaders currently included.
 h h
A disappointing outlook from Hewlett-Packard Company (HPQ -7.26%) and more weak economic data kept stocks underwater for most of the day. Hewlett-Packard fell after it cut a billion dollars from its annual sales forecast. Caterpillar Inc (CAT -3.78%) was down after a report that U.S. industrial production stalled in April. Hewlett-Packard and Caterpillar were together responsible for most of the Dow's decline.
Energy and mining stocks fell as gold and oil prices declined. Oil traded below $96 per barrel on reduced expectations for fuel demand. Financials performed well after JP Morgan Chase (JPM +2.17%) said banks were begining to lend.
April housing starts dropped 11% from March, disappointing analysts who expected an increase. Wal-Mart Stores Inc (WMT -0.93%) sputtered after the retailer's earnings beat forecasts, but sales were a letdown. The Home Depot, Inc (HD +1.14%), another Dow component, edged higher after the company increased its profit outlook. It relied on higher profits overseas in the latest quarter to offset declines in U.S. same-store sales.
PICTURED: The Nasdaq Composite Index overcame early weakness and managed a positive reversal. It avoided a third straight day of losses and closed near the session high with a small gain on higher volume after intra-day trading below its 50-day moving average (DMA) line.
|
 Kenneth J. Gruneisen started out as a licensed stockbroker in August 1987, a couple of months prior to the historic stock market crash that took the Dow Jones Industrial Average down -22.6% in a single day. He has published daily fact-based fundamental and technical analysis on high-ranked stocks online for two decades. Through FACTBASEDINVESTING.COM, Kenneth provides educational articles, news, market commentary, and other information regarding proven investment systems that work in good times and bad.
Comments contained in the body of this report are technical opinions only and are not necessarily those of Gruneisen Growth Corp. The material herein has been obtained from sources believed to be reliable and accurate, however, its accuracy and completeness cannot be guaranteed. Our firm, employees, and customers may effect transactions, including transactions contrary to any recommendation herein, or have positions in the securities mentioned herein or options with respect thereto. Any recommendation contained in this report may not be suitable for all investors and it is not to be deemed an offer or solicitation on our part with respect to the purchase or sale of any securities. |
|
 |
Networking Index Slumping Under 50-Day Average
Kenneth J. Gruneisen - Passed the CAN SLIM® Master's Exam
The Gold & Silver Index ($XAU +0.53%) posted a small gain on Tuesday, and the Bank Index ($BKX +1.65%) finally managed to rally for a meaningful gain while the Broker/Dealer Index ($XBD -0.13%) and Retail Index ($RLX +0.12%) were little changed. Losses from the Semiconductor Index ($SOX -1.20%) to the Healthcare Index ($HMO -1.01%) created a drag on the major averages. The Biotechnology Index ($BTK -0.28%) edged lower and the Internet Index ($IIX +0.37%) edged higher. The Oil Services Index ($OSX -0.51%) suffered a small loss while the Integrated Oil Index ($XOI +0.04%) ended flat.
Charts courtesy www.stockcharts.com
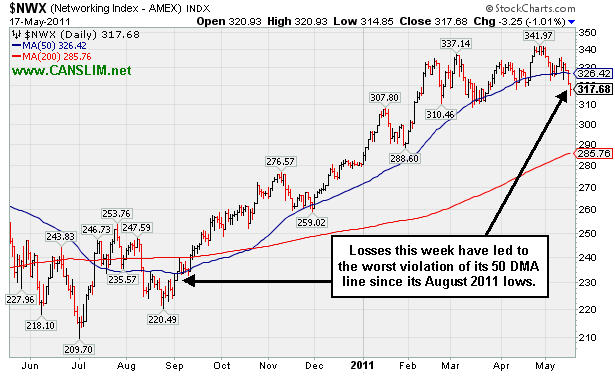
PICTURED: The Networking Index's ($NWX -1.01%) losses this week have led to the worst violation of its 50-day moving average (DMA) line since its August 2011 lows.
| Oil Services |
$OSX |
258.72 |
-1.33 |
-0.51% |
+5.55% |
| Healthcare |
$HMO |
2,369.92 |
-24.17 |
-1.01% |
+40.07% |
| Integrated Oil |
$XOI |
1,272.09 |
+0.53 |
+0.04% |
+4.86% |
| Semiconductor |
$SOX |
429.48 |
-5.21 |
-1.20% |
+4.29% |
| Networking |
$NWX |
317.68 |
-3.25 |
-1.01% |
+13.23% |
| Internet |
$IIX |
314.87 |
+1.16 |
+0.37% |
+2.32% |
| Broker/Dealer |
$XBD |
114.64 |
-0.15 |
-0.13% |
-5.66% |
| Retail |
$RLX |
536.96 |
+0.66 |
+0.12% |
+5.62% |
| Gold & Silver |
$XAU |
196.39 |
+1.03 |
+0.53% |
-13.32% |
| Bank |
$BKX |
50.39 |
+0.82 |
+1.65% |
-3.49% |
| Biotech |
$BTK |
1,469.35 |
-4.16 |
-0.28% |
+13.23% |
|
|
|
 |
Latest Earnings Increase Under Guidelines
Kenneth J. Gruneisen - Passed the CAN SLIM® Master's Exam
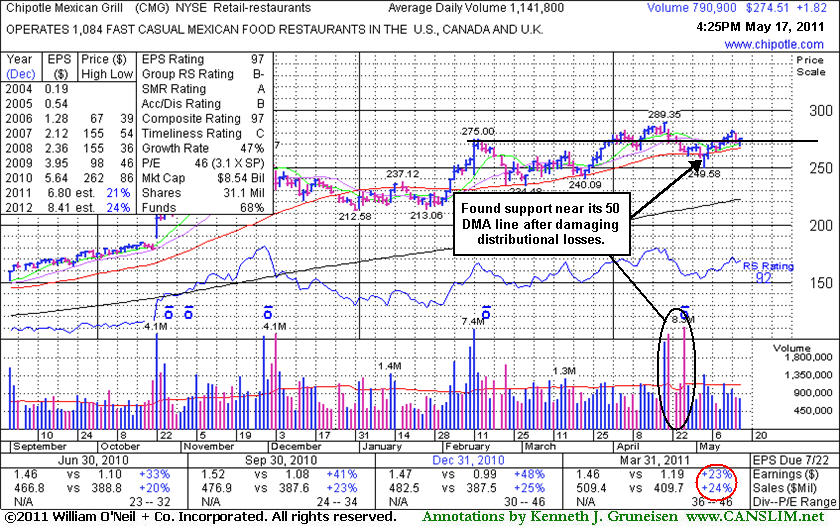
Chipotle Mexican Grill, Inc. (CMG +$1.82 or +2.56% to $274.51) posted a small gain on light volume today, closing -5.1% off its 52-week high. Little resistance remains due to overhead supply, however it has not formed a sound new base pattern. It recently found support near its 50-day moving average (DMA) line after it negated its latest technical breakout.
CMG currently has a B- rating for Accumulation/Distribution. Ownership by top-rated funds rose from 530 in Mar '10 to 689 in Mar '11, a nice reassurance concerning the I criteria of the investment system. Sales revenues increases have been strong, however the quarter ended March 31, 2011 showed earnings +23% (see red circle), just under the +25% guideline for the C criteria, raising some concerns. It has a good annual (A criteria) earnings history.
It was last shown in the FSU section on 4/13/11 with an annotated graph under the headline, "Fresh High Close Lacking Great Volume Conviction". It went on to hit a new all-time high on 4/20/11 with a considerable gain on heavy volume, but then it promptly reversed and soon slumped back under its old highs, technically closing back in its prior base. Subsequent violations of its 50 DMA and recent low ($249.58) would raise greater concerns and trigger more worrisome technical sell signals.
|
|
|
Color Codes Explained :
Y - Better candidates highlighted by our
staff of experts.
G - Previously featured
in past reports as yellow but may no longer be buyable under the
guidelines.
***Last / Change / Volume data in this table is the closing quote data***
Symbol/Exchange
Company Name
Industry Group |
PRICE |
CHANGE
(%Change) |
Day High |
Volume
(% DAV)
(% 50 day avg vol) |
52 Wk Hi
% From Hi |
Featured
Date |
Price
Featured |
Pivot Featured |
|
Max Buy |
CMG
-
NYSE
Chipotle Mexican Grill
LEISURE - Restaurants
|
$274.51
|
+1.82
0.67% |
$275.11
|
790,964
69.27% of 50 DAV
50 DAV is 1,141,800
|
$289.35
-5.13%
|
4/1/2011
|
$274.00
|
PP = $275.10
|
|
MB = $288.86
|
 Most Recent Note - 5/17/2011 6:03:08 PM
G - Perched only -5.1% off its 52-week high with no resistance due to overhead supply, but it has not formed a sound base after negating latest breakout. See latest FSU analysis for details and a new annotated graph.
>>> The latest Featured Stock Update with an annotated graph appeared on 5/17/2011. Click here.
View all notes |
Alert me of new notes |
CANSLIM.net Company Profile |
SEC |
Zacks Reports |
StockTalk |
News |
Chart |
Request a new note
C
A N
S L
I M


|
CTSH
-
NASDAQ
Cognizant Tech Sol Cl A
COMPUTER SOFTWARE and SERVICES - Business Software and Services
|
$73.72
|
-0.03
-0.04% |
$73.90
|
3,323,606
134.15% of 50 DAV
50 DAV is 2,477,500
|
$83.48
-11.69%
|
2/7/2011
|
$75.09
|
PP = $76.46
|
|
MB = $80.28
|
Most Recent Note - 5/16/2011 3:15:32 PM
G - Considerable loss today with near average volume, slumping toward prior lows in the $70.50 range and its 200 DMA line. Overhead supply up through the $83 level may also hinder upward progress for the near term.
>>> The latest Featured Stock Update with an annotated graph appeared on 5/16/2011. Click here.
View all notes |
Alert me of new notes |
CANSLIM.net Company Profile |
SEC |
Zacks Reports |
StockTalk |
News |
Chart |
Request a new note
C
A N
S L
I M
|
EZPW
-
NASDAQ
Ezcorp Inc Cl A
SPECIALTY RETAIL - Specialty Retail, Other
|
$29.81
|
-0.06
-0.20% |
$30.10
|
212,454
59.80% of 50 DAV
50 DAV is 355,300
|
$33.08
-9.89%
|
2/18/2011
|
$27.94
|
PP = $30.04
|
|
MB = $31.54
|
Most Recent Note - 5/13/2011 3:22:33 PM
G - Volume totals have been cooling in recent weeks while consolidating above its 50 DMA line. Recent lows also define important nearby chart support to watch where technical violations would raise more serious concerns. It has not formed a sound new base pattern.
>>> The latest Featured Stock Update with an annotated graph appeared on 5/10/2011. Click here.
View all notes |
Alert me of new notes |
CANSLIM.net Company Profile |
SEC |
Zacks Reports |
StockTalk |
News |
Chart |
Request a new note
C
A N
S L
I M
|
FOSL
-
NASDAQ
Fossil Inc
CONSUMER DURABLES - Recreational Goods, Other
|
$102.22
|
-1.40
-1.35% |
$103.34
|
962,164
108.54% of 50 DAV
50 DAV is 886,500
|
$107.54
-4.95%
|
2/1/2011
|
$73.30
|
PP = $74.44
|
|
MB = $78.16
|
Most Recent Note - 5/13/2011 10:55:51 AM
G - Stubbornly holding its ground in a tight range with volume totals cooling since its considerable gap up gain on 5/10/11 for a new all-time high. It is extended from a sound base. Prior highs near $96 define initial support to watch above its 50 DMA line.
>>> The latest Featured Stock Update with an annotated graph appeared on 5/2/2011. Click here.
View all notes |
Alert me of new notes |
CANSLIM.net Company Profile |
SEC |
Zacks Reports |
StockTalk |
News |
Chart |
Request a new note
C
A N
S L
I M
|
HMSY
-
NASDAQ
H M S Holdings Corp
COMPUTER SOFTWARE and SERVICES - Healthcare Information Service
|
$76.20
|
+0.18
0.24% |
$76.31
|
95,184
55.96% of 50 DAV
50 DAV is 170,100
|
$84.82
-10.16%
|
11/19/2010
|
$61.89
|
PP = $63.01
|
|
MB = $66.16
|
Most Recent Note - 5/13/2011 10:44:26 AM
G - Continuing to linger quietly below its 50 DMA line after damaging distribution in recent weeks. That short-term average may now act as resistance, while a rally above it would improve its technical stance. Deterioration below its recent chart low ($73.27) would raise more serious concerns and trigger an additional sell signal.
>>> The latest Featured Stock Update with an annotated graph appeared on 4/26/2011. Click here.
View all notes |
Alert me of new notes |
CANSLIM.net Company Profile |
SEC |
Zacks Reports |
StockTalk |
News |
Chart |
Request a new note
C
A N
S L
I M
|
Symbol/Exchange
Company Name
Industry Group |
PRICE |
CHANGE
(%Change) |
Day High |
Volume
(% DAV)
(% 50 day avg vol) |
52 Wk Hi
% From Hi |
Featured
Date |
Price
Featured |
Pivot Featured |
|
Max Buy |
HS
-
NYSE
Healthspring Inc
HEALTH SERVICES - Health Care Plans
|
$43.35
|
-0.71
-1.61% |
$44.40
|
589,057
61.87% of 50 DAV
50 DAV is 952,100
|
$44.87
-3.39%
|
3/22/2011
|
$38.29
|
PP = $38.85
|
|
MB = $40.79
|
Most Recent Note - 5/17/2011 4:09:27 PM
G - Holding its ground quietly near its all-time high, extended from any sound base pattern. Prior highs define important chart support to watch along with its 50 DMA line in the $39-40 area. Violations would trigger technical sell signals.
>>> The latest Featured Stock Update with an annotated graph appeared on 4/21/2011. Click here.
View all notes |
Alert me of new notes |
CANSLIM.net Company Profile |
SEC |
Zacks Reports |
StockTalk |
News |
Chart |
Request a new note
C
A N
S L
I M
|
INFA
-
NASDAQ
Informatica Corp
COMPUTER SOFTWARE and SERVICES - Business Software and Services
|
$52.86
|
-0.10
-0.19% |
$53.17
|
822,473
76.16% of 50 DAV
50 DAV is 1,079,900
|
$56.49
-6.43%
|
3/24/2011
|
$50.04
|
PP = $49.86
|
|
MB = $52.35
|
Most Recent Note - 5/16/2011 4:08:22 PM
G - Churning above average volume for a third consecutive session today while consolidating above prior highs in the $49 area and its 50 DMA line, important chart support to watch. Subsequent violations would trigger technical sell signals.
>>> The latest Featured Stock Update with an annotated graph appeared on 4/27/2011. Click here.
View all notes |
Alert me of new notes |
CANSLIM.net Company Profile |
SEC |
Zacks Reports |
StockTalk |
News |
Chart |
Request a new note
C
A N
S L
I M
|
LULU
-
NASDAQ
Lululemon Athletica
MANUFACTURING - Textile Manufacturing
|
$94.85
|
+0.78
0.83% |
$94.99
|
1,437,906
67.66% of 50 DAV
50 DAV is 2,125,300
|
$102.83
-7.76%
|
3/28/2011
|
$68.11
|
PP = $85.38
|
|
MB = $89.65
|
Most Recent Note - 5/13/2011 4:43:57 PM
G - Volume totals have been cooling and lighter than average in recent weeks while this high-ranked Retail-Apparel firm has been consolidating near its all-time highs. Prior highs and its 50 DMA line in the $85 area define important chart support to watch.
>>> The latest Featured Stock Update with an annotated graph appeared on 5/3/2011. Click here.
View all notes |
Alert me of new notes |
CANSLIM.net Company Profile |
SEC |
Zacks Reports |
StockTalk |
News |
Chart |
Request a new note
C
A N
S L
I M
|
MG
-
NYSE
Mistras Group Inc
DIVERSIFIED SERVICES - Bulding and Faci;ity Management Services
|
$16.44
|
-0.06
-0.36% |
$16.49
|
77,392
42.50% of 50 DAV
50 DAV is 182,100
|
$18.46
-10.94%
|
3/15/2011
|
$15.48
|
PP = $15.90
|
|
MB = $16.70
|
Most Recent Note - 5/13/2011 4:48:51 PM
G - It has not formed a sound base pattern and today it slumped to a close below its 50 DMA line. Completed a new Public Offering on 5/05/11 and it is consolidating -8.9% off its 52-week high. See the latest FSU analysis for more details and a new annotated graph.
>>> The latest Featured Stock Update with an annotated graph appeared on 5/12/2011. Click here.
View all notes |
Alert me of new notes |
CANSLIM.net Company Profile |
SEC |
Zacks Reports |
StockTalk |
News |
Chart |
Request a new note
C
A N
S L
I M
|
MWIV
-
NASDAQ
M W I Veterinary Supply
HEALTH SERVICES - Medical Instruments and; Supplies
|
$82.59
|
+0.25
0.30% |
$83.13
|
51,491
51.75% of 50 DAV
50 DAV is 99,500
|
$86.99
-5.06%
|
11/4/2010
|
$61.79
|
PP = $59.60
|
|
MB = $62.58
|
Most Recent Note - 5/13/2011 10:49:03 AM
G - Hovering near its all-time high with volume totals cooling since 5/05/11 while stubbornly holding its ground. It has not formed a sound base pattern. Its 50 DMA line defines important support to watch.
>>> The latest Featured Stock Update with an annotated graph appeared on 5/5/2011. Click here.
View all notes |
Alert me of new notes |
CANSLIM.net Company Profile |
SEC |
Zacks Reports |
StockTalk |
News |
Chart |
Request a new note
C
A N
S L
I M
|
Symbol/Exchange
Company Name
Industry Group |
PRICE |
CHANGE
(%Change) |
Day High |
Volume
(% DAV)
(% 50 day avg vol) |
52 Wk Hi
% From Hi |
Featured
Date |
Price
Featured |
Pivot Featured |
|
Max Buy |
OPNT
-
NASDAQ
Opnet Technologies
INTERNET - Internet Software and Services
|
$37.69
|
-0.72
-1.87% |
$38.40
|
123,013
92.91% of 50 DAV
50 DAV is 132,400
|
$42.51
-11.34%
|
5/11/2011
|
$41.21
|
PP = $40.50
|
|
MB = $42.53
|
Most Recent Note - 5/17/2011 4:05:17 PM
G - Slumped to a close near its 50 DMA line today. Concerns have been raised as it has slumped -7% below its pivot point and further below its prior high close ($39.44 on 4/01/11), and its color code is changed to green. It completely negated its latest breakout.
>>> The latest Featured Stock Update with an annotated graph appeared on 5/11/2011. Click here.
View all notes |
Alert me of new notes |
CANSLIM.net Company Profile |
SEC |
Zacks Reports |
StockTalk |
News |
Chart |
Request a new note
C
A N
S L
I M
|
PCLN
-
NASDAQ
Priceline.Com Inc
INTERNET - Internet Software and Services
|
$504.40
|
+1.02
0.20% |
$505.39
|
1,283,658
113.92% of 50 DAV
50 DAV is 1,126,800
|
$561.88
-10.23%
|
1/3/2011
|
$399.55
|
PP = $428.20
|
|
MB = $449.61
|
Most Recent Note - 5/16/2011 3:20:16 PM
G - Technically, its considerable loss today has it trading -10.4% off its 52-week high and slumping below its 50 DMA line raising concerns. That short-term average has been a reliable support level this year.
>>> The latest Featured Stock Update with an annotated graph appeared on 4/20/2011. Click here.
View all notes |
Alert me of new notes |
CANSLIM.net Company Profile |
SEC |
Zacks Reports |
StockTalk |
News |
Chart |
Request a new note
C
A N
S L
I M
|
RAX
-
NYSE
Rackspace Hosting Inc
INTERNET - Internet Software and; Services
|
$41.12
|
+0.42
1.03% |
$41.47
|
2,494,309
142.38% of 50 DAV
50 DAV is 1,751,900
|
$46.50
-11.56%
|
3/16/2011
|
$36.28
|
PP = $40.72
|
|
MB = $42.76
|
Most Recent Note - 5/16/2011 3:36:38 PM
G - Down today, slumping below its 50 DMA line again, raising concerns. Deterioration below its recent chart low ($38.84) would trigger a more worrisome technical sell signal. It has not formed a sound new base.
>>> The latest Featured Stock Update with an annotated graph appeared on 5/13/2011. Click here.
View all notes |
Alert me of new notes |
CANSLIM.net Company Profile |
SEC |
Zacks Reports |
StockTalk |
News |
Chart |
Request a new note
C
A N
S L
I M
|
TIBX
-
NASDAQ
Tibco Software Inc
COMPUTER SOFTWARE and SERVICES - Business Software and Services
|
$28.67
|
+0.30
1.06% |
$28.77
|
2,771,404
105.65% of 50 DAV
50 DAV is 2,623,100
|
$30.75
-6.76%
|
3/18/2011
|
$23.88
|
PP = $26.04
|
|
MB = $27.34
|
Most Recent Note - 5/16/2011 3:44:14 PM
G - Volume totals have been cooling while consolidating above its 50 DMA line, extended from a sound base pattern. Technically, that short-term average and recent low ($27.17) mark important chart support levels to watch where violations may trigger sell signals.
>>> The latest Featured Stock Update with an annotated graph appeared on 4/14/2011. Click here.
View all notes |
Alert me of new notes |
CANSLIM.net Company Profile |
SEC |
Zacks Reports |
StockTalk |
News |
Chart |
Request a new note
C
A N
S L
I M
|
ULTA
-
NASDAQ
Ulta Salon Cosm & Frag
SPECIALTY RETAIL - Specialty Retail, Other
|
$52.23
|
-1.12
-2.10% |
$53.19
|
661,803
110.78% of 50 DAV
50 DAV is 597,400
|
$56.87
-8.16%
|
1/6/2011
|
$36.12
|
PP = $37.34
|
|
MB = $39.21
|
Most Recent Note - 5/17/2011 4:08:01 PM
G - Pulling back with a loss on heavier volume today, retreating from Friday's all-time high. It is extended from any sound base pattern, and its 50 DMA line (now $49.99) defines chart support to watch where a violation may trigger a technical sell signal.
>>> The latest Featured Stock Update with an annotated graph appeared on 4/28/2011. Click here.
View all notes |
Alert me of new notes |
CANSLIM.net Company Profile |
SEC |
Zacks Reports |
StockTalk |
News |
Chart |
Request a new note
C
A N
S L
I M
|
Symbol/Exchange
Company Name
Industry Group |
PRICE |
CHANGE
(%Change) |
Day High |
Volume
(% DAV)
(% 50 day avg vol) |
52 Wk Hi
% From Hi |
Featured
Date |
Price
Featured |
Pivot Featured |
|
Max Buy |
|
|
|
THESE ARE NOT BUY RECOMMENDATIONS!
Comments contained in the body of this report are technical
opinions only. The material herein has been obtained
from sources believed to be reliable and accurate, however,
its accuracy and completeness cannot be guaranteed.
This site is not an investment advisor, hence it does
not endorse or recommend any securities or other investments.
Any recommendation contained in this report may not
be suitable for all investors and it is not to be deemed
an offer or solicitation on our part with respect to
the purchase or sale of any securities. All trademarks,
service marks and trade names appearing in this report
are the property of their respective owners, and are
likewise used for identification purposes only.
This report is a service available
only to active Paid Premium Members.
You may opt-out of receiving report notifications
at any time. Questions or comments may be submitted
by writing to Premium Membership Services 665 S.E. 10 Street, Suite 201 Deerfield Beach, FL 33441-5634 or by calling 1-800-965-8307
or 954-785-1121.
|
|
|

