You are not logged in.
This means you
CAN ONLY VIEW reports that were published prior to Tuesday, April 15, 2025.
You
MUST UPGRADE YOUR MEMBERSHIP if you want to see any current reports.
AFTER MARKET UPDATE - MONDAY, MAY 12TH, 2014
Previous After Market Report Next After Market Report >>>
|
|
|
|
DOW |
+112.13 |
16,695.47 |
+0.68% |
|
Volume |
625,946,400 |
-2% |
|
Volume |
1,730,800,320 |
-7% |
|
NASDAQ |
+71.99 |
4,143.86 |
+1.77% |
|
Advancers |
2,430 |
77% |
|
Advancers |
2,205 |
79% |
|
S&P 500 |
+18.17 |
1,896.65 |
+0.97% |
|
Decliners |
627 |
20% |
|
Decliners |
544 |
19% |
|
Russell 2000 |
+26.43 |
1,133.65 |
+2.39% |
|
52 Wk Highs |
165 |
|
|
52 Wk Highs |
65 |
|
|
S&P 600 |
+14.39 |
657.08 |
+2.24% |
|
52 Wk Lows |
14 |
|
|
52 Wk Lows |
47 |
|
|
 |
Dow Jones Industrials and S&P 500 Close at New Record Highs
Kenneth J. Gruneisen - Passed the CAN SLIM® Master's Exam
Monday's session kicked off the week on a positive note. Behind the major indices' gains the volume was reported lighter than the prior session totals on the NYSE and on the Nasdaq exchange, revealing a lack of serious institutional buying demand. Breadth was solidly positive as advancers led decliners by nearly a 4-1 margin on the Nasdaq exchange and more than 4-1 on the NYSE. Leadership expanded as there were 45 high-ranked companies from the CANSLIM.net Leaders List that made new 52-week highs and appeared on the CANSLIM.net BreakOuts Page, up from the total of 18 stocks on the prior session. New 52-week highs outnumbered new 52-week lows on the NYSE and on the Nasdaq exchange. There were gains for all 6 high-ranked companies currently included on the Featured Stocks Page. The Market (M criteria) earned the label of returning to a "confirmed uptrend" as the Dow Jones Industrial Average and S&P 500 Index both tallied gains into new high territory. New buying efforts should be selective and only focused in stocks meeting all key criteria of the fact-based investment system. Keep in mind that any sustained and meaningful market advance requires leadership - a healthy crop of stocks hitting new 52-week highs.
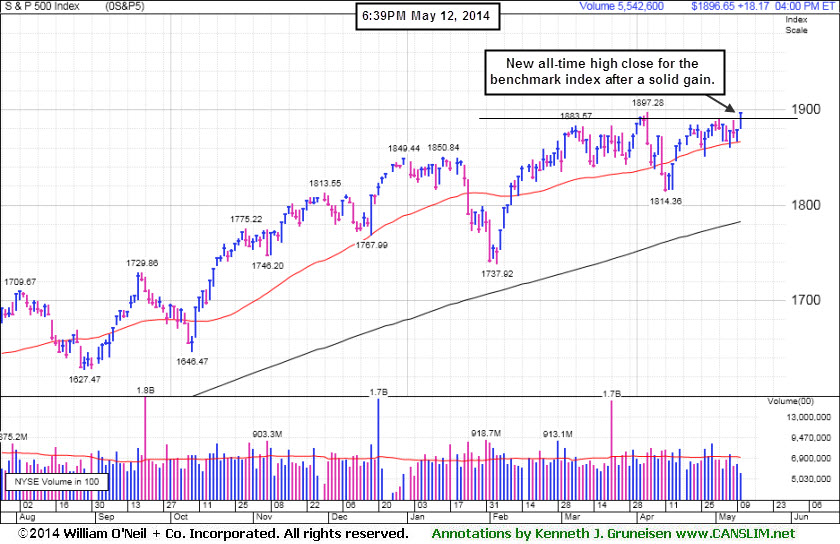 The Dow gained 112 points to a new record close of 16,695. The S&P 500 also rose to a fresh all-time high as it advanced 18 points of 1,896. The NASDAQ increased more than 71 points to 4,143.
Eight of the 10 S&P 500 sectors finished in positive territory. A rebound in technology from last week's retreat paced the advance as Apple (AAPL +1.24%) and Facebook (FB +4.52%) both rose. Materials were also among the best performing stocks as copper jumped to a two-month high, and Freeport-McMoRan (FCX +2.89%) posted a solid gain. The more defensive utilities and telecommunications sectors lagged behind as Exelon (EXC -2.21%) and Verizon (VZ -0.66%) both declined. M&A activity also helped lift the market. Pinnacle Foods (PF +13.2%) rose after Hillshire Brands agreed to buy the company for about $6.6 billion.
On the economic front, the Treasury Department said the government ran a surplus of $106.9 billion in April, keeping the budget on track for the lowest annual deficit in six years.
Treasury prices declined for a second day. The 10-year note lost 7/32 to yield 2.65%. The 30-year bond fell 13/32 to yield 3.49%.
The CANSLIM.net Featured Stocks Page shows the most action-worthy candidates and their latest notes and a Headline Link directs members to the latest detailed analysis with data-packed graphs annotated by a Certified expert along with links to additional resources. The Premium Member Homepage includes "dynamic archives" to all prior pay reports published. Watch for an announcement via email concerning the next WEBCAST.
PICTURED: The benchmark S&P 500 Index finished at a best-ever close with a solid gain on Monday. Recently it found support when consolidating above its 50-day moving average (DMA) line.
|
 Kenneth J. Gruneisen started out as a licensed stockbroker in August 1987, a couple of months prior to the historic stock market crash that took the Dow Jones Industrial Average down -22.6% in a single day. He has published daily fact-based fundamental and technical analysis on high-ranked stocks online for two decades. Through FACTBASEDINVESTING.COM, Kenneth provides educational articles, news, market commentary, and other information regarding proven investment systems that work in good times and bad.
Comments contained in the body of this report are technical opinions only and are not necessarily those of Gruneisen Growth Corp. The material herein has been obtained from sources believed to be reliable and accurate, however, its accuracy and completeness cannot be guaranteed. Our firm, employees, and customers may effect transactions, including transactions contrary to any recommendation herein, or have positions in the securities mentioned herein or options with respect thereto. Any recommendation contained in this report may not be suitable for all investors and it is not to be deemed an offer or solicitation on our part with respect to the purchase or sale of any securities. |
|
 |
Financial, Retail, and Tech Groups Led Broad Rally
Kenneth J. Gruneisen - Passed the CAN SLIM® Master's Exam
Financial shares were a positive influence on the major averages on Monday as the Broker/Dealer Index ($XBD +2.54%) and the Bank Index ($BKX +1.49%) both posted solid gains. Positive action from the Retail Index ($RLX +1.91%) also underpinned the market's rally, and the tech sector saw unanimous gains from the Semiconductor Index ($SOX +1.82%), Biotechnology Index ($BTK +2.55%), and the Networking Index ($NWX +2.83%). The Gold & Silver Index ($XAU +1.40%) also ratcheted higher, meanwhile energy-related shares were mixed, as the Oil Services Index ($OSX -1.17%) fell, and the Integrated Oil Index ($XOI +0.61%) posted a small gain.
Charts courtesy www.stockcharts.com
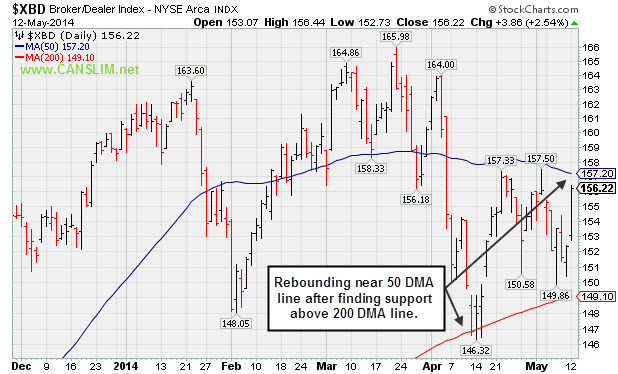
PICTURED: The Broker/Dealer Index ($XBD +2.54%) rebounded near its 50-day moving average (DMA) line. It recently found support near its longer term 200 DMA line.
| Oil Services |
$OSX |
287.25 |
-3.41 |
-1.17% |
+2.21% |
| Integrated Oil |
$XOI |
1,624.50 |
+9.89 |
+0.61% |
+8.07% |
| Semiconductor |
$SOX |
586.48 |
+10.51 |
+1.82% |
+9.62% |
| Networking |
$NWX |
330.37 |
+9.08 |
+2.83% |
+1.98% |
| Broker/Dealer |
$XBD |
156.22 |
+3.86 |
+2.54% |
-2.70% |
| Retail |
$RLX |
863.85 |
+16.23 |
+1.91% |
-8.08% |
| Gold & Silver |
$XAU |
90.63 |
+1.25 |
+1.40% |
+7.70% |
| Bank |
$BKX |
68.98 |
+1.01 |
+1.49% |
-0.40% |
| Biotech |
$BTK |
2,569.03 |
+63.86 |
+2.55% |
+10.24% |
|
|
|
 |
Rose Beyond "Max Buy" Level With 7th Consecutive Gain
Kenneth J. Gruneisen - Passed the CAN SLIM® Master's Exam
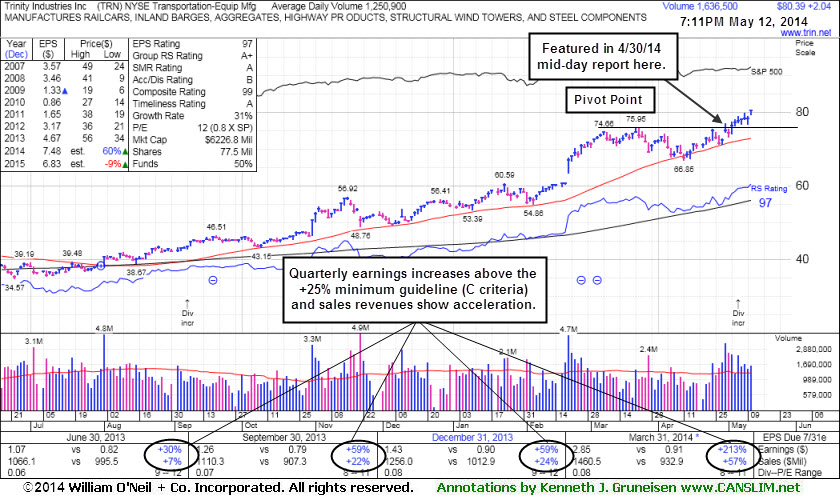
Trinity Industries Inc (TRN +$2.04 or +2.60% to $80.39) gapped up and hit another new 52-week high and its color code was changed to green after today's 7th consecutive gain while rallying above the "max buy" level. On 5/02/14 a strong close above the pivot point clinched a technical buy signal as it tallied a gain backed by +82% above average volume. It rallied further above its pivot point on 5/06/14 with a gain backed by +86% above average volume.
TRN was last shown in this FSU section on 4/30/14 with annotated graphs under the headline, "Finished Near Session Lows After Encountering Distributional Pressure", after highlighted in yellow with pivot point cited based on its 3/21/14 high plus 10 cents in the earlier mid-day report (read here).Prior highs in the $75-76 area define near-term support to watch on pullbacks. Disciplined investors avoid chasing stocks extended more than +5% above prior highs and they always limit losses by selling any stock that falls more than -7% from their purchase price.
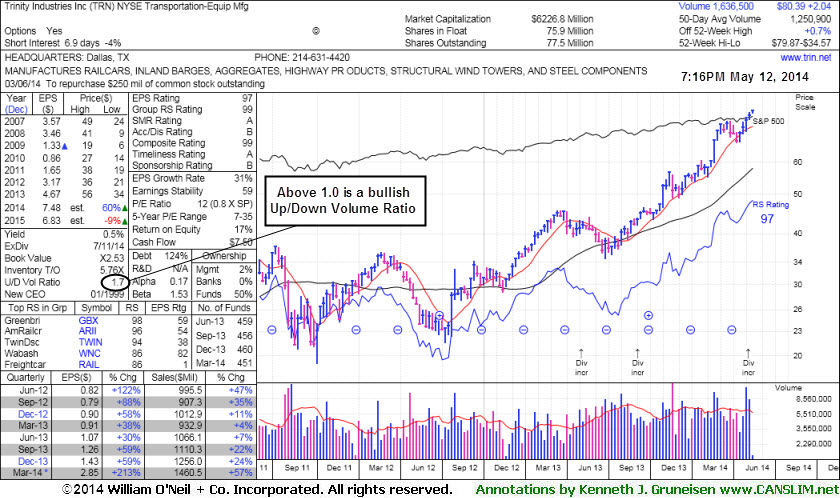
The Transportation - Equipment Manufacturing firm reported earnings +213% on +57% sales revenues for the Mar '14 quarter, and prior quarterly comparisons were above the +25% minimum earnings guideline (C criteria). Annual earnings (A criteria) have improved following a downturn in FY '08-10. It found support at its 50-day moving average (DMA) line recently while making gradual progress. Its current Up/Down Volume Ratio of 1.7 is an unbiased indication that its shares have been under accumulation over the past 50 days.
|
|
|
Color Codes Explained :
Y - Better candidates highlighted by our
staff of experts.
G - Previously featured
in past reports as yellow but may no longer be buyable under the
guidelines.
***Last / Change / Volume data in this table is the closing quote data***
Symbol/Exchange
Company Name
Industry Group |
PRICE |
CHANGE
(%Change) |
Day High |
Volume
(% DAV)
(% 50 day avg vol) |
52 Wk Hi
% From Hi |
Featured
Date |
Price
Featured |
Pivot Featured |
|
Max Buy |
AL
-
NYSE
Air Lease Corp Cl A
DIVERSIFIED SERVICES - Rental and Leasing Services
|
$40.03
|
+1.29
3.33% |
$40.04
|
1,010,373
143.32% of 50 DAV
50 DAV is 705,000
|
$40.36
-0.82%
|
5/9/2014
|
$38.27
|
PP = $38.25
|
|
MB = $40.16
|
 Most Recent Note - 5/12/2014 7:48:51 PM
Y - Gapped up today and rallied near its "max buy" level with its 2nd consecutive volume-driven gain. Prior highs near $38 define near-term support to watch on pullbacks. See the latest FSU analysis for more details and annotated graphs.
>>> FEATURED STOCK ARTICLE : Volume Heavy Following Gap Up Gain for New 52-Week High - 5/9/2014
View all notes |
Set NEW NOTE alert |
CANSLIM.net Company Profile |
SEC
News |
Chart |
Request a new note
C
A N
S L
I M


|
EQM
-
NYSE
E Q T Midstream Partners
ENERGY - Oil and Gas Pipelines
|
$76.70
|
+0.33
0.43% |
$77.25
|
250,661
111.90% of 50 DAV
50 DAV is 224,000
|
$78.67
-2.50%
|
12/12/2013
|
$53.17
|
PP = $56.51
|
|
MB = $59.34
|
Most Recent Note - 5/6/2014 6:21:27 PM
G - Still hovering near its all-time high. Completed a new Public Offering of 10.75 Million common units on 5/01/14. Fundamental concerns remain. Its 50 DMA line ($70.27) defines near-term support where a violation may trigger a technical sell signal.
>>> FEATURED STOCK ARTICLE : Stength Contiunues; Earnings Below +25% Minimum Guideline for a 2nd Quarter - 4/28/2014
View all notes |
Set NEW NOTE alert |
CANSLIM.net Company Profile |
SEC
News |
Chart |
Request a new note
C
A N
S L
I M
|
ICON
-
NASDAQ
Iconix Brand Group Inc
CONSUMER NON-DURABLES - Textile - Apparel Footwear
|
$42.00
|
+0.59
1.42% |
$42.13
|
572,958
98.96% of 50 DAV
50 DAV is 579,000
|
$43.34
-3.09%
|
4/30/2014
|
$42.50
|
PP = $42.57
|
|
MB = $44.70
|
Most Recent Note - 5/7/2014 5:44:42 PM
Y - Halted its slide today after 4 consecutive small losses. Confirming gains with above average volume could trigger a new (or add-on) technical buy signal. See the latest FSU analysis for more details and new annotated graphs.
>>> FEATURED STOCK ARTICLE : Stalled After Hitting a New 52-Week High - 5/7/2014
View all notes |
Set NEW NOTE alert |
CANSLIM.net Company Profile |
SEC
News |
Chart |
Request a new note
C
A N
S L
I M
|
PSIX
-
NASDAQ
Power Solutions Intl Inc
Machinery-Gen Industrial
|
$77.07
|
+3.07
4.15% |
$78.00
|
90,595
117.66% of 50 DAV
50 DAV is 77,000
|
$88.96
-13.37%
|
5/6/2014
|
$86.46
|
PP = $87.50
|
|
MB = $91.88
|
Most Recent Note - 5/12/2014 7:46:05 PM
G - Reported earnings +14% on +27% sales revenues for the Mar '14 quarter, below the +25% minimum earnings guideline (C criteria), raising fundamental concerns. Rebounded near its 50 DMA line with today's gain on near average volume following 3 consecutive losses after a "negative reversal" on the 5/07/14 at its 52-week high. That short-term average may act as resistance. Did not trigger a new (or add-on) technical buy signal since a new pivot point was cited.
>>> FEATURED STOCK ARTICLE : Hitting New 52-Week High and New Pivot Point Cited - 5/6/2014
View all notes |
Set NEW NOTE alert |
CANSLIM.net Company Profile |
SEC
News |
Chart |
Request a new note
C
A N
S L
I M
|
TRN
-
NYSE
Trinity Industries Inc
TRANSPORTATION - Railroads
|
$80.39
|
+2.04
2.60% |
$80.66
|
1,637,138
130.45% of 50 DAV
50 DAV is 1,255,000
|
$79.87
0.65%
|
4/30/2014
|
$75.57
|
PP = $76.05
|
|
MB = $79.85
|
Most Recent Note - 5/12/2014 7:41:26 PM
G - Color code is changed to green after rallying above its "max buy" level with today's 7th consecutive volume-driven gain. Prior highs in the $75-76 area define near-term support to watch on pullbacks. See the latest FSU analysis for more details and new annotated graphs.
>>> FEATURED STOCK ARTICLE : Rose Beyond "Max Buy" Level With 7th Consecutive Gain - 5/12/2014
View all notes |
Set NEW NOTE alert |
CANSLIM.net Company Profile |
SEC
News |
Chart |
Request a new note
C
A N
S L
I M
|
Symbol/Exchange
Company Name
Industry Group |
PRICE |
CHANGE
(%Change) |
Day High |
Volume
(% DAV)
(% 50 day avg vol) |
52 Wk Hi
% From Hi |
Featured
Date |
Price
Featured |
Pivot Featured |
|
Max Buy |
WLK
-
NYSE
Westlake Chemical Corp
CHEMICALS - Specialty Chemicals
|
$75.53
|
+0.78
1.04% |
$75.97
|
603,178
88.57% of 50 DAV
50 DAV is 681,000
|
$77.64
-2.72%
|
4/29/2014
|
$72.79
|
PP = $69.31
|
|
MB = $72.78
|
Most Recent Note - 5/8/2014 6:29:39 PM
G - Pulled back from its 52-week high today after 4 consecutive gains. Prior highs in the $69 area define near-term support to watch. Reported +28% earnings on +19% sales for the Mar '14 quarter.
>>> FEATURED STOCK ARTICLE : Extended From Base Following Volume Driven Gains - 5/8/2014
View all notes |
Set NEW NOTE alert |
CANSLIM.net Company Profile |
SEC
News |
Chart |
Request a new note
C
A N
S L
I M
|
|
|
|
THESE ARE NOT BUY RECOMMENDATIONS!
Comments contained in the body of this report are technical
opinions only. The material herein has been obtained
from sources believed to be reliable and accurate, however,
its accuracy and completeness cannot be guaranteed.
This site is not an investment advisor, hence it does
not endorse or recommend any securities or other investments.
Any recommendation contained in this report may not
be suitable for all investors and it is not to be deemed
an offer or solicitation on our part with respect to
the purchase or sale of any securities. All trademarks,
service marks and trade names appearing in this report
are the property of their respective owners, and are
likewise used for identification purposes only.
This report is a service available
only to active Paid Premium Members.
You may opt-out of receiving report notifications
at any time. Questions or comments may be submitted
by writing to Premium Membership Services 665 S.E. 10 Street, Suite 201 Deerfield Beach, FL 33441-5634 or by calling 1-800-965-8307
or 954-785-1121.
|
|
|

