You are not logged in.
This means you
CAN ONLY VIEW reports that were published prior to Tuesday, April 15, 2025.
You
MUST UPGRADE YOUR MEMBERSHIP if you want to see any current reports.
AFTER MARKET UPDATE - FRIDAY, MAY 9TH, 2014
Previous After Market Report Next After Market Report >>>
|
|
|
|
DOW |
+32.37 |
16,583.34 |
+0.20% |
|
Volume |
638,096,910 |
-6% |
|
Volume |
1,855,454,730 |
-18% |
|
NASDAQ |
+20.37 |
4,071.87 |
+0.50% |
|
Advancers |
1,683 |
53% |
|
Advancers |
1,668 |
61% |
|
S&P 500 |
+2.85 |
1,878.48 |
+0.15% |
|
Decliners |
1,338 |
42% |
|
Decliners |
965 |
35% |
|
Russell 2000 |
+9.79 |
1,107.22 |
+0.89% |
|
52 Wk Highs |
64 |
|
|
52 Wk Highs |
19 |
|
|
S&P 600 |
+5.10 |
642.69 |
+0.80% |
|
52 Wk Lows |
59 |
|
|
52 Wk Lows |
131 |
|
|
 |
Major Averages Rose With Less Volume Conviction
Kenneth J. Gruneisen - Passed the CAN SLIM® Master's Exam
For the week, the Dow was up +0.4% while the S&P 500 declined -0.1% and the NASDAQ fell -1.3%. On Friday's session the major averages ended a choppy trading session in positive territory. The volume was reported lighter than the prior session totals on the NYSE and on the Nasdaq exchange, revealing a lack of institutional buying demand. Breadth was positive as advancers led decliners by a 2-1 margin on the Nasdaq exchange and an 8-7 margin on the NYSE. There were 18 high-ranked companies from the CANSLIM.net Leaders List that made new 52-week highs and appeared on the CANSLIM.net BreakOuts Page, down from the total of 36 stocks on the prior session. New 52-week highs narrowly outnumbered new 52-week lows on the NYSE while new lows outnumbered new highs on the Nasdaq exchange. There were gains for 4 of the 6 high-ranked companies currently included on the Featured Stocks Page. For the Market (M criteria) to earn the label of returning to a "confirmed uptrend" gains from at least one of the major averages into new high territory would be a welcome reassurance. Then, new buying efforts should be selective and only focused in stocks meeting all key criteria of the fact-based investment system. Keep in mind that any sustained and meaningful market advance requires leadership - a healthy crop of stocks hitting new 52-week highs.
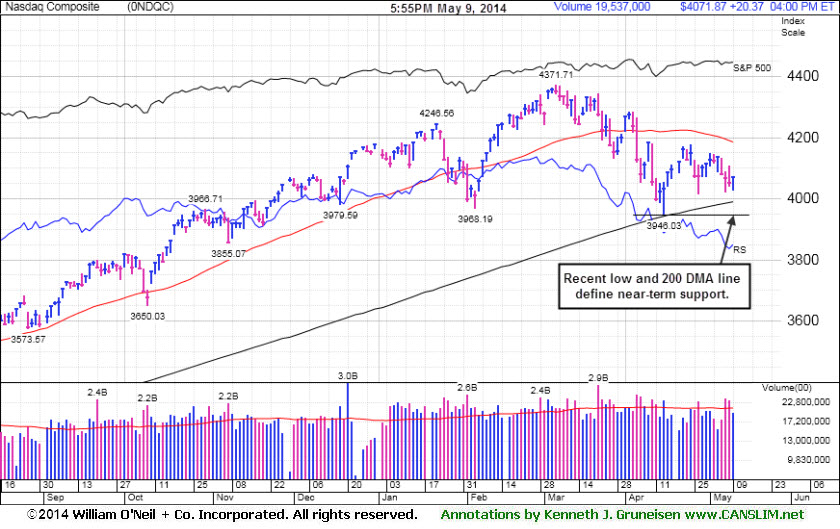 On Friday's session the Dow rose 32 points to an all-time high of 16,583. The S&P 500 gained 3 points to 1,878. The NASDAQ advanced 20 points to 4,071.
Investors weighed corporate profit releases. Shares of Gap (GPS +3.3%) rose following its better-than-expected quarterly results. CBS Corp (CBS -2.2%) fell after reporting a revenue shortfall. Ralph Lauren (RL -2.1%) also fell as its quarterly results included a more cautious outlook.
The economic calendar consisted of report that showed wholesale inventories rose +1.1% in March versus a projected +0.5% increase. In M&A news, Omnicom (OMCM -14.71%) fell after the ad agency and Publicis terminated their merger. Shares of Apple (AAPL -0.4%) edged lower amid reports it was in talks to acquire headphone maker Beats for $3.2 billion.
Consumer discretionary was the best performing sector on the session. News Corp (NWS +5.01%) as quarterly results topped analyst estimates. Utilities were down the most on Friday as Ameren (AEE -2.5%) and Consolidated Edison (ED -2.1%) edged lower.
Treasuries were little changed with the 10-year note off 2/32 to yield 2.62%.
The CANSLIM.net Featured Stocks Page shows the most action-worthy candidates and their latest notes and a Headline Link directs members to the latest detailed analysis with data-packed graphs annotated by a Certified expert along with links to additional resources. The Premium Member Homepage includes "dynamic archives" to all prior pay reports published. Watch for an announcement via email concerning the next WEBCAST.
PICTURED: The Nasdaq Composite Index is consolidating above its 200-day moving average (DMA) line and prior lows defining near term support.
|
 Kenneth J. Gruneisen started out as a licensed stockbroker in August 1987, a couple of months prior to the historic stock market crash that took the Dow Jones Industrial Average down -22.6% in a single day. He has published daily fact-based fundamental and technical analysis on high-ranked stocks online for two decades. Through FACTBASEDINVESTING.COM, Kenneth provides educational articles, news, market commentary, and other information regarding proven investment systems that work in good times and bad.
Comments contained in the body of this report are technical opinions only and are not necessarily those of Gruneisen Growth Corp. The material herein has been obtained from sources believed to be reliable and accurate, however, its accuracy and completeness cannot be guaranteed. Our firm, employees, and customers may effect transactions, including transactions contrary to any recommendation herein, or have positions in the securities mentioned herein or options with respect thereto. Any recommendation contained in this report may not be suitable for all investors and it is not to be deemed an offer or solicitation on our part with respect to the purchase or sale of any securities. |
|
 |
Retail, Biotech, and Broker/Dealer Indexes Rose
Kenneth J. Gruneisen - Passed the CAN SLIM® Master's Exam
The Retail Index ($RLX +1.26%) rose and had a positive influence on the major averages and financial shares edged higher as the Broker/Dealer Index ($XBD +0.48%) edged higher and the Bank Index ($BKX -0.10%) finished with a small loss. Commodity-linked groups edged lower as the Gold & Silver Index ($XAU -0.59%), Oil Services Index ($OSX -0.51%), and the Integrated Oil Index ($XOI -0.29%) edged lower. The Biotechnology Index ($BTK +2.17%) led the tech sector while the Networking Index ($NWX -0.36%) and the Semiconductor Index ($SOX -0.32%) edged lower.
Charts courtesy www.stockcharts.com
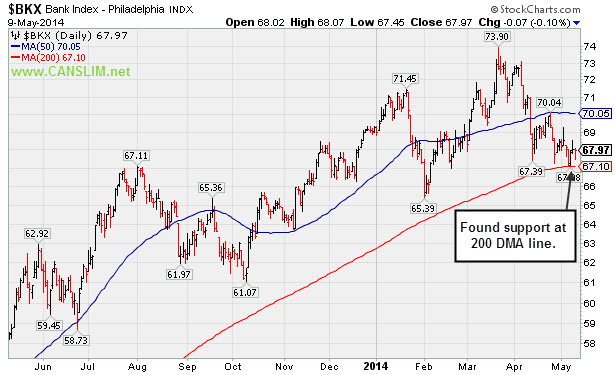
PICTURED: The Bank Index ($BKX -0.10%) is consolidating above support at its 200-day moving average (DMA) line. Further deterioration below that long-term average would not bode well for the broader market outlook.
| Oil Services |
$OSX |
290.66 |
-1.49 |
-0.51% |
+3.43% |
| Integrated Oil |
$XOI |
1,614.61 |
-4.75 |
-0.29% |
+7.42% |
| Semiconductor |
$SOX |
575.97 |
-1.86 |
-0.32% |
+7.65% |
| Networking |
$NWX |
321.29 |
-1.16 |
-0.36% |
-0.82% |
| Broker/Dealer |
$XBD |
152.36 |
+0.73 |
+0.48% |
-5.11% |
| Retail |
$RLX |
847.62 |
+10.54 |
+1.26% |
-9.81% |
| Gold & Silver |
$XAU |
89.38 |
-0.53 |
-0.59% |
+6.22% |
| Bank |
$BKX |
67.97 |
-0.07 |
-0.10% |
-1.86% |
| Biotech |
$BTK |
2,505.17 |
+53.21 |
+2.17% |
+7.50% |
|
|
|
 |
Volume Heavy Following Gap Up Gain for New 52-Week High
Kenneth J. Gruneisen - Passed the CAN SLIM® Master's Exam
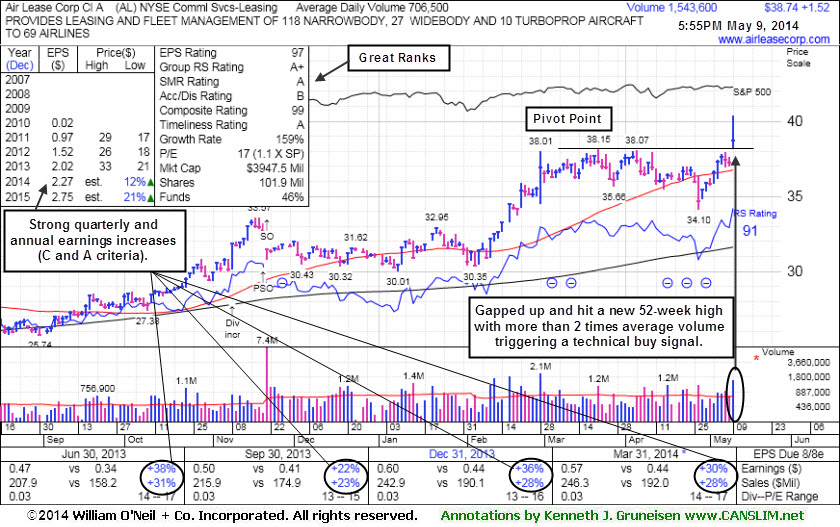
Air Lease Corp (AL +$1.52 or +4.08% to $38.74) was highlighted in yellow with pivot point based on its 3/21/14 high plus 10 cents in the earlier mid-day report (read here). It gapped up and hit a new 52-week high, and its strong finish backed by +119% above average volume clinched a convincing technical buy signal. Disciplined investors always avoid chasing stocks more than +5% above their pivot point and always limit losses by selling if any stock falls more than -7% from their purchase price.
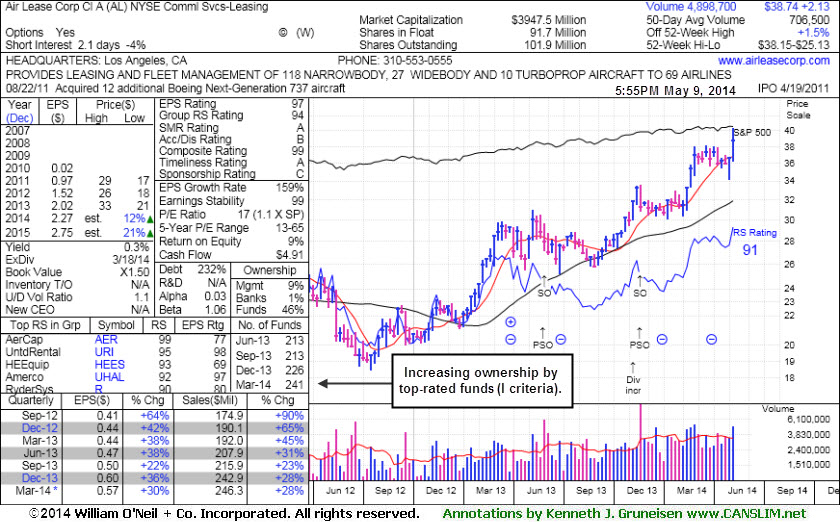
It reported earnings +30% on +28% sales revenues for the Mar '14 quarter, and 3 of the past 4 quarterly comparisons showed earnings increases above the +25% minimum guideline (C criteria). Since dropped from the Featured Stocks list.and noted with caution on 6/21/13 it found support near its 200-day moving average (DMA) line then rallied to new highs. It completed a Secondary Offering on 11/21/13 and an earlier Secondary Offering on 5/31/13. The Commercial Services - Leasing firm has seen the number of top-rated funds owning its shares rise from 177 in Sep '12 to 241 in Mar '14, which is reassuring concerning the I criteria.
Its earnings Per Share Rank is 97, well above the 80+ minimum for buy candidates. Its Relative Strength Rating of 91 is above the 80+ minimum guideline. Those ratings had slumped below the minimum threshold when AL was last shown in this FSU section on 6/17/13 with an annotated graph under the headline, "Faltering Fundamental and Technical Characteristics Raise Concerns".
|
|
|
Color Codes Explained :
Y - Better candidates highlighted by our
staff of experts.
G - Previously featured
in past reports as yellow but may no longer be buyable under the
guidelines.
***Last / Change / Volume data in this table is the closing quote data***
Symbol/Exchange
Company Name
Industry Group |
PRICE |
CHANGE
(%Change) |
Day High |
Volume
(% DAV)
(% 50 day avg vol) |
52 Wk Hi
% From Hi |
Featured
Date |
Price
Featured |
Pivot Featured |
|
Max Buy |
AL
-
NYSE
Air Lease Corp Cl A
DIVERSIFIED SERVICES - Rental and Leasing Services
|
$38.74
|
+1.52
4.08% |
$40.36
|
1,543,670
218.65% of 50 DAV
50 DAV is 706,000
|
$38.15
1.55%
|
5/9/2014
|
$38.27
|
PP = $38.25
|
|
MB = $40.16
|
 Most Recent Note - 5/9/2014 7:04:46 PM
Y - Finished above its pivot point with today's gap up gain backed by +119% above average volume. It was highlighted in yellow with pivot point based on its 3/21/14 high plus 10 cents in the earlier mid-day report (read here). It completed a Secondary Offering on 11/21/13 and an earlier Secondary Offering on 5/31/13. Reported earnings +30% on +28% sales revenues for the Mar '14 quarter, and 3 of the past 4 quarterly comparisons showed earnings increases above the +25% minimum guideline (C criteria). Since dropped from the Featured Stocks list and noted with caution on 6/21/13 it found support near its 200 DMA line then rallied to new highs. See the latest FSU analysis for more details and new annotated graphs.
>>> FEATURED STOCK ARTICLE : Volume Heavy Following Gap Up Gain for New 52-Week High - 5/9/2014
View all notes |
Set NEW NOTE alert |
CANSLIM.net Company Profile |
SEC
News |
Chart |
Request a new note
C
A N
S L
I M


|
EQM
-
NYSE
E Q T Midstream Partners
ENERGY - Oil and Gas Pipelines
|
$76.37
|
+0.31
0.41% |
$76.60
|
190,346
83.85% of 50 DAV
50 DAV is 227,000
|
$78.67
-2.92%
|
12/12/2013
|
$53.17
|
PP = $56.51
|
|
MB = $59.34
|
Most Recent Note - 5/6/2014 6:21:27 PM
G - Still hovering near its all-time high. Completed a new Public Offering of 10.75 Million common units on 5/01/14. Fundamental concerns remain. Its 50 DMA line ($70.27) defines near-term support where a violation may trigger a technical sell signal.
>>> FEATURED STOCK ARTICLE : Stength Contiunues; Earnings Below +25% Minimum Guideline for a 2nd Quarter - 4/28/2014
View all notes |
Set NEW NOTE alert |
CANSLIM.net Company Profile |
SEC
News |
Chart |
Request a new note
C
A N
S L
I M
|
ICON
-
NASDAQ
Iconix Brand Group Inc
CONSUMER NON-DURABLES - Textile - Apparel Footwear
|
$41.41
|
+0.19
0.46% |
$41.85
|
347,266
59.77% of 50 DAV
50 DAV is 581,000
|
$43.34
-4.45%
|
4/30/2014
|
$42.50
|
PP = $42.57
|
|
MB = $44.70
|
Most Recent Note - 5/7/2014 5:44:42 PM
Y - Halted its slide today after 4 consecutive small losses. Confirming gains with above average volume could trigger a new (or add-on) technical buy signal. See the latest FSU analysis for more details and new annotated graphs.
>>> FEATURED STOCK ARTICLE : Stalled After Hitting a New 52-Week High - 5/7/2014
View all notes |
Set NEW NOTE alert |
CANSLIM.net Company Profile |
SEC
News |
Chart |
Request a new note
C
A N
S L
I M
|
PSIX
-
NASDAQ
Power Solutions Intl Inc
Machinery-Gen Industrial
|
$74.00
|
-4.44
-5.66% |
$78.56
|
233,707
299.62% of 50 DAV
50 DAV is 78,000
|
$88.96
-16.82%
|
5/6/2014
|
$86.46
|
PP = $87.50
|
|
MB = $91.88
|
Most Recent Note - 5/9/2014 1:17:53 PM
G - Violated its 50 DMA line today triggering a technical sell signal while on track for a 3rd consecutive loss with ever-increasing volume indicating distributional pressure. There was a "negative reversal" on the 5/07/14 after touching a new 52-week high. Did not trigger a new (or add-on) technical buy signal since a new pivot point was cited on Tuesday.
>>> FEATURED STOCK ARTICLE : Hitting New 52-Week High and New Pivot Point Cited - 5/6/2014
View all notes |
Set NEW NOTE alert |
CANSLIM.net Company Profile |
SEC
News |
Chart |
Request a new note
C
A N
S L
I M
|
TRN
-
NYSE
Trinity Industries Inc
TRANSPORTATION - Railroads
|
$78.35
|
+0.03
0.04% |
$78.84
|
1,469,765
117.86% of 50 DAV
50 DAV is 1,247,000
|
$79.87
-1.90%
|
4/30/2014
|
$75.57
|
PP = $76.05
|
|
MB = $79.85
|
Most Recent Note - 5/6/2014 6:25:19 PM
Y - Hit another new 52-week high with today's gain above its pivot point backed by +86% above average volume while approaching its "max buy" level. Prior highs in the $75-76 area define near-term support to watch on pullbacks.
>>> FEATURED STOCK ARTICLE : Finished Near Session Lows After Encountering Distributional Pressure - 4/30/2014
View all notes |
Set NEW NOTE alert |
CANSLIM.net Company Profile |
SEC
News |
Chart |
Request a new note
C
A N
S L
I M
|
Symbol/Exchange
Company Name
Industry Group |
PRICE |
CHANGE
(%Change) |
Day High |
Volume
(% DAV)
(% 50 day avg vol) |
52 Wk Hi
% From Hi |
Featured
Date |
Price
Featured |
Pivot Featured |
|
Max Buy |
WLK
-
NYSE
Westlake Chemical Corp
CHEMICALS - Specialty Chemicals
|
$74.75
|
-0.89
-1.18% |
$75.78
|
922,174
134.23% of 50 DAV
50 DAV is 687,000
|
$77.64
-3.72%
|
4/29/2014
|
$72.79
|
PP = $69.31
|
|
MB = $72.78
|
Most Recent Note - 5/8/2014 6:29:39 PM
G - Pulled back from its 52-week high today after 4 consecutive gains. Prior highs in the $69 area define near-term support to watch. Reported +28% earnings on +19% sales for the Mar '14 quarter.
>>> FEATURED STOCK ARTICLE : Extended From Base Following Volume Driven Gains - 5/8/2014
View all notes |
Set NEW NOTE alert |
CANSLIM.net Company Profile |
SEC
News |
Chart |
Request a new note
C
A N
S L
I M
|
|
|
|
THESE ARE NOT BUY RECOMMENDATIONS!
Comments contained in the body of this report are technical
opinions only. The material herein has been obtained
from sources believed to be reliable and accurate, however,
its accuracy and completeness cannot be guaranteed.
This site is not an investment advisor, hence it does
not endorse or recommend any securities or other investments.
Any recommendation contained in this report may not
be suitable for all investors and it is not to be deemed
an offer or solicitation on our part with respect to
the purchase or sale of any securities. All trademarks,
service marks and trade names appearing in this report
are the property of their respective owners, and are
likewise used for identification purposes only.
This report is a service available
only to active Paid Premium Members.
You may opt-out of receiving report notifications
at any time. Questions or comments may be submitted
by writing to Premium Membership Services 665 S.E. 10 Street, Suite 201 Deerfield Beach, FL 33441-5634 or by calling 1-800-965-8307
or 954-785-1121.
|
|
|

