You are not logged in.
This means you
CAN ONLY VIEW reports that were published prior to Tuesday, April 15, 2025.
You
MUST UPGRADE YOUR MEMBERSHIP if you want to see any current reports.
AFTER MARKET UPDATE - TUESDAY, MAY 13TH, 2014
Previous After Market Report Next After Market Report >>>
|
|
|
|
DOW |
+19.97 |
16,715.44 |
+0.12% |
|
Volume |
590,897,760 |
-6% |
|
Volume |
1,747,435,770 |
+1% |
|
NASDAQ |
-13.69 |
4,130.17 |
-0.33% |
|
Advancers |
1,361 |
43% |
|
Advancers |
917 |
33% |
|
S&P 500 |
+0.80 |
1,897.45 |
+0.04% |
|
Decliners |
1,698 |
54% |
|
Decliners |
1,796 |
64% |
|
Russell 2000 |
-12.49 |
1,121.16 |
-1.10% |
|
52 Wk Highs |
147 |
|
|
52 Wk Highs |
57 |
|
|
S&P 600 |
-7.88 |
649.20 |
-1.20% |
|
52 Wk Lows |
16 |
|
|
52 Wk Lows |
39 |
|
|
 |
Major Averages Ended Mixed and Little Changed
Kenneth J. Gruneisen - Passed the CAN SLIM® Master's Exam
On Tuesday the major indices finished mixed and little changed. The volume was reported lighter than the prior session total on the NYSE and higher on the Nasdaq exchange. Breadth was negative as decliners led advancers by a 2-1 margin on the Nasdaq exchange and by a narrower 8-7 margin on the NYSE. Leadership expanded as there were 46 high-ranked companies from the CANSLIM.net Leaders List that made new 52-week highs and appeared on the CANSLIM.net BreakOuts Page, up a notch from the total of 45 stocks on the prior session. New 52-week highs outnumbered new 52-week lows on the NYSE and on the Nasdaq exchange. There were gains for 3 of the 6 high-ranked companies currently included on the Featured Stocks Page. The Market (M criteria) earned the label of returning to a "confirmed uptrend" on Monday as the Dow Jones Industrial Average and S&P 500 Index both tallied gains into new high territory. New buying efforts should be selective and only focused in stocks meeting all key criteria of the fact-based investment system. Keep in mind that any sustained and meaningful market advance requires leadership - a healthy crop of stocks hitting new 52-week highs.
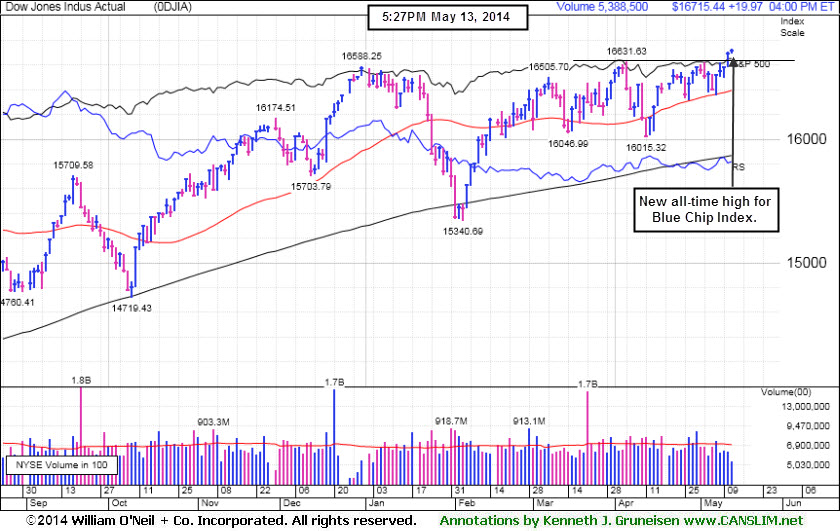
The Dow rose 20 points to close at an all-time high of 16,715. The S&P 500 briefly climbed above 1,900 before ending the session up a point to a record level of 1,897. The NASDAQ declined 14 points to 4,130.
The major averages were mixed as investors weighed a reading on the consumer. Before the open, retail sales rose a less-than-projected 0.1% in April while the March reading was unexpectedly revised higher to 1.5%. Additional releases showed small business sentiment improved last month and import prices fell -0.4%.
On the earnings front, medical supply wholesaler McKesson (MCK +3.31%) gained after quarterly profits beat estimates. Rackspace (RAX +8.54%) rose following its better-than-expected results.
Energy and consumer staples were the best performing sectors. Chevron (CVX +0.49%) inched higher. Keurig Green Mountain (GMCR +7.55%) rose after Coca-Cola (KO +0.71%) said it plans to increase its stake in the company to 16% from 10%. Homebuilders rose with D.R. Horton (DHI +1.99%) up after the FHFA Director announced plans to make it easier for consumers to obtain mortgages. Telecom was down the most on the session. AT&T (T -1.01%) fell on reports the company is in talks to buy DirecTV (DTV -1.24%) for approximately $50 billion.
Treasuries advanced with benchmark 10-year note up 15/32 to yield 2.61%.
The CANSLIM.net Featured Stocks Page shows the most action-worthy candidates and their latest notes and a Headline Link directs members to the latest detailed analysis with data-packed graphs annotated by a Certified expert along with links to additional resources. The Premium Member Homepage includes "dynamic archives" to all prior pay reports published. Watch for an announcement via email concerning the next WEBCAST.
PICTURED: The Dow Jones Industrial Average rose for a best-ever close with a modest gain on Tuesday. Recently it found support when consolidating above its 50-day moving average (DMA) line.
|
 Kenneth J. Gruneisen started out as a licensed stockbroker in August 1987, a couple of months prior to the historic stock market crash that took the Dow Jones Industrial Average down -22.6% in a single day. He has published daily fact-based fundamental and technical analysis on high-ranked stocks online for two decades. Through FACTBASEDINVESTING.COM, Kenneth provides educational articles, news, market commentary, and other information regarding proven investment systems that work in good times and bad.
Comments contained in the body of this report are technical opinions only and are not necessarily those of Gruneisen Growth Corp. The material herein has been obtained from sources believed to be reliable and accurate, however, its accuracy and completeness cannot be guaranteed. Our firm, employees, and customers may effect transactions, including transactions contrary to any recommendation herein, or have positions in the securities mentioned herein or options with respect thereto. Any recommendation contained in this report may not be suitable for all investors and it is not to be deemed an offer or solicitation on our part with respect to the purchase or sale of any securities. |
|
 |
Financial, Retail, and Tech Groups Edged Lower
Kenneth J. Gruneisen - Passed the CAN SLIM® Master's Exam
The Broker/Dealer Index ($XBD -0.89%) and Bank Index ($BKX -0.35%) both lost ground and the Retail Index ($RLX -0.47%) also created a drag on the major averages. The Biotechnology Index ($BTK -1.04%), Semiconductor Index ($SOX -0.78%), and the Networking Index ($NWX -0.36%) fell. Commodity-linked groups were little changed as the Gold & Silver Index ($XAU -0.26%) and the Oil Services Index ($OSX -0.26%) edged lower while the Integrated Oil Index ($XOI +0.25%) edged higher.
Charts courtesy www.stockcharts.com
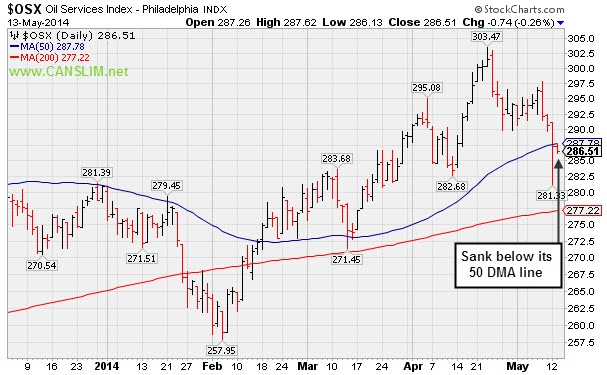
PICTURED: The Oil Services Index ($OSX -0.26%) sank below its 50-day moving average (DMA) line with a small loss on Tuesday.
| Oil Services |
$OSX |
286.51 |
-0.74 |
-0.26% |
+1.95% |
| Integrated Oil |
$XOI |
1,628.53 |
+4.02 |
+0.25% |
+8.34% |
| Semiconductor |
$SOX |
581.88 |
-4.60 |
-0.78% |
+8.76% |
| Networking |
$NWX |
329.17 |
-1.20 |
-0.36% |
+1.62% |
| Broker/Dealer |
$XBD |
154.83 |
-1.39 |
-0.89% |
-3.57% |
| Retail |
$RLX |
859.77 |
-4.08 |
-0.47% |
-8.52% |
| Gold & Silver |
$XAU |
90.39 |
-0.24 |
-0.26% |
+7.42% |
| Bank |
$BKX |
68.74 |
-0.24 |
-0.35% |
-0.75% |
| Biotech |
$BTK |
2,542.23 |
-26.80 |
-1.04% |
+9.09% |
|
|
|
 |
Submit Your Request for a Featured Stock Update
Kenneth J. Gruneisen - Passed the CAN SLIM® Master's Exam
Market conditions (the M criteria) are challenging at times. There are few stocks included on the Featured Stocks list and none of the companies need additional review in detail with annotated graphs. At times like these we have an opportunity to look back and review previously featured stocks which were dropped. This can serve as an educational review of the investment system's tactics. It is also a reminder that high-ranked leaders eventually fall out of favor. If you wish to request for a specific stock to receive more detailed coverage in this section please use the inquiry form to submit your request. Thank you! |
|
|
Color Codes Explained :
Y - Better candidates highlighted by our
staff of experts.
G - Previously featured
in past reports as yellow but may no longer be buyable under the
guidelines.
***Last / Change / Volume data in this table is the closing quote data***
Symbol/Exchange
Company Name
Industry Group |
PRICE |
CHANGE
(%Change) |
Day High |
Volume
(% DAV)
(% 50 day avg vol) |
52 Wk Hi
% From Hi |
Featured
Date |
Price
Featured |
Pivot Featured |
|
Max Buy |
AL
-
NYSE
Air Lease Corp Cl A
DIVERSIFIED SERVICES - Rental and Leasing Services
|
$39.66
|
-0.37
-0.92% |
$40.07
|
1,099,967
151.93% of 50 DAV
50 DAV is 724,000
|
$40.36
-1.73%
|
5/9/2014
|
$38.27
|
PP = $38.25
|
|
MB = $40.16
|
 Most Recent Note - 5/13/2014 5:53:03 PM
Y - Small loss today with above average volume. Rallied near its "max buy" level with volume-driven gains. Prior highs near $38 define near-term support to watch on pullbacks.
>>> FEATURED STOCK ARTICLE : Volume Heavy Following Gap Up Gain for New 52-Week High - 5/9/2014
View all notes |
Set NEW NOTE alert |
CANSLIM.net Company Profile |
SEC
News |
Chart |
Request a new note
C
A N
S L
I M


|
EQM
-
NYSE
E Q T Midstream Partners
ENERGY - Oil and Gas Pipelines
|
$76.88
|
+0.18
0.23% |
$77.00
|
158,115
69.05% of 50 DAV
50 DAV is 229,000
|
$78.67
-2.28%
|
12/12/2013
|
$53.17
|
PP = $56.51
|
|
MB = $59.34
|
Most Recent Note - 5/13/2014 5:44:26 PM
G - Inched higher today for a 5th consecutive small gain on lighter volume, still hovering near its all-time high. Completed a new Public Offering of 10.75 Million common units on 5/01/14. Fundamental concerns remain after 2 consecutive sub par quarters below the +25% minimum earnings guideline. Its 50 DMA line ($71.34) defines near-term support where a violation may trigger a technical sell signal.
>>> FEATURED STOCK ARTICLE : Stength Contiunues; Earnings Below +25% Minimum Guideline for a 2nd Quarter - 4/28/2014
View all notes |
Set NEW NOTE alert |
CANSLIM.net Company Profile |
SEC
News |
Chart |
Request a new note
C
A N
S L
I M
|
ICON
-
NASDAQ
Iconix Brand Group Inc
CONSUMER NON-DURABLES - Textile - Apparel Footwear
|
$42.09
|
+0.09
0.21% |
$42.37
|
647,846
111.31% of 50 DAV
50 DAV is 582,000
|
$43.34
-2.88%
|
4/30/2014
|
$42.50
|
PP = $42.57
|
|
MB = $44.70
|
Most Recent Note - 5/13/2014 5:45:33 PM
Y - Inched higher today for a 3rd consecutive small gain, perched near its 52-week high. Confirming gains with above average volume could trigger a new (or add-on) technical buy signal.
>>> FEATURED STOCK ARTICLE : Stalled After Hitting a New 52-Week High - 5/7/2014
View all notes |
Set NEW NOTE alert |
CANSLIM.net Company Profile |
SEC
News |
Chart |
Request a new note
C
A N
S L
I M
|
PSIX
-
NASDAQ
Power Solutions Intl Inc
Machinery-Gen Industrial
|
$74.16
|
-2.91
-3.78% |
$77.63
|
95,492
116.45% of 50 DAV
50 DAV is 82,000
|
$88.96
-16.64%
|
5/6/2014
|
$86.46
|
PP = $87.50
|
|
MB = $91.88
|
Most Recent Note - 5/13/2014 5:50:27 PM
G - Slumping below its 50 DMA line with today's loss after that short-term average acted as resistance while sputtering following a "negative reversal" on the 5/07/14 at its 52-week high. Reported earnings +14% on +27% sales revenues for the Mar '14 quarter, below the +25% minimum earnings guideline (C criteria), raising fundamental concerns. Did not trigger a new (or add-on) technical buy signal since a new pivot point was cited.
>>> FEATURED STOCK ARTICLE : Hitting New 52-Week High and New Pivot Point Cited - 5/6/2014
View all notes |
Set NEW NOTE alert |
CANSLIM.net Company Profile |
SEC
News |
Chart |
Request a new note
C
A N
S L
I M
|
TRN
-
NYSE
Trinity Industries Inc
TRANSPORTATION - Railroads
|
$81.12
|
+0.73
0.91% |
$82.04
|
1,727,678
138.21% of 50 DAV
50 DAV is 1,250,000
|
$80.66
0.57%
|
4/30/2014
|
$75.57
|
PP = $76.05
|
|
MB = $79.85
|
Most Recent Note - 5/13/2014 5:46:36 PM
G - Rallied further above its "max buy" level with today's 8th consecutive volume-driven gain. Prior highs in the $75-76 area define near-term support to watch on pullbacks.
>>> FEATURED STOCK ARTICLE : Rose Beyond "Max Buy" Level With 7th Consecutive Gain - 5/12/2014
View all notes |
Set NEW NOTE alert |
CANSLIM.net Company Profile |
SEC
News |
Chart |
Request a new note
C
A N
S L
I M
|
Symbol/Exchange
Company Name
Industry Group |
PRICE |
CHANGE
(%Change) |
Day High |
Volume
(% DAV)
(% 50 day avg vol) |
52 Wk Hi
% From Hi |
Featured
Date |
Price
Featured |
Pivot Featured |
|
Max Buy |
WLK
-
NYSE
Westlake Chemical Corp
CHEMICALS - Specialty Chemicals
|
$74.79
|
-0.74
-0.98% |
$75.92
|
477,614
68.82% of 50 DAV
50 DAV is 694,000
|
$77.64
-3.67%
|
4/29/2014
|
$72.79
|
PP = $69.31
|
|
MB = $72.78
|
Most Recent Note - 5/13/2014 5:47:53 PM
G - Quietly consolidating -3.7% off its 52-week high. Prior highs in the $69 area define near-term support to watch. Reported +28% earnings on +19% sales for the Mar '14 quarter.
>>> FEATURED STOCK ARTICLE : Extended From Base Following Volume Driven Gains - 5/8/2014
View all notes |
Set NEW NOTE alert |
CANSLIM.net Company Profile |
SEC
News |
Chart |
Request a new note
C
A N
S L
I M
|
|
|
|
THESE ARE NOT BUY RECOMMENDATIONS!
Comments contained in the body of this report are technical
opinions only. The material herein has been obtained
from sources believed to be reliable and accurate, however,
its accuracy and completeness cannot be guaranteed.
This site is not an investment advisor, hence it does
not endorse or recommend any securities or other investments.
Any recommendation contained in this report may not
be suitable for all investors and it is not to be deemed
an offer or solicitation on our part with respect to
the purchase or sale of any securities. All trademarks,
service marks and trade names appearing in this report
are the property of their respective owners, and are
likewise used for identification purposes only.
This report is a service available
only to active Paid Premium Members.
You may opt-out of receiving report notifications
at any time. Questions or comments may be submitted
by writing to Premium Membership Services 665 S.E. 10 Street, Suite 201 Deerfield Beach, FL 33441-5634 or by calling 1-800-965-8307
or 954-785-1121.
|
|
|

