***Last / Change / Volume data in this table is the closing quote data***
Symbol/Exchange
Company Name
Industry Group |
PRICE |
CHANGE
(%Change) |
Day High |
Volume
(% DAV)
(% 50 day avg vol) |
52 Wk Hi
% From Hi |
Featured
Date |
Price
Featured |
Pivot Featured |
|
Max Buy |
AIXG
-
NASDAQ
Aixtron Se
ELECTRONICS - Semiconductor Equipment andamp; Mate
|
$38.89
|
-1.80
-4.42% |
$40.09
|
288,963
110.12% of 50 DAV
50 DAV is 262,400
|
$44.96
-13.50%
|
4/5/2011
|
$44.14
|
PP = $44.64
|
|
MB = $46.87
|
 Most Recent Note - 5/11/2011 5:32:42 PM
Considerable loss today with near average volume led to its lowest close since January 5th. Its Relative Strength rank has slumped to a mediocre 68, below the 80+ guideline typically required for ideal buy candidates. It faces overhead supply up through the $45 level that may act as resistance. Based on weak action it will be dropped from the Featured Stocks list tonight.
>>> The latest Featured Stock Update with an annotated graph appeared on 5/6/2011. Click here.
View all notes |
Alert me of new notes |
CANSLIM.net Company Profile |
SEC |
Zacks Reports |
StockTalk |
News |
Chart |
Request a new note
C
A N
S L
I M


|
BIDU
-
NASDAQ
Baidu Inc Ads
INTERNET - Internet Information Providers
|
$138.90
|
-3.34
-2.35% |
$142.56
|
6,236,313
81.34% of 50 DAV
50 DAV is 7,666,600
|
$156.04
-10.98%
|
3/17/2011
|
$121.97
|
PP = $131.73
|
|
MB = $138.32
|
Most Recent Note - 5/11/2011 6:09:33 PM
G - Cooling off with quieter volume totals for the past week since halting its slide just above its 50 DMA line. Prior high near $131 defines additional support to watch below its short-term average.
>>> The latest Featured Stock Update with an annotated graph appeared on 5/9/2011. Click here.
View all notes |
Alert me of new notes |
CANSLIM.net Company Profile |
SEC |
Zacks Reports |
StockTalk |
News |
Chart |
Request a new note
C
A N
S L
I M
|
CMG
-
NYSE
Chipotle Mexican Grill
LEISURE - Restaurants
|
$274.30
|
+4.45
1.65% |
$275.90
|
1,163,624
102.40% of 50 DAV
50 DAV is 1,136,400
|
$289.35
-5.20%
|
4/1/2011
|
$274.00
|
PP = $275.10
|
|
MB = $288.86
|
Most Recent Note - 5/9/2011 5:38:22 PM
G - Small loss on light volume today. Recently found support near its 50 DMA line after it negated its latest technical breakout.
>>> The latest Featured Stock Update with an annotated graph appeared on 4/13/2011. Click here.
View all notes |
Alert me of new notes |
CANSLIM.net Company Profile |
SEC |
Zacks Reports |
StockTalk |
News |
Chart |
Request a new note
C
A N
S L
I M
|
CTSH
-
NASDAQ
Cognizant Tech Sol Cl A
COMPUTER SOFTWARE and SERVICES - Business Software and Services
|
$76.75
|
-1.71
-2.18% |
$78.75
|
2,139,021
86.50% of 50 DAV
50 DAV is 2,472,900
|
$83.48
-8.06%
|
2/7/2011
|
$75.09
|
PP = $76.46
|
|
MB = $80.28
|
Most Recent Note - 5/11/2011 6:43:52 PM
G - Its 50 DMA line has acted as resistance since its 5/03/11 gap down triggered a technical sell signal following earnings news. Overhead supply up through the $83 level may also hinder upward progress for the near term.
>>> The latest Featured Stock Update with an annotated graph appeared on 4/15/2011. Click here.
View all notes |
Alert me of new notes |
CANSLIM.net Company Profile |
SEC |
Zacks Reports |
StockTalk |
News |
Chart |
Request a new note
C
A N
S L
I M
|
EZPW
-
NASDAQ
Ezcorp Inc Cl A
SPECIALTY RETAIL - Specialty Retail, Other
|
$30.35
|
-0.70
-2.25% |
$31.06
|
166,713
46.52% of 50 DAV
50 DAV is 358,400
|
$33.08
-8.25%
|
2/18/2011
|
$27.94
|
PP = $30.04
|
|
MB = $31.54
|
Most Recent Note - 5/10/2011 5:01:50 PM
G - Volume totals have been cooling in recent weeks while it has not formed a sound new base pattern. Its 50 DMA line and recent lows define important nearby chart support levels to watch where technical violations would raise more serious concerns.
>>> The latest Featured Stock Update with an annotated graph appeared on 5/10/2011. Click here.
View all notes |
Alert me of new notes |
CANSLIM.net Company Profile |
SEC |
Zacks Reports |
StockTalk |
News |
Chart |
Request a new note
C
A N
S L
I M
|
Symbol/Exchange
Company Name
Industry Group |
PRICE |
CHANGE
(%Change) |
Day High |
Volume
(% DAV)
(% 50 day avg vol) |
52 Wk Hi
% From Hi |
Featured
Date |
Price
Featured |
Pivot Featured |
|
Max Buy |
FOSL
-
NASDAQ
Fossil Inc
CONSUMER DURABLES - Recreational Goods, Other
|
$106.84
|
+0.87
0.82% |
$107.38
|
1,230,499
137.03% of 50 DAV
50 DAV is 898,000
|
$107.27
-0.40%
|
2/1/2011
|
$73.30
|
PP = $74.44
|
|
MB = $78.16
|
Most Recent Note - 5/10/2011 12:20:32 PM
G - Gapped up today for a considerable volume-driven gain and new all-time high after reporting +62% earnings on +37% sales revenues for the quarter ended March 31, 2011 versus the year ago period. As previously noted - "It could produce more climactic gains, but it is extended from any sound base."
>>> The latest Featured Stock Update with an annotated graph appeared on 5/2/2011. Click here.
View all notes |
Alert me of new notes |
CANSLIM.net Company Profile |
SEC |
Zacks Reports |
StockTalk |
News |
Chart |
Request a new note
C
A N
S L
I M
|
HMSY
-
NASDAQ
H M S Holdings Corp
COMPUTER SOFTWARE and SERVICES - Healthcare Information Service
|
$77.53
|
-0.89
-1.13% |
$78.41
|
147,681
84.10% of 50 DAV
50 DAV is 175,600
|
$84.82
-8.59%
|
11/19/2010
|
$61.89
|
PP = $63.01
|
|
MB = $66.16
|
Most Recent Note - 5/9/2011 4:23:10 PM
G - Closed near the high end of its intra-day range today with a solid gain on above average volume. A subsequent rebound above its 50 DMA line (now $79.94) would help its outlook, but that short-term average may now act as resistance.
>>> The latest Featured Stock Update with an annotated graph appeared on 4/26/2011. Click here.
View all notes |
Alert me of new notes |
CANSLIM.net Company Profile |
SEC |
Zacks Reports |
StockTalk |
News |
Chart |
Request a new note
C
A N
S L
I M
|
HS
-
NYSE
Healthspring Inc
HEALTH SERVICES - Health Care Plans
|
$42.90
|
-0.94
-2.14% |
$43.91
|
718,626
79.32% of 50 DAV
50 DAV is 906,000
|
$44.47
-3.53%
|
3/22/2011
|
$38.29
|
PP = $38.85
|
|
MB = $40.79
|
Most Recent Note - 5/11/2011 6:25:00 PM
G - Perched near its 52-week high, stubbornly holding its ground. It is extended from any sound base, and prior highs define important chart support along with its 50 DMA line
>>> The latest Featured Stock Update with an annotated graph appeared on 4/21/2011. Click here.
View all notes |
Alert me of new notes |
CANSLIM.net Company Profile |
SEC |
Zacks Reports |
StockTalk |
News |
Chart |
Request a new note
C
A N
S L
I M
|
INFA
-
NASDAQ
Informatica Corp
COMPUTER SOFTWARE and SERVICES - Business Software and Services
|
$52.69
|
-0.90
-1.68% |
$53.91
|
959,165
92.76% of 50 DAV
50 DAV is 1,034,000
|
$56.49
-6.73%
|
3/24/2011
|
$50.04
|
PP = $49.86
|
|
MB = $52.35
|
Most Recent Note - 5/11/2011 6:30:50 PM
G - Consolidating above prior highs in the $49 area and its 50 DMA line, important chart support to watch. Subsequent violations would trigger technical sell signals.
>>> The latest Featured Stock Update with an annotated graph appeared on 4/27/2011. Click here.
View all notes |
Alert me of new notes |
CANSLIM.net Company Profile |
SEC |
Zacks Reports |
StockTalk |
News |
Chart |
Request a new note
C
A N
S L
I M
|
LULU
-
NASDAQ
Lululemon Athletica
MANUFACTURING - Textile Manufacturing
|
$96.67
|
-2.22
-2.24% |
$99.18
|
1,140,683
51.98% of 50 DAV
50 DAV is 2,194,400
|
$102.83
-5.99%
|
3/28/2011
|
$68.11
|
PP = $85.38
|
|
MB = $89.65
|
Most Recent Note - 5/11/2011 6:36:57 PM
G - Volume totals have been lighter than average in recent weeks while this high-ranked Retail-Apparel firm has been noted as extended from any sound base pattern. Prior highs and its 50 DMA line in the $85 area define important chart support to watch.
>>> The latest Featured Stock Update with an annotated graph appeared on 5/3/2011. Click here.
View all notes |
Alert me of new notes |
CANSLIM.net Company Profile |
SEC |
Zacks Reports |
StockTalk |
News |
Chart |
Request a new note
C
A N
S L
I M
|
Symbol/Exchange
Company Name
Industry Group |
PRICE |
CHANGE
(%Change) |
Day High |
Volume
(% DAV)
(% 50 day avg vol) |
52 Wk Hi
% From Hi |
Featured
Date |
Price
Featured |
Pivot Featured |
|
Max Buy |
MG
-
NYSE
Mistras Group Inc
DIVERSIFIED SERVICES - Bulding and Faci;ity Management Services
|
$17.17
|
-0.36
-2.05% |
$17.53
|
77,222
42.57% of 50 DAV
50 DAV is 181,400
|
$18.46
-6.99%
|
3/15/2011
|
$15.48
|
PP = $15.90
|
|
MB = $16.70
|
Most Recent Note - 5/10/2011 4:52:15 PM
G - Up today with lighter than average volume for its 3rd consecutive gain since completing a new Public Offering. The prompt repair of its 50 DMA violation technically improved its outlook, however it has not formed a sound base pattern.
>>> The latest Featured Stock Update with an annotated graph appeared on 4/12/2011. Click here.
View all notes |
Alert me of new notes |
CANSLIM.net Company Profile |
SEC |
Zacks Reports |
StockTalk |
News |
Chart |
Request a new note
C
A N
S L
I M
|
MWIV
-
NASDAQ
M W I Veterinary Supply
HEALTH SERVICES - Medical Instruments and; Supplies
|
$82.29
|
-0.27
-0.33% |
$82.93
|
57,547
57.09% of 50 DAV
50 DAV is 100,800
|
$86.99
-5.40%
|
11/4/2010
|
$61.79
|
PP = $59.60
|
|
MB = $62.58
|
Most Recent Note - 5/9/2011 4:29:50 PM
G - Holding its ground near its all-time high. Extended from any sound base pattern now, its 50 DMA line defines important support to watch. Reported earnings +34% on +28% sales for the quarter ended March 31st.
>>> The latest Featured Stock Update with an annotated graph appeared on 5/5/2011. Click here.
View all notes |
Alert me of new notes |
CANSLIM.net Company Profile |
SEC |
Zacks Reports |
StockTalk |
News |
Chart |
Request a new note
C
A N
S L
I M
|
OPEN
-
NASDAQ
Opentable Inc
INTERNET - Internet Software and Services
|
$96.49
|
+0.02
0.02% |
$97.83
|
1,330,293
95.99% of 50 DAV
50 DAV is 1,385,800
|
$118.66
-18.68%
|
3/17/2011
|
$90.71
|
PP = $96.07
|
|
MB = $100.87
|
Most Recent Note - 5/10/2011 4:46:07 PM
Up today with above average volume for its third small gain marked by above average volume since a damaging gap down on 5/04/11 violating its 50 DMA line. That important short-term average may now act as resistance. It will be dropped from the Featured Stocks list tonight based on the recent technical damage noted.
>>> The latest Featured Stock Update with an annotated graph appeared on 4/25/2011. Click here.
View all notes |
Alert me of new notes |
CANSLIM.net Company Profile |
SEC |
Zacks Reports |
StockTalk |
News |
Chart |
Request a new note
C
A N
S L
I M
|
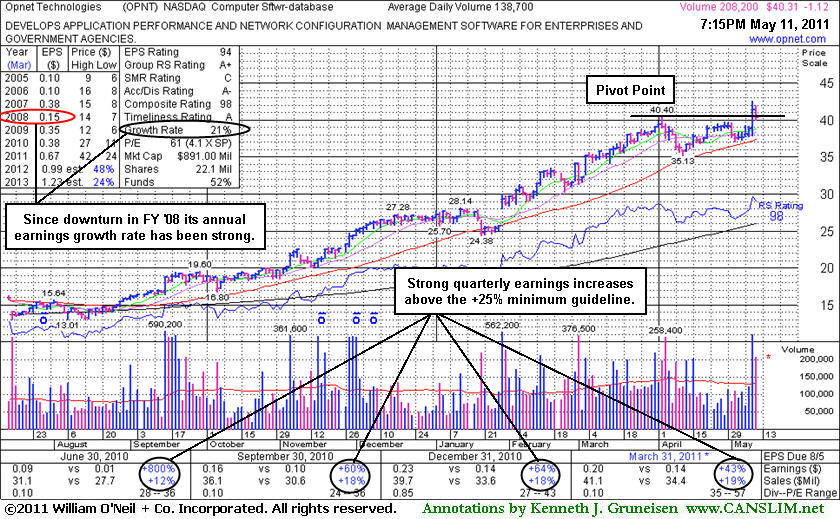
OPNT
-
NASDAQ
Opnet Technologies
INTERNET - Internet Software and Services
|
$40.31
|
-1.12
-2.70% |
$41.95
|
208,365
150.23% of 50 DAV
50 DAV is 138,700
|
$42.51
-5.18%
|
5/11/2011
|
$41.21
|
PP = $40.50
|
|
MB = $42.53
|
Most Recent Note - 5/11/2011 7:52:06 PM
Y - Pulled back today for a loss with above average volume and closed just below its pivot point, raising concerns with its weak finish after it was featured in yellow in the mid-day report. Following solid earnings news it rallied from a late stage flat base above its 50 DMA line and triggered a technical buy signal on the prior session. Recent quarters showed improving sales and earnings. Strength and leadership (L criteria) in the Computer Software - Database group is reassuring. Ownership by top-rated funds has also been on the rise, a reassuring sign concerning the I criteria. See the latest FSU analysis for more details and an annotated graph.
>>> The latest Featured Stock Update with an annotated graph appeared on 5/11/2011. Click here.
View all notes |
Alert me of new notes |
CANSLIM.net Company Profile |
SEC |
Zacks Reports |
StockTalk |
News |
Chart |
Request a new note
C
A N
S L
I M
|
PAY
-
NYSE
Verifone Systems Inc
COMPUTER HARDWARE - Transaction Automation Systems
|
$50.00
|
-1.86
-3.59% |
$51.88
|
2,014,906
80.81% of 50 DAV
50 DAV is 2,493,500
|
$58.88
-15.08%
|
4/29/2011
|
$54.73
|
PP = $58.98
|
|
MB = $61.93
|
Most Recent Note - 5/11/2011 6:11:57 PM
G - Down today with higher (but below average) volume. Its 50 DMA line acted as resistance, while subsequent gains above its short-term average would help its outlook.
>>> The latest Featured Stock Update with an annotated graph appeared on 5/4/2011. Click here.
View all notes |
Alert me of new notes |
CANSLIM.net Company Profile |
SEC |
Zacks Reports |
StockTalk |
News |
Chart |
Request a new note
C
A N
S L
I M
|
Symbol/Exchange
Company Name
Industry Group |
PRICE |
CHANGE
(%Change) |
Day High |
Volume
(% DAV)
(% 50 day avg vol) |
52 Wk Hi
% From Hi |
Featured
Date |
Price
Featured |
Pivot Featured |
|
Max Buy |
PCLN
-
NASDAQ
Priceline.Com Inc
INTERNET - Internet Software and Services
|
$520.99
|
-7.51
-1.42% |
$530.15
|
818,287
70.28% of 50 DAV
50 DAV is 1,164,300
|
$561.88
-7.28%
|
1/3/2011
|
$399.55
|
PP = $428.20
|
|
MB = $449.61
|
Most Recent Note - 5/9/2011 5:40:05 PM
G - Gain today halted its slide after a down week with damaging distributional losses. Its 50 DMA line defines important support to watch. Reported earnings +56% on +38% sales revenues fore the quarter ended March 31, 2011 versus the year ago period.
>>> The latest Featured Stock Update with an annotated graph appeared on 4/20/2011. Click here.
View all notes |
Alert me of new notes |
CANSLIM.net Company Profile |
SEC |
Zacks Reports |
StockTalk |
News |
Chart |
Request a new note
C
A N
S L
I M
|
RAX
-
NYSE
Rackspace Hosting Inc
INTERNET - Internet Software and; Services
|
$41.32
|
-3.41
-7.62% |
$44.56
|
3,462,129
210.04% of 50 DAV
50 DAV is 1,648,300
|
$46.50
-11.13%
|
3/16/2011
|
$36.28
|
PP = $40.72
|
|
MB = $42.76
|
Most Recent Note - 5/11/2011 4:49:32 PM
G - Considerable loss today with heavier volume erased its 4 prior gains and it closed near the session low just above its 50 DMA line. Heavy volume without meaningful price progress this week is a sign of distributional pressure. Important support to watch is at prior highs near $40 and its 50 DMA line, where violations would trigger technical sell signals. Earnings rose +43% on +29% higher sales revenues for the quarter ended March 31, 2011 versus the year ago period.
>>> The latest Featured Stock Update with an annotated graph appeared on 4/18/2011. Click here.
View all notes |
Alert me of new notes |
CANSLIM.net Company Profile |
SEC |
Zacks Reports |
StockTalk |
News |
Chart |
Request a new note
C
A N
S L
I M
|
TIBX
-
NASDAQ
Tibco Software Inc
COMPUTER SOFTWARE and SERVICES - Business Software and Services
|
$29.71
|
-0.79
-2.59% |
$30.75
|
2,571,137
98.80% of 50 DAV
50 DAV is 2,602,400
|
$30.70
-3.22%
|
3/18/2011
|
$23.88
|
PP = $26.04
|
|
MB = $27.34
|
Most Recent Note - 5/11/2011 6:14:16 PM
G - Perched near its all-time high, technically extended from a sound base pattern. Its 50 DMA line and recent low ($27.17) define important chart support to watch where violations may trigger sell signals.
>>> The latest Featured Stock Update with an annotated graph appeared on 4/14/2011. Click here.
View all notes |
Alert me of new notes |
CANSLIM.net Company Profile |
SEC |
Zacks Reports |
StockTalk |
News |
Chart |
Request a new note
C
A N
S L
I M
|
ULTA
-
NASDAQ
Ulta Salon Cosm & Frag
SPECIALTY RETAIL - Specialty Retail, Other
|
$54.30
|
-0.75
-1.36% |
$55.25
|
317,658
52.57% of 50 DAV
50 DAV is 604,200
|
$55.70
-2.51%
|
1/6/2011
|
$36.12
|
PP = $37.34
|
|
MB = $39.21
|
Most Recent Note - 5/11/2011 6:15:11 PM
G - Perched quietly at its all-time high, extended from any sound base pattern. Its 50 DMA line defines chart support to watch well above prior highs.
>>> The latest Featured Stock Update with an annotated graph appeared on 4/28/2011. Click here.
View all notes |
Alert me of new notes |
CANSLIM.net Company Profile |
SEC |
Zacks Reports |
StockTalk |
News |
Chart |
Request a new note
C
A N
S L
I M
|