You are not logged in.
This means you
CAN ONLY VIEW reports that were published prior to Sunday, April 6, 2025.
You
MUST UPGRADE YOUR MEMBERSHIP if you want to see any current reports.
AFTER MARKET UPDATE - MONDAY, MAY 9TH, 2022
Previous After Market Report Next After Market Report >>>
|
|
|
|
DOW |
-653.67 |
32,245.70 |
-1.99% |
|
Volume |
1,236,858,560 |
+15% |
|
Volume |
5,867,661,100 |
+10% |
|
NASDAQ |
-521.41 |
11,623.25 |
-4.29% |
|
Advancers |
382 |
12% |
|
Advancers |
784 |
19% |
|
S&P 500 |
-132.10 |
3,991.24 |
-3.20% |
|
Decliners |
2,730 |
88% |
|
Decliners |
3,372 |
81% |
|
Russell 2000 |
-77.48 |
1,762.08 |
-4.21% |
|
52 Wk Highs |
12 |
|
|
52 Wk Highs |
23 |
|
|
S&P 600 |
-34.34 |
1,174.41 |
-2.84% |
|
52 Wk Lows |
1,063 |
|
|
52 Wk Lows |
1,710 |
|
|
The market remains in a correction (M criteria). Reducing market exposure and raising cash is prudent until a new confirmed rally is noted.
|
 |
Major Averages Slump With Higher Volume Totals
Kenneth J. Gruneisen - Passed the CAN SLIM® Master's Exam
The S&P 500 retreated 3.2% to end below the 4,000 level for the first time since March 2021. The broad benchmark just came off its first five-week losing streak since June 2011. The Nasdaq Composite tumbled 4.3%, now more than 27% below its November 19 record high, while the Dow fell 653 points. Volume totals reported were higher than the prior session on the NYSE and on the Nasdaq exchange, indicating an increase in institutional selling pressure termed "distribution". Breadth was negative as decliners clearly led advancers by more than a 7-1 margin on the NYSE and by more than a 4-1 margin on the Nasdaq exchange. There were 7 high-ranked companies from the Leaders List that hit new 52-week highs and were listed on the BreakOuts Page, versus 12 on the prior session. New 52-week lows totals expanded and solidly outnumbered new 52-week highs on both the NYSE and the Nasdaq exchange. The major indices are still in a market correction (M criteria). Followers of the fact-based investment system know to watch for a follow-through day on Day 4-7 of a new rally attempt which could signal a new confirmed uptrend.
Chart courtesy of www.stockcharts.com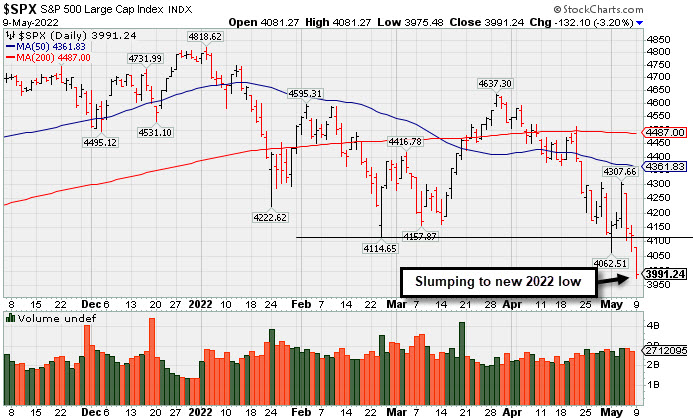 PICTURED: The S&P 500 Index slumped to a new 2022 low.
U.S. stocks finished firmly lower on Monday as a confluence of headwinds continued to pressure risk appetite. Treasuries rallied amid the perceived risk off mood, recouping some of last week’s losses. The yield on the 10-year note eased 10 basis points (0.10%) to 3.03% but has still climbed 1.52% this year to a peak not seen since late 2018.
Ten of 11 S&P 500 sectors closed in negative territory. Energy shares weathered their worst session of the year amid a slide in oil prices. West Texas Intermediate crude shed 6.7% to $102.37/barrel as ongoing pandemic-related lockdowns in China dampened demand prospects. The more traditionally defensive Consumer Staples group bucked the downtrend to end just above the flat line.
Investors continued to assess the implications of the Federal Reserve’s (Fed) path of monetary policy tightening. Last week, officials raised their benchmark interest rate by 0.50% for the first time since 2000 and signaled additional increases of similar magnitude in the coming months to combat elevated inflation. A solid monthly jobs report from the Labor Department on Friday reinforced the Fed’s plans. Meanwhile, China’s zero-COVID policy and the ongoing Russia-Ukraine war have only exacerbated worries of supply chain issues and inflationary pressures. A key update on the Consumer Price Index (CPI) on Wednesday will be closely monitored.
|
 Kenneth J. Gruneisen started out as a licensed stockbroker in August 1987, a couple of months prior to the historic stock market crash that took the Dow Jones Industrial Average down -22.6% in a single day. He has published daily fact-based fundamental and technical analysis on high-ranked stocks online for two decades. Through FACTBASEDINVESTING.COM, Kenneth provides educational articles, news, market commentary, and other information regarding proven investment systems that work in good times and bad.
Comments contained in the body of this report are technical opinions only and are not necessarily those of Gruneisen Growth Corp. The material herein has been obtained from sources believed to be reliable and accurate, however, its accuracy and completeness cannot be guaranteed. Our firm, employees, and customers may effect transactions, including transactions contrary to any recommendation herein, or have positions in the securities mentioned herein or options with respect thereto. Any recommendation contained in this report may not be suitable for all investors and it is not to be deemed an offer or solicitation on our part with respect to the purchase or sale of any securities. |
|
 |
Commodity-Linked Groups, Tech, Retail, and Financial Indexes Fell
Kenneth J. Gruneisen - Passed the CAN SLIM® Master's Exam
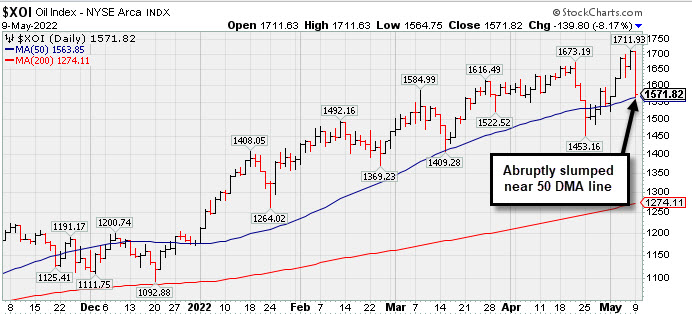
Energy-linked groups were standout decliners as the Oil Services Index ($OSX -10.84%) and Integrated Oil Index ($XOI -8.17%) both slumped. The Gold & Silver Index ($XAU -6.18%) also suffered a big loss. The tech sector saw unanimous losses from the Biotech Index ($BTK -5.89%), Semiconductor Index ($SOX -5.13%), and the Networking Index ($NWX -4.12%). The Broker/Dealer Index ($XBD -3.01%), Bank Index ($BKX -1.90%), and Retail Index ($RLX -2.65%) rounded out the widely negative session with unanimous losses.
PICTURED: The Integrated Oil Index ($XOI -8.17%) abruptly fell near its 50-day moving average line.
| Oil Services |
$OSX |
69.46 |
-8.45 |
-10.84% |
+31.76% |
| Integrated Oil |
$XOI |
1,571.82 |
-139.80 |
-8.17% |
+33.41% |
| Semiconductor |
$SOX |
2,829.10 |
-152.96 |
-5.13% |
-28.31% |
| Networking |
$NWX |
731.57 |
-31.42 |
-4.12% |
-24.66% |
| Broker/Dealer |
$XBD |
393.05 |
-12.18 |
-3.01% |
-19.27% |
| Retail |
$RLX |
3,039.53 |
-82.59 |
-2.65% |
-28.08% |
| Gold & Silver |
$XAU |
129.96 |
-8.56 |
-6.18% |
-1.88% |
| Bank |
$BKX |
110.36 |
-2.14 |
-1.90% |
-16.53% |
| Biotech |
$BTK |
4,266.02 |
-267.13 |
-5.89% |
-22.70% |
|
|
|
 |
Featured Stocks
Kenneth J. Gruneisen - Passed the CAN SLIM® Master's Exam
|
|
|
Color Codes Explained :
Y - Better candidates highlighted by our
staff of experts.
G - Previously featured
in past reports as yellow but may no longer be buyable under the
guidelines.
***Last / Change / Volume data in this table is the closing quote data***
Symbol/Exchange
Company Name
Industry Group |
PRICE |
CHANGE
(%Change) |
Day High |
Volume
(% DAV)
(% 50 day avg vol) |
52 Wk Hi
% From Hi |
Featured
Date |
Price
Featured |
Pivot Featured |
|
Max Buy |
 CI
-
NYSE
CI
-
NYSE
Cigna Corp
Medical-Managed Care
|
$261.41
|
-5.49
-2.06% |
$268.47
|
2,227,270
144.72% of 50 DAV
50 DAV is 1,539,000
|
$272.81
-4.18%
|
5/6/2022
|
$263.52
|
PP = $269.97
|
|
MB = $283.47
|
 Most Recent Note - 5/9/2022 5:13:01 PM
Y - Churned above average volume as it pulled back today from within striking distance of its all-time high. Subsequent gains above the pivot point backed by at least +40% above average volume may trigger a technical buy signal. Reported a strong +27% earnings increase on +7% sales revenues for the Mar '22 quarter versus the year ago period, its 3rd strong quarterly comparison above the +25% minimum guideline (C criteria). Annual earnings growth (A criteria) has been strong.
>>> FEATURED STOCK ARTICLE : Cigna Rises Near All-Time High - 5/6/2022 |
View all notes |
Set NEW NOTE alert |
Company Profile |
SEC
News |
Chart |
Request a new note
C
A
S
I |
IMKTA
-
NASDAQ
Ingles Markets Inc Cl A
RETAIL - Grocery Stores
|
$94.65
|
+0.52
0.55% |
$96.10
|
149,455
126.66% of 50 DAV
50 DAV is 118,000
|
$101.98
-7.19%
|
4/11/2022
|
$96.25
|
PP = $95.75
|
|
MB = $100.54
|
Most Recent Note - 5/9/2022 5:14:04 PM
Y - Posted a small gain today with higher volume after recently testing its 50 DMA line ($92.21). Reported Mar '22 quarterly earnings +40% on +16% sales revenues versus the year ago period. Volume and volatility often increase near earnings news.
>>> FEATURED STOCK ARTICLE : Ingles Markets Perched Near High With Earnings News Due - 5/4/2022 |
View all notes |
Set NEW NOTE alert |
Company Profile |
SEC
News |
Chart |
Request a new note
C
A
S
I |
WCC
-
NYSE
Wesco International Inc
WHOLESALE - Electronics Wholesale
|
$130.84
|
-9.41
-6.71% |
$140.16
|
777,202
171.57% of 50 DAV
50 DAV is 453,000
|
$144.43
-9.41%
|
4/21/2022
|
$135.54
|
PP = $139.10
|
|
MB = $146.06
|
Most Recent Note - 5/9/2022 5:19:18 PM
Y - Pulled back today for a damaging volume-driven loss. Gains and a strong close above the pivot point last week helped clinch a convincing technical buy signal, however, members were cautioned - "New buying efforts may only be considered after a solid follow-through day confirms a new market uptrend (M criteria)." Rebounded well above its 50 and 200 DMA lines. Bullish action came after it reported Mar '22 quarterly earnings +154% on +22% sales revenues versus the year ago period. Volume and volatility often increase near earnings news.
>>> FEATURED STOCK ARTICLE : Approaching Prior Highs Where it Met Resistance - 4/21/2022 |
View all notes |
Set NEW NOTE alert |
Company Profile |
SEC
News |
Chart |
Request a new note
C
A
S
I |
SMPL
-
NASDAQ
Simply Good Foods Co
Food-Confectionery
|
$37.04
|
-1.28
-3.34% |
$38.23
|
827,509
120.63% of 50 DAV
50 DAV is 686,000
|
$45.77
-19.07%
|
4/13/2022
|
$41.79
|
PP = $43.27
|
|
MB = $45.43
|
Most Recent Note - 5/9/2022 5:17:03 PM
G - Color code is changed to green after today's big loss violated its 200 DMA line ($37.68) raising greater concerns and triggering a more worrisome technical sell signal. Only a prompt rebound above the 50 DMA line ($39.40) would help its outlook improve. Fundamentals remain strong.
>>> FEATURED STOCK ARTICLE : Slump Below 50-Day Moving Average - 5/5/2022 |
View all notes |
Set NEW NOTE alert |
Company Profile |
SEC
News |
Chart |
Request a new note
C
A
S
I |
IMXI
-
NASDAQ
International Money Exp
Financial Svcs-Specialty
|
$19.91
|
-0.39
-1.92% |
$20.29
|
395,090
94.52% of 50 DAV
50 DAV is 418,000
|
$22.86
-12.90%
|
3/8/2022
|
$18.64
|
PP = $19.06
|
|
MB = $20.01
|
Most Recent Note - 5/9/2022 5:15:20 PM
G - Pulled back today for a 3rd consecutive loss. Spiked briefly above its "max buy" level with a volume-driven gain after it reported Mar '22 quarterly earnings +26% on +21% sales revenues versus the year ago period. Recently consolidating near its 50 DMA line ($19.76) which defines important near term support to watch. More damaging losses would raise concerns and trigger a technical sell signal.
>>> FEATURED STOCK ARTICLE : Consolidating After Rally From Previously Noted Base - 4/18/2022 |
View all notes |
Set NEW NOTE alert |
Company Profile |
SEC
News |
Chart |
Request a new note
C
A
S
I |
Symbol/Exchange
Company Name
Industry Group |
PRICE |
CHANGE
(%Change) |
Day High |
Volume
(% DAV)
(% 50 day avg vol) |
52 Wk Hi
% From Hi |
Featured
Date |
Price
Featured |
Pivot Featured |
|
Max Buy |
|
|
|
THESE ARE NOT BUY RECOMMENDATIONS!
Comments contained in the body of this report are technical
opinions only. The material herein has been obtained
from sources believed to be reliable and accurate, however,
its accuracy and completeness cannot be guaranteed.
This site is not an investment advisor, hence it does
not endorse or recommend any securities or other investments.
Any recommendation contained in this report may not
be suitable for all investors and it is not to be deemed
an offer or solicitation on our part with respect to
the purchase or sale of any securities. All trademarks,
service marks and trade names appearing in this report
are the property of their respective owners, and are
likewise used for identification purposes only.
This report is a service available
only to active Paid Premium Members.
You may opt-out of receiving report notifications
at any time. Questions or comments may be submitted
by writing to Premium Membership Services 665 S.E. 10 Street, Suite 201 Deerfield Beach, FL 33441-5634 or by calling 1-800-965-8307
or 954-785-1121.
|
|
|