You are not logged in.
This means you
CAN ONLY VIEW reports that were published prior to Tuesday, April 8, 2025.
You
MUST UPGRADE YOUR MEMBERSHIP if you want to see any current reports.
AFTER MARKET UPDATE - TUESDAY, MAY 10TH, 2022
Previous After Market Report Next After Market Report >>>
|
|
|
|
DOW |
-84.96 |
32,160.74 |
-0.26% |
|
Volume |
1,234,513,812 |
-0% |
|
Volume |
6,193,548,500 |
+6% |
|
NASDAQ |
+114.42 |
11,737.67 |
+0.98% |
|
Advancers |
1,361 |
43% |
|
Advancers |
1,650 |
39% |
|
S&P 500 |
+9.81 |
4,001.05 |
+0.25% |
|
Decliners |
1,838 |
57% |
|
Decliners |
2,574 |
61% |
|
Russell 2000 |
-0.29 |
1,761.79 |
-0.02% |
|
52 Wk Highs |
5 |
|
|
52 Wk Highs |
22 |
|
|
S&P 600 |
-7.39 |
1,167.02 |
-0.63% |
|
52 Wk Lows |
911 |
|
|
52 Wk Lows |
1,387 |
|
|
The market remains in a correction (M criteria). Reducing market exposure and raising cash is prudent until a new confirmed rally is noted.
|
 |
Major Average Ended Mixed as Leadership Remained Thin
Kenneth J. Gruneisen - Passed the CAN SLIM® Master's Exam
The S&P 500 added 0.3%, snapping a three-day losing streak that sent the index below the 4,000 level for the first time since March 2021. The Dow fell 84 points, while the Nasdaq Composite jumped 1% as investors seemed to buy the dip in tech stocks. Volume totals reported were near the prior session on the NYSE and higher on the Nasdaq exchange. Breadth was negative as decliners led advancers by a 9-7 margin on the NYSE and by a 5-3 margin on the Nasdaq exchange. There were 3 high-ranked companies from the Leaders List that hit new 52-week highs and were listed on the BreakOuts Page, versus 7 on the prior session. New 52-week lows totals solidly outnumbered short lists of new 52-week highs on both the NYSE and the Nasdaq exchange. The major indices are still in a market correction (M criteria). Followers of the fact-based investment system know to watch for a follow-through day on Day 4-7 of a new rally attempt which could signal a new confirmed uptrend.
Chart courtesy of www.stockcharts.com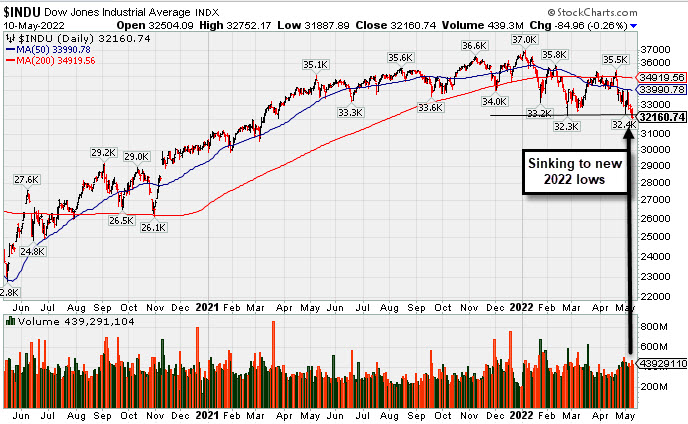 PICTURED: The Dow Jones Industrial Average slumped to a new 2022 low.
U.S. stocks fluctuated on Tuesday as investors digested the latest remarks from Federal Reserve (Fed) officials and awaited an update on the consumer price index (CPI) due Wednesday. Yesterday, the major averages notched their worst three-day rout since September 2020 as Wall Street grapples with an uncertain economic outlook amid elevated inflation.
A slight reprieve in the back-up in Treasury yields helped buoy the mood. The yield on the 10-year note slipped four basis points (0.04%) to 2.99% after having touched 3.20% intraday on Monday. Still, the benchmark rate remains 1.48% higher year-to-date. In central bank news, New York Fed President Williams admitted that tighter monetary policy could result in somewhat higher unemployment. Separately, Cleveland Fed President Mester said she was comfortable with several more 0.50% rate increases, while an even larger 0.75% hike may not be ruled out in perpetuity. On the data front, a measure of small business optimism steadied in April.
Seven of 11 S&P 500 sectors finished in negative territory, with Real Estate and Utilities lagging. Information Technology stocks outperformed amid strength in chipmakers. In earnings, Peloton Interactive Inc. (PTON -8.70%) fell on a wider-than-forecasted quarterly loss and weak guidance. Elsewhere, Biohaven Pharmaceutical Holding Company Ltd. (BHVN +68.39%) rose after agreeing to be acquired by Pfizer Inc. (PFE +1.75%) for $11.6 billion.
|
 Kenneth J. Gruneisen started out as a licensed stockbroker in August 1987, a couple of months prior to the historic stock market crash that took the Dow Jones Industrial Average down -22.6% in a single day. He has published daily fact-based fundamental and technical analysis on high-ranked stocks online for two decades. Through FACTBASEDINVESTING.COM, Kenneth provides educational articles, news, market commentary, and other information regarding proven investment systems that work in good times and bad.
Comments contained in the body of this report are technical opinions only and are not necessarily those of Gruneisen Growth Corp. The material herein has been obtained from sources believed to be reliable and accurate, however, its accuracy and completeness cannot be guaranteed. Our firm, employees, and customers may effect transactions, including transactions contrary to any recommendation herein, or have positions in the securities mentioned herein or options with respect thereto. Any recommendation contained in this report may not be suitable for all investors and it is not to be deemed an offer or solicitation on our part with respect to the purchase or sale of any securities. |
|
 |
Tech and Energy-Linked Indexes Rose
Kenneth J. Gruneisen - Passed the CAN SLIM® Master's Exam
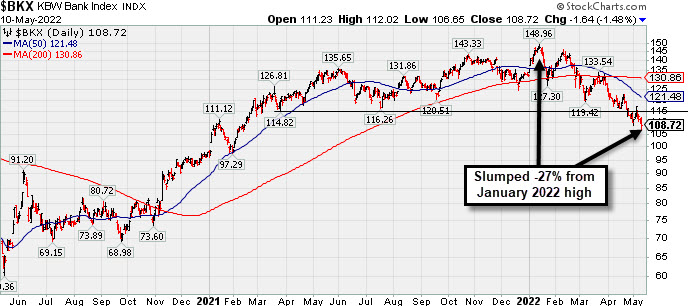
The tech sector saw unanimous gains from the Biotech Index ($BTK +3.25%), Semiconductor Index ($SOX +2.51%), and the Networking Index ($NWX +1.31%). Losses for the Broker/Dealer Index ($XBD -0.62%), Bank Index ($BKX -1.48%), and the Retail Index ($RLX -0.96%) weighed on the major averages. Commodity-linked groups were mixed as the Oil Services Index ($OSX +0.72%) and Integrated Oil Index ($XOI +0.77%) both rose but the Gold & Silver Index ($XAU -1.21%) lost ground.
PICTURED: The Bank Index ($BKX -1.48%) has slumped well below its 50-day and 200-day moving average lines. It is down -27% from its January 2022 high.
| Oil Services |
$OSX |
69.97 |
+0.50 |
+0.72% |
+32.71% |
| Integrated Oil |
$XOI |
1,583.97 |
+12.14 |
+0.77% |
+34.44% |
| Semiconductor |
$SOX |
2,900.13 |
+71.02 |
+2.51% |
-26.51% |
| Networking |
$NWX |
741.16 |
+9.61 |
+1.31% |
-23.68% |
| Broker/Dealer |
$XBD |
390.56 |
-2.45 |
-0.62% |
-19.78% |
| Retail |
$RLX |
3,010.37 |
-29.16 |
-0.96% |
-28.77% |
| Gold & Silver |
$XAU |
128.38 |
-1.58 |
-1.21% |
-3.07% |
| Bank |
$BKX |
108.72 |
-1.64 |
-1.48% |
-17.77% |
| Biotech |
$BTK |
4,404.33 |
+138.45 |
+3.25% |
-20.19% |
|
|
|
 |
Featured Stocks
Kenneth J. Gruneisen - Passed the CAN SLIM® Master's Exam
|
|
|
Color Codes Explained :
Y - Better candidates highlighted by our
staff of experts.
G - Previously featured
in past reports as yellow but may no longer be buyable under the
guidelines.
***Last / Change / Volume data in this table is the closing quote data***
Symbol/Exchange
Company Name
Industry Group |
PRICE |
CHANGE
(%Change) |
Day High |
Volume
(% DAV)
(% 50 day avg vol) |
52 Wk Hi
% From Hi |
Featured
Date |
Price
Featured |
Pivot Featured |
|
Max Buy |
 CI
-
NYSE
CI
-
NYSE
Cigna Corp
Medical-Managed Care
|
$260.65
|
-0.76
-0.29% |
$264.44
|
1,612,537
104.78% of 50 DAV
50 DAV is 1,539,000
|
$272.81
-4.46%
|
5/6/2022
|
$263.52
|
PP = $269.97
|
|
MB = $283.47
|
 Most Recent Note - 5/10/2022 5:15:46 PM
Y - Pulled back today for a 2nd loss after perched within close striking distance of its all-time high. Subsequent gains above the pivot point backed by at least +40% above average volume may trigger a technical buy signal. Reported a strong +27% earnings increase on +7% sales revenues for the Mar '22 quarter versus the year ago period, its 3rd strong quarterly comparison above the +25% minimum guideline (C criteria). Annual earnings growth (A criteria) has been strong.
>>> FEATURED STOCK ARTICLE : Cigna Rises Near All-Time High - 5/6/2022 |
View all notes |
Set NEW NOTE alert |
Company Profile |
SEC
News |
Chart |
Request a new note
C
A
S
I |
IMKTA
-
NASDAQ
Ingles Markets Inc Cl A
RETAIL - Grocery Stores
|
$96.36
|
+1.71
1.81% |
$96.48
|
130,167
110.31% of 50 DAV
50 DAV is 118,000
|
$101.98
-5.51%
|
4/11/2022
|
$96.25
|
PP = $95.75
|
|
MB = $100.54
|
Most Recent Note - 5/10/2022 5:16:57 PM
Y - Posted a 3rd consecutive small gain today after recently testing its 50 DMA line ($92.50). More damaging losses would raise concerns and trigger a technical sell signal. Reported Mar '22 quarterly earnings +40% on +16% sales revenues versus the year ago period.
>>> FEATURED STOCK ARTICLE : Ingles Markets Perched Near High With Earnings News Due - 5/4/2022 |
View all notes |
Set NEW NOTE alert |
Company Profile |
SEC
News |
Chart |
Request a new note
C
A
S
I |
WCC
-
NYSE
Wesco International Inc
WHOLESALE - Electronics Wholesale
|
$128.26
|
-2.58
-1.97% |
$133.35
|
686,801
151.61% of 50 DAV
50 DAV is 453,000
|
$144.43
-11.20%
|
4/21/2022
|
$135.54
|
PP = $139.10
|
|
MB = $146.06
|
Most Recent Note - 5/10/2022 5:25:07 PM
Y - Pulled back today for a 2nd consecutive volume-driven loss, promptly slumping back into the previously noted base, raising concerns while retesting support near its 50 and 200 DMA lines. Members were cautioned - "New buying efforts may only be considered after a solid follow-through day confirms a new market uptrend (M criteria)." Reported Mar '22 quarterly earnings +154% on +22% sales revenues versus the year ago period. Volume and volatility often increase near earnings news.
>>> FEATURED STOCK ARTICLE : Approaching Prior Highs Where it Met Resistance - 4/21/2022 |
View all notes |
Set NEW NOTE alert |
Company Profile |
SEC
News |
Chart |
Request a new note
C
A
S
I |
SMPL
-
NASDAQ
Simply Good Foods Co
Food-Confectionery
|
$36.61
|
-0.43
-1.16% |
$38.24
|
1,050,320
153.11% of 50 DAV
50 DAV is 686,000
|
$45.77
-20.01%
|
4/13/2022
|
$41.79
|
PP = $43.27
|
|
MB = $45.43
|
Most Recent Note - 5/10/2022 5:22:21 PM
Slumped further below its 200 DMA line ($37.67) with today's 2nd consecutive loss on higher volume raising greater concerns and triggering a more worrisome technical sell signal. It will be dropped from the Featured Stocks list tonight. Only a prompt rebound above the 50 DMA line ($39.34) would help its outlook improve. Fundamentals remain strong.
>>> FEATURED STOCK ARTICLE : Slump Below 50-Day Moving Average - 5/5/2022 |
View all notes |
Set NEW NOTE alert |
Company Profile |
SEC
News |
Chart |
Request a new note
C
A
S
I |
IMXI
-
NASDAQ
International Money Exp
Financial Svcs-Specialty
|
$19.73
|
-0.18
-0.90% |
$20.46
|
296,103
70.84% of 50 DAV
50 DAV is 418,000
|
$22.86
-13.69%
|
3/8/2022
|
$18.64
|
PP = $19.06
|
|
MB = $20.01
|
Most Recent Note - 5/10/2022 5:19:30 PM
G - Pulled back today for a 4th consecutive small loss with below average volume. Testing near its 50 DMA line ($19.83) and prior lows in the $19 area which define important near term support to watch. More damaging losses would raise concerns and trigger a technical sell signal. Reported Mar '22 quarterly earnings +26% on +21% sales revenues versus the year ago period.
>>> FEATURED STOCK ARTICLE : Consolidating After Rally From Previously Noted Base - 4/18/2022 |
View all notes |
Set NEW NOTE alert |
Company Profile |
SEC
News |
Chart |
Request a new note
C
A
S
I |
Symbol/Exchange
Company Name
Industry Group |
PRICE |
CHANGE
(%Change) |
Day High |
Volume
(% DAV)
(% 50 day avg vol) |
52 Wk Hi
% From Hi |
Featured
Date |
Price
Featured |
Pivot Featured |
|
Max Buy |
|
|
|
THESE ARE NOT BUY RECOMMENDATIONS!
Comments contained in the body of this report are technical
opinions only. The material herein has been obtained
from sources believed to be reliable and accurate, however,
its accuracy and completeness cannot be guaranteed.
This site is not an investment advisor, hence it does
not endorse or recommend any securities or other investments.
Any recommendation contained in this report may not
be suitable for all investors and it is not to be deemed
an offer or solicitation on our part with respect to
the purchase or sale of any securities. All trademarks,
service marks and trade names appearing in this report
are the property of their respective owners, and are
likewise used for identification purposes only.
This report is a service available
only to active Paid Premium Members.
You may opt-out of receiving report notifications
at any time. Questions or comments may be submitted
by writing to Premium Membership Services 665 S.E. 10 Street, Suite 201 Deerfield Beach, FL 33441-5634 or by calling 1-800-965-8307
or 954-785-1121.
|
|
|