You are not logged in.
This means you
CAN ONLY VIEW reports that were published prior to Monday, April 14, 2025.
You
MUST UPGRADE YOUR MEMBERSHIP if you want to see any current reports.
AFTER MARKET UPDATE - TUESDAY, MARCH 15TH, 2011
Previous After Market Report Next After Market Report >>>
|
|
|
|
DOW |
-137.74 |
11,855.42 |
-1.15% |
|
Volume |
1,288,097,670 |
+34% |
|
Volume |
2,305,232,770 |
+32% |
|
NASDAQ |
-33.64 |
2,667.33 |
-1.25% |
|
Advancers |
648 |
21% |
|
Advancers |
664 |
24% |
|
S&P 500 |
-14.52 |
1,281.87 |
-1.12% |
|
Decliners |
2,391 |
76% |
|
Decliners |
1,987 |
73% |
|
Russell 2000 |
-6.84 |
791.33 |
-0.86% |
|
52 Wk Highs |
29 |
|
|
52 Wk Highs |
23 |
|
|
S&P 600 |
-3.82 |
420.44 |
-0.90% |
|
52 Wk Lows |
77 |
|
|
52 Wk Lows |
134 |
|
|
 |
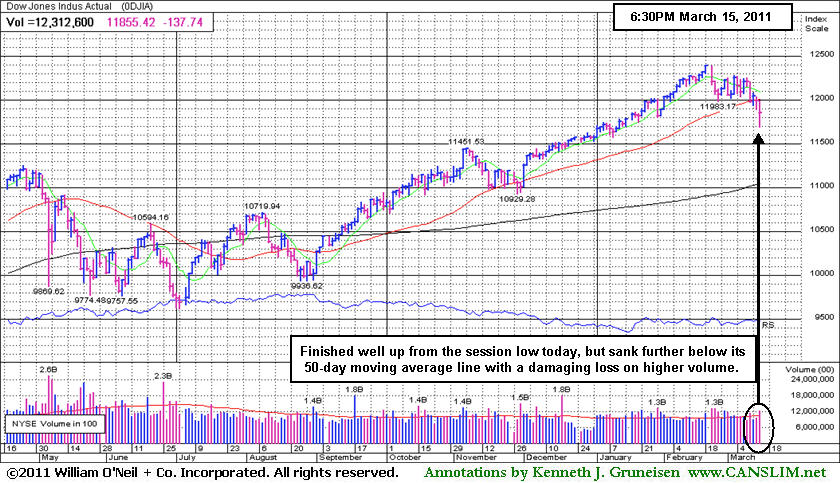
Major Averages Rebound From Early Losses After Global Downdraft
Kenneth J. Gruneisen - Passed the CAN SLIM® Master's Exam
The major averages were down sharply in early trading as Japan's nuclear crisis deepened and Bahrain declared a state of emergency. As the Fed offered upbeat comments on the economy, stocks continued to rebound from the morning's lows. The small-cap indexes fared better, meanwhile the tech-heavy Nasdaq Composite Index lagged. Volume totals were reported higher on the NYSE and on the Nasdaq exchange versus the prior session's totals,a sign of more distributional selling pressure from the institutional crowd. Declining issues beat advancers by 7-2 on the NYSE and by 3-1 on the Nasdaq exchange. New 52-week lows outnumbered new 52-week highs on the Nasdaq exchange and on the NYSE. There were 8 high-ranked companies from the CANSLIM.net Leaders List that made new 52-week highs and appeared on the CANSLIM.net BreakOuts Page, down from a total of 13 on the prior session. On the Featured Stocks Page there were gains from 9 of the 22 high-ranked market leaders currently listed.
Japan's Nikkei stock average plunged over -10% to pace a sell-off in global markets as Japan's government battled to cool three nuclear reactors damaged in last week's earthquake and tsunami. Japanese automakers shut down production because of rolling blackouts in the country. Companies with a strong presence in Japan were under pressure. Texas Instruments Inc (TXN -1.9%) fell after warning that the closure of two of its Japanese plants will reduce revenue. Insurance stocks also sold off, including AFLAC Inc (AFL -5.6%). Energy stocks fell as oil lost nearly $4 a barrel. First Solar Inc (FSLR +8.17%) and other solar and wind power stocks rallied for a second day on hopes that clean energy will benefit from the nuclear concerns.
U.S. economic news was overshadowed by international events. The March New York Empire State Manufacturing Index increased more than expected. February import prices, fueled by the cost of energy imports, rose more than forecast. The Federal Open Market Committee said the recovery is gaining strength, and added that inflation remains subdued even amid rising commodity prices. As expected, the Fed left the fed fund rates unchanged as well staying on track with asset purchases as planned through June.
More damaging distributional action has the potential to lead to a much more substantial correction for the major averages (bad M criteria). During a correction investors should raise their cash levels and reduce stock market exposure. New buying efforts should be avoided until a new rally with a follow-through day (FTD) provides a fresh confirmation that buying demand from the institutional crowd is returning again. Even after a FTD, marked by an expansion in volume and stocks hitting new highs with higher volume, buying efforts should only be cautiously and carefully made when all of the investment system's key criteria are met.
PICTURED: The Dow Jones Industrial Average pared an early loss of 296 points after a global downdraft and closed down 137 at 11,855. Although it finished well up from the session low, it sank further below its 50-day moving average line with another damaging loss on higher volume.
|
 Kenneth J. Gruneisen started out as a licensed stockbroker in August 1987, a couple of months prior to the historic stock market crash that took the Dow Jones Industrial Average down -22.6% in a single day. He has published daily fact-based fundamental and technical analysis on high-ranked stocks online for two decades. Through FACTBASEDINVESTING.COM, Kenneth provides educational articles, news, market commentary, and other information regarding proven investment systems that work in good times and bad.
Comments contained in the body of this report are technical opinions only and are not necessarily those of Gruneisen Growth Corp. The material herein has been obtained from sources believed to be reliable and accurate, however, its accuracy and completeness cannot be guaranteed. Our firm, employees, and customers may effect transactions, including transactions contrary to any recommendation herein, or have positions in the securities mentioned herein or options with respect thereto. Any recommendation contained in this report may not be suitable for all investors and it is not to be deemed an offer or solicitation on our part with respect to the purchase or sale of any securities. |
|
 |
Financial, Tech, and Commodity-Linked Groups Worst Decliners
Kenneth J. Gruneisen - Passed the CAN SLIM® Master's Exam
The Broker/Dealer Index ($XBD -1.80%) and Bank Index ($BKX -0.88%) were among the weak areas influencing the major averages again on Tuesday. Commodity-linked groups also finished lower as the Integrated Oil Index ($XOI -1.32%), Oil Services Index ($OSX -0.93%), and Gold & Silver Index ($XAU -1.06%) sank. The tech sector faced mre negative pressure as the Networking Index ($NWX -1.27%), Semiconductor Index ($SOX -1.26%), Biotechnology Index ($BTK -1.09%), and Internet Index ($IIX -0.86%) ended the session unanimously lower. Weak action led to small losses in the Retail Index ($RLX -0.60%) and Healthcare Index ($HMO -0.34%), which rounded out a clearly negative session across the board.
Charts courtesy www.stockcharts.com
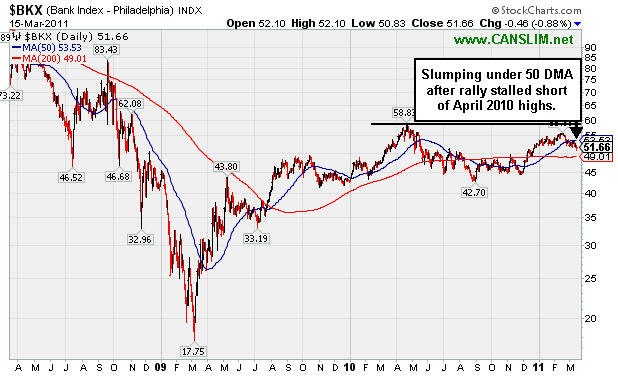
PICTURED: The 3-year chart of the Bank Index ($BKX -0.88%) shows it slumping under its 50-day moving average line after its rally recently stalled short of its April 2010 peak.
| Oil Services |
$OSX |
276.06 |
-2.60 |
-0.93% |
+12.62% |
| Healthcare |
$HMO |
2,028.22 |
-6.94 |
-0.34% |
+19.87% |
| Integrated Oil |
$XOI |
1,298.45 |
-17.38 |
-1.32% |
+7.03% |
| Semiconductor |
$SOX |
421.79 |
-5.38 |
-1.26% |
+2.42% |
| Networking |
$NWX |
316.87 |
-4.08 |
-1.27% |
+12.94% |
| Internet |
$IIX |
307.16 |
-2.67 |
-0.86% |
-0.18% |
| Broker/Dealer |
$XBD |
117.53 |
-2.15 |
-1.80% |
-3.28% |
| Retail |
$RLX |
500.63 |
-3.00 |
-0.60% |
-1.52% |
| Gold & Silver |
$XAU |
204.21 |
-2.18 |
-1.06% |
-9.87% |
| Bank |
$BKX |
51.66 |
-0.46 |
-0.88% |
-1.05% |
| Biotech |
$BTK |
1,267.77 |
-13.98 |
-1.09% |
-2.30% |
|
|
|
 |
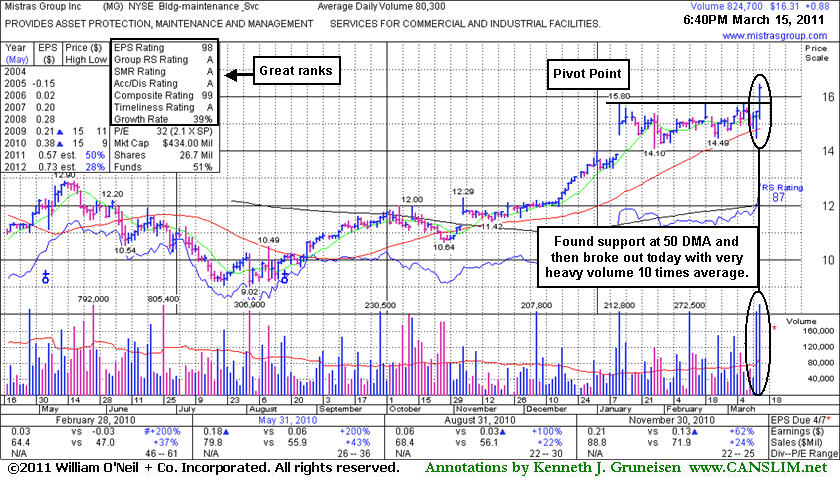
Powerful Breakout While "M" Criteria Argues Against New Buys
Kenneth J. Gruneisen - Passed the CAN SLIM® Master's Exam
Leading stocks that are highlighted in CANSLIM.net's Mid-Day BreakOuts Report are often setting up to potentially breakout of a solid base if they have not already cleared their pivot point and triggered a technical buy signal. Relevant factors are noted in the report which can give members a decent starting point, and it is a prudent time for investors to do their own research and perhaps place that issue on their watch list. When featured in yellow they are also immediately added to the Featured Stocks page, and then they receive ongoing coverage until they are noted when ultimately dropped from that list. After doing the necessary backup research, disciplined investors sit prepared to act if and when the stock triggers a technical buy signal (breaks above its pivot point on more than +50% average turnover). In the event the stock fails to trigger a technical buy signal and its price declines, then it would simply be removed from the watch list.
Mistras Group Inc (MG +$0.88 or +5.70% to $16.31) finished strong today, powering to a new all-time high with 10 times average volume while clearing its pivot point, triggering a technical buy signal. No resistance remains due to overhead supply. Its color code was changed to yellow with pivot point cited based on its 52-week high plus 10 cents when featured in the mid-day report earlier today while it was poised for a possible breakout (read here). Recent quarterly comparisons showed solid sales and earnings increases versus the year earlier. However, weak market conditions (M criteria) are currently an overriding concern arguing against new buying efforts until a new confirmed rally with follow-through day. In a truly bullish market environment, many more ideal breakouts like this can be spotted and they have a far better chance of succeeding to become big winners.
|
|
|
Color Codes Explained :
Y - Better candidates highlighted by our
staff of experts.
G - Previously featured
in past reports as yellow but may no longer be buyable under the
guidelines.
***Last / Change / Volume data in this table is the closing quote data***
Symbol/Exchange
Company Name
Industry Group |
PRICE |
CHANGE
(%Change) |
Day High |
Volume
(% DAV)
(% 50 day avg vol) |
52 Wk Hi
% From Hi |
Featured
Date |
Price
Featured |
Pivot Featured |
|
Max Buy |
BIDU
-
NASDAQ
Baidu Inc Ads
INTERNET - Internet Information Providers
|
$122.23
|
-1.83
-1.48% |
$123.27
|
6,403,226
94.87% of 50 DAV
50 DAV is 6,749,800
|
$131.63
-7.14%
|
2/1/2011
|
$117.74
|
PP = $112.08
|
|
MB = $117.68
|
 Most Recent Note - 3/15/2011 10:14:03 AM
G - Gapped down today, slumping toward its 50 DMA line. Its recent chart low ($112.95 on 2/23/11) is the next important chart support to watch below its short-term average.
>>> The latest Featured Stock Update with an annotated graph appeared on 3/9/2011. Click here.
View all notes |
Alert me of new notes |
CANSLIM.net Company Profile |
SEC |
Zacks Reports |
StockTalk |
News |
Chart |
Request a new note
C
A N
S L
I M


|
CMG
-
NYSE
Chipotle Mexican Grill
LEISURE - Restaurants
|
$258.00
|
+2.75
1.08% |
$259.99
|
1,124,683
105.89% of 50 DAV
50 DAV is 1,062,100
|
$275.00
-6.18%
|
2/11/2011
|
$271.15
|
PP = $262.87
|
|
MB = $276.01
|
Most Recent Note - 3/14/2011 8:42:27 PM
G - Positive reversal today was a reassuring sign while consolidating above support at its 50 DMA line and prior highs in the $237 area. Violations and damaging losses would raise greater concerns and trigger technical sell signals. See the latest FSU analysis for more details and a new annotated graph.
>>> The latest Featured Stock Update with an annotated graph appeared on 3/14/2011. Click here.
View all notes |
Alert me of new notes |
CANSLIM.net Company Profile |
SEC |
Zacks Reports |
StockTalk |
News |
Chart |
Request a new note
C
A N
S L
I M
|
CRUS
-
NASDAQ
Cirrus Logic Inc
ELECTRONICS - Semiconductor - Specialized
|
$21.04
|
-0.79
-3.62% |
$21.33
|
3,850,666
102.24% of 50 DAV
50 DAV is 3,766,300
|
$25.48
-17.43%
|
1/28/2011
|
$20.69
|
PP = $19.17
|
|
MB = $20.13
|
Most Recent Note - 3/15/2011 9:58:43 AM
G - Gapped down today below its 50 DMA, trading near recent lows and near the previously noted high close ($20.54 on 7/26/10). More damaging losses would raise serious concerns and trigger more worrisome technical sell signals.
>>> The latest Featured Stock Update with an annotated graph appeared on 3/4/2011. Click here.
View all notes |
Alert me of new notes |
CANSLIM.net Company Profile |
SEC |
Zacks Reports |
StockTalk |
News |
Chart |
Request a new note
C
A N
S L
I M
|
CTSH
-
NASDAQ
Cognizant Tech Sol Cl A
COMPUTER SOFTWARE and SERVICES - Business Software and Services
|
$74.00
|
-1.37
-1.82% |
$74.48
|
2,577,952
109.19% of 50 DAV
50 DAV is 2,361,000
|
$78.69
-5.96%
|
2/7/2011
|
$75.09
|
PP = $76.46
|
|
MB = $80.28
|
Most Recent Note - 3/14/2011 7:12:22 PM
Y - Down today with below average volume, testing support at its 50 DMA line. Any violation of its short-term average and subsequent breach of its recent chart low ($73.25 on 2/23/11) would be more worrisome signs of damaging distributional pressure.
>>> The latest Featured Stock Update with an annotated graph appeared on 2/8/2011. Click here.
View all notes |
Alert me of new notes |
CANSLIM.net Company Profile |
SEC |
Zacks Reports |
StockTalk |
News |
Chart |
Request a new note
C
A N
S L
I M
|
DECK
-
NASDAQ
Deckers Outdoor Corp
CONSUMER NON-DURABLES - Textile - Apparel Footwear
|
$81.21
|
-2.02
-2.43% |
$82.20
|
1,239,728
77.83% of 50 DAV
50 DAV is 1,592,800
|
$94.70
-14.24%
|
2/3/2011
|
$79.61
|
PP = $82.67
|
|
MB = $86.80
|
Most Recent Note - 3/15/2011 10:02:04 AM
G - Gapped down today violating its 50 DMA line, raising concerns and hurting its technical outlook.
>>> The latest Featured Stock Update with an annotated graph appeared on 3/3/2011. Click here.
View all notes |
Alert me of new notes |
CANSLIM.net Company Profile |
SEC |
Zacks Reports |
StockTalk |
News |
Chart |
Request a new note
C
A N
S L
I M
|
Symbol/Exchange
Company Name
Industry Group |
PRICE |
CHANGE
(%Change) |
Day High |
Volume
(% DAV)
(% 50 day avg vol) |
52 Wk Hi
% From Hi |
Featured
Date |
Price
Featured |
Pivot Featured |
|
Max Buy |
EBIX
-
NASDAQ
Ebix Inc
COMPUTER SOFTWARE and SERVICES - Business Software and Services
|
$27.98
|
+0.59
2.15% |
$28.42
|
895,389
150.92% of 50 DAV
50 DAV is 593,300
|
$29.61
-5.50%
|
2/28/2011
|
$25.70
|
PP = $25.97
|
|
MB = $27.27
|
Most Recent Note - 3/15/2011 4:23:30 PM
G - Overcame early weakness today and managed a positive reversal for a gain with above average volume. Wider than usual intra-day swings are a sign of uncertainty while distributional action recently raised concerns. Prior highs in the $25-26 area define important chart support to watch along with its 50 DMA line.
>>> The latest Featured Stock Update with an annotated graph appeared on 2/28/2011. Click here.
View all notes |
Alert me of new notes |
CANSLIM.net Company Profile |
SEC |
Zacks Reports |
StockTalk |
News |
Chart |
Request a new note
C
A N
S L
I M
|
EZCH
-
NASDAQ
Ezchip Semiconductor Ltd
ELECTRONICS - Semiconductor - Specialized
|
$28.21
|
-0.33
-1.16% |
$28.66
|
471,391
117.70% of 50 DAV
50 DAV is 400,500
|
$33.48
-15.74%
|
12/2/2010
|
$27.53
|
PP = $26.00
|
|
MB = $27.30
|
Most Recent Note - 3/15/2011 10:06:32 AM
G - Gapped down today raising greater concerns while trading below the neckline (at $27.00) of the previously noted head-and-shoulders pattern. Its rising 200 DMA line and earlier lows define the next support.
>>> The latest Featured Stock Update with an annotated graph appeared on 3/1/2011. Click here.
View all notes |
Alert me of new notes |
CANSLIM.net Company Profile |
SEC |
Zacks Reports |
StockTalk |
News |
Chart |
Request a new note
C
A N
S L
I M
|
EZPW
-
NASDAQ
Ezcorp Inc Cl A
SPECIALTY RETAIL - Specialty Retail, Other
|
$27.37
|
-0.09
-0.33% |
$27.71
|
285,235
75.36% of 50 DAV
50 DAV is 378,500
|
$29.94
-8.58%
|
2/18/2011
|
$27.94
|
PP = $30.04
|
|
MB = $31.54
|
Most Recent Note - 3/10/2011 2:49:53 PM
G - Color code is changed to green while today's loss violating its 50 DMA line raises concerns. Gains with heavy volume above its latest pivot point have not shown up to provide the critical proof of institutional buying demand, meanwhile the recent low ($25.56 on 1/25/11) defines an important support level.
>>> The latest Featured Stock Update with an annotated graph appeared on 3/10/2011. Click here.
View all notes |
Alert me of new notes |
CANSLIM.net Company Profile |
SEC |
Zacks Reports |
StockTalk |
News |
Chart |
Request a new note
C
A N
S L
I M
|
FOSL
-
NASDAQ
Fossil Inc
CONSUMER DURABLES - Recreational Goods, Other
|
$82.55
|
+0.12
0.15% |
$83.05
|
877,727
93.76% of 50 DAV
50 DAV is 936,100
|
$85.20
-3.11%
|
2/1/2011
|
$73.30
|
PP = $74.44
|
|
MB = $78.16
|
Most Recent Note - 3/15/2011 10:18:21 AM
G - Pulling back from its all-time high with today's 4th consecutive small loss following a spurt of volume-driven gains. It is still extended from its prior base. It found support at its 50 DMA line while consolidating above prior resistance in the $74 area.
>>> The latest Featured Stock Update with an annotated graph appeared on 2/24/2011. Click here.
View all notes |
Alert me of new notes |
CANSLIM.net Company Profile |
SEC |
Zacks Reports |
StockTalk |
News |
Chart |
Request a new note
C
A N
S L
I M
|
HMSY
-
NASDAQ
H M S Holdings Corp
COMPUTER SOFTWARE and SERVICES - Healthcare Information Service
|
$78.28
|
-1.08
-1.36% |
$79.12
|
211,319
123.58% of 50 DAV
50 DAV is 171,000
|
$81.36
-3.79%
|
11/19/2010
|
$61.89
|
PP = $63.01
|
|
MB = $66.16
|
Most Recent Note - 3/15/2011 10:20:31 AM
G - Pulling back from its all-time high with today's 4th consecutive loss. It is extended from any sound base pattern. Support to watch is defined by prior chart highs and its 50 DMA line in the $67 area.
>>> The latest Featured Stock Update with an annotated graph appeared on 2/16/2011. Click here.
View all notes |
Alert me of new notes |
CANSLIM.net Company Profile |
SEC |
Zacks Reports |
StockTalk |
News |
Chart |
Request a new note
C
A N
S L
I M
|
Symbol/Exchange
Company Name
Industry Group |
PRICE |
CHANGE
(%Change) |
Day High |
Volume
(% DAV)
(% 50 day avg vol) |
52 Wk Hi
% From Hi |
Featured
Date |
Price
Featured |
Pivot Featured |
|
Max Buy |
JOBS
-
NASDAQ
Fifty One Job Inc Ads
DIVERSIFIED SERVICES - Staffing and; Outsourcing Service
|
$54.11
|
-1.48
-2.66% |
$54.55
|
161,701
119.78% of 50 DAV
50 DAV is 135,000
|
$64.55
-16.17%
|
2/7/2011
|
$59.23
|
PP = $61.38
|
|
MB = $64.45
|
Most Recent Note - 3/15/2011 9:55:17 AM
G - Considerable gap down today, diving well below its 50 DMA line and violating a previously noted low ($52.58 on 1/28/11) triggering a more worrisome technical sell signal.
>>> The latest Featured Stock Update with an annotated graph appeared on 3/11/2011. Click here.
View all notes |
Alert me of new notes |
CANSLIM.net Company Profile |
SEC |
Zacks Reports |
StockTalk |
News |
Chart |
Request a new note
C
A N
S L
I M
|
LULU
-
NASDAQ
Lululemon Athletica
MANUFACTURING - Textile Manufacturing
|
$79.13
|
+0.89
1.14% |
$79.86
|
2,158,448
108.51% of 50 DAV
50 DAV is 1,989,100
|
$85.28
-7.21%
|
1/26/2011
|
$68.11
|
PP = $74.70
|
|
MB = $78.44
|
Most Recent Note - 3/15/2011 4:36:18 PM
G - Overcame early weakness after a gap down today, rallying for a positive reversal and closing near the session high. Color code is changed to green after rising back above its "max buy" level. During its recent consolidation it made a stand at its 50 DMA line, a classic chart support level. As previously noted - "A close below a significant prior high close ($73.51 on 12/21/10) would completely negate its latest breakout, raising more serious concerns."
>>> The latest Featured Stock Update with an annotated graph appeared on 2/25/2011. Click here.
View all notes |
Alert me of new notes |
CANSLIM.net Company Profile |
SEC |
Zacks Reports |
StockTalk |
News |
Chart |
Request a new note
C
A N
S L
I M
|
MG
-
NYSE
Mistras Group Inc
DIVERSIFIED SERVICES - Bulding and Faci;ity Management Services
|
$16.31
|
+0.88
5.70% |
$16.46
|
825,997
1,028.64% of 50 DAV
50 DAV is 80,300
|
$15.80
3.23%
|
3/15/2011
|
$15.48
|
PP = $15.90
|
|
MB = $16.70
|
Most Recent Note - 3/15/2011 7:25:01 PM
Y - Triggered a technical buy signal after noted in today's mid-day report - "Finding support at its 50 DMA line this week while still holding its ground stubbornly in a tight trading range since a considerable 'breakaway gap' on 1/12/11 for new highs. No resistance remains due to overhead supply. Color code is changed to yellow with pivot point cited based on its 52-week high plus 10 cents. Market conditions (M criteria) argue against new buying efforts until a new confirmed rally with follow-through day, meanwhile it is poised for a possible breakout. Recent quarterly comparisons showed solid sales and earnings increases versus the year earlier." See the FSU analysis for additional details and an annotated graph.
>>> The latest Featured Stock Update with an annotated graph appeared on 3/15/2011. Click here.
View all notes |
Alert me of new notes |
CANSLIM.net Company Profile |
SEC |
Zacks Reports |
StockTalk |
News |
Chart |
Request a new note
C
A N
S L
I M
|
MWIV
-
NASDAQ
M W I Veterinary Supply
HEALTH SERVICES - Medical Instruments and; Supplies
|
$75.63
|
-0.66
-0.87% |
$76.48
|
123,247
140.21% of 50 DAV
50 DAV is 87,900
|
$78.48
-3.63%
|
11/4/2010
|
$61.79
|
PP = $59.60
|
|
MB = $62.58
|
Most Recent Note - 3/11/2011 4:25:53 PM
G - Perched at its all-time high, holding its ground following a streak of gains with above average volume. Found support near prior highs and its 50 DMA line recently but did not build a sound new base pattern. See the latest FSU analysis for more details and a new annotated graph.
>>> The latest Featured Stock Update with an annotated graph appeared on 3/8/2011. Click here.
View all notes |
Alert me of new notes |
CANSLIM.net Company Profile |
SEC |
Zacks Reports |
StockTalk |
News |
Chart |
Request a new note
C
A N
S L
I M
|
OPEN
-
NASDAQ
Opentable Inc
INTERNET - Internet Software and Services
|
$88.02
|
-0.60
-0.68% |
$89.00
|
935,347
83.42% of 50 DAV
50 DAV is 1,121,200
|
$95.97
-8.28%
|
1/5/2011
|
$74.05
|
PP = $76.79
|
|
MB = $80.63
|
Most Recent Note - 3/14/2011 1:27:31 PM
G - Gapped down today after closing the prior week higher despite broader market weakness. Current consolidation of just over 4 weeks has the look of a bullish base-on-base type pattern forming. Support to watch is at its 50 DMA line and prior chart highs.
>>> The latest Featured Stock Update with an annotated graph appeared on 2/15/2011. Click here.
View all notes |
Alert me of new notes |
CANSLIM.net Company Profile |
SEC |
Zacks Reports |
StockTalk |
News |
Chart |
Request a new note
C
A N
S L
I M
|
Symbol/Exchange
Company Name
Industry Group |
PRICE |
CHANGE
(%Change) |
Day High |
Volume
(% DAV)
(% 50 day avg vol) |
52 Wk Hi
% From Hi |
Featured
Date |
Price
Featured |
Pivot Featured |
|
Max Buy |
ORCL
-
NASDAQ
Oracle Corp
COMPUTER SOFTWARE and SERVICES - Application Software
|
$31.17
|
-0.42
-1.33% |
$31.30
|
34,884,597
142.70% of 50 DAV
50 DAV is 24,446,500
|
$33.71
-7.53%
|
1/20/2011
|
$32.31
|
PP = $32.37
|
|
MB = $33.99
|
Most Recent Note - 3/15/2011 10:10:54 AM
G - Gapped down today, slumping further below its 50 DMA line and violating the prior low previously noted ($30.80 on 1/10/11) as the next important chart support level to watch. Its Relative Strength rank (now 74) has fallen below the 80+ guideline required of proper buy candidates.
>>> The latest Featured Stock Update with an annotated graph appeared on 2/22/2011. Click here.
View all notes |
Alert me of new notes |
CANSLIM.net Company Profile |
SEC |
Zacks Reports |
StockTalk |
News |
Chart |
Request a new note
C
A N
S L
I M
|
PAY
-
NYSE
Verifone Systems Inc
COMPUTER HARDWARE - Transaction Automation Systems
|
$51.46
|
+3.55
7.41% |
$52.49
|
5,761,288
331.13% of 50 DAV
50 DAV is 1,739,900
|
$51.23
0.45%
|
1/27/2011
|
$41.77
|
PP = $44.97
|
|
MB = $47.22
|
Most Recent Note - 3/15/2011 12:08:10 PM
G - Powered to a new all-time high today, rallying with above average volume after overcoming early weakness. No resistance remains due to overhead supply, but it is extended from a sound base pattern. Its 50 DMA line defines chart support to watch.
>>> The latest Featured Stock Update with an annotated graph appeared on 3/2/2011. Click here.
View all notes |
Alert me of new notes |
CANSLIM.net Company Profile |
SEC |
Zacks Reports |
StockTalk |
News |
Chart |
Request a new note
C
A N
S L
I M
|
PCLN
-
NASDAQ
Priceline.Com Inc
INTERNET - Internet Software and Services
|
$461.34
|
-2.27
-0.49% |
$464.35
|
1,221,632
104.55% of 50 DAV
50 DAV is 1,168,500
|
$474.74
-2.82%
|
1/3/2011
|
$399.55
|
PP = $428.20
|
|
MB = $449.61
|
Most Recent Note - 3/15/2011 10:25:27 AM
G - Consolidating above support at its 50 DMA line, stubbornly holding its ground just -4.5% off its 52-week high. It has not built a sound base pattern recently.
>>> The latest Featured Stock Update with an annotated graph appeared on 2/14/2011. Click here.
View all notes |
Alert me of new notes |
CANSLIM.net Company Profile |
SEC |
Zacks Reports |
StockTalk |
News |
Chart |
Request a new note
C
A N
S L
I M
|
RAX
-
NYSE
Rackspace Hosting Inc
INTERNET - Internet Software and; Services
|
$36.29
|
+0.02
0.06% |
$36.69
|
1,592,360
85.18% of 50 DAV
50 DAV is 1,869,500
|
$40.62
-10.66%
|
1/10/2011
|
$22.84
|
PP = $32.76
|
|
MB = $34.40
|
Most Recent Note - 3/15/2011 10:26:54 AM
G - Down today amid widespread market weakness. Testing prior highs near $35 and its 50 DMA line defining chart support to watch.
>>> The latest Featured Stock Update with an annotated graph appeared on 2/9/2011. Click here.
View all notes |
Alert me of new notes |
CANSLIM.net Company Profile |
SEC |
Zacks Reports |
StockTalk |
News |
Chart |
Request a new note
C
A N
S L
I M
|
TIBX
-
NASDAQ
Tibco Software Inc
COMPUTER SOFTWARE and SERVICES - Business Software and Services
|
$23.94
|
+0.01
0.04% |
$24.22
|
2,262,102
90.66% of 50 DAV
50 DAV is 2,495,100
|
$25.94
-7.71%
|
2/1/2011
|
$24.35
|
PP = $22.18
|
|
MB = $23.29
|
Most Recent Note - 3/15/2011 10:30:13 AM
G - Down today, testing support at its 50 DMA line and matching its recent chart low ($22.87) earlier in the session. More damaging losses would raise concerns and trigger more worrisome technical sell signals.
>>> The latest Featured Stock Update with an annotated graph appeared on 2/10/2011. Click here.
View all notes |
Alert me of new notes |
CANSLIM.net Company Profile |
SEC |
Zacks Reports |
StockTalk |
News |
Chart |
Request a new note
C
A N
S L
I M
|
Symbol/Exchange
Company Name
Industry Group |
PRICE |
CHANGE
(%Change) |
Day High |
Volume
(% DAV)
(% 50 day avg vol) |
52 Wk Hi
% From Hi |
Featured
Date |
Price
Featured |
Pivot Featured |
|
Max Buy |
UA
-
NYSE
Under Armour Inc Cl A
CONSUMER NON-DURABLES - Textile - Apparel Clothing
|
$67.52
|
-0.75
-1.10% |
$68.24
|
617,766
80.17% of 50 DAV
50 DAV is 770,600
|
$70.69
-4.48%
|
1/27/2011
|
$58.31
|
PP = $56.99
|
|
MB = $59.84
|
Most Recent Note - 3/15/2011 10:32:22 AM
G -Gapped down today amid widespread market weakness. Its current consolidation has been healthy while forming a base-on-base type pattern.
>>> The latest Featured Stock Update with an annotated graph appeared on 3/7/2011. Click here.
View all notes |
Alert me of new notes |
CANSLIM.net Company Profile |
SEC |
Zacks Reports |
StockTalk |
News |
Chart |
Request a new note
C
A N
S L
I M
|
ULTA
-
NASDAQ
Ulta Salon Cosm & Frag
SPECIALTY RETAIL - Specialty Retail, Other
|
$47.19
|
+0.24
0.51% |
$47.85
|
1,074,889
183.65% of 50 DAV
50 DAV is 585,300
|
$47.55
-0.76%
|
1/6/2011
|
$36.12
|
PP = $37.34
|
|
MB = $39.21
|
Most Recent Note - 3/15/2011 12:39:43 PM
G - Perched at its all-time high today after a spurt of volume-driven gains. Its recent 4-week consolidation was too short to be considered a sound new base pattern. Support to watch is at its 50 DMA line and recent chart lows near the $40 level.
>>> The latest Featured Stock Update with an annotated graph appeared on 2/17/2011. Click here.
View all notes |
Alert me of new notes |
CANSLIM.net Company Profile |
SEC |
Zacks Reports |
StockTalk |
News |
Chart |
Request a new note
C
A N
S L
I M
|
|
|
|
THESE ARE NOT BUY RECOMMENDATIONS!
Comments contained in the body of this report are technical
opinions only. The material herein has been obtained
from sources believed to be reliable and accurate, however,
its accuracy and completeness cannot be guaranteed.
This site is not an investment advisor, hence it does
not endorse or recommend any securities or other investments.
Any recommendation contained in this report may not
be suitable for all investors and it is not to be deemed
an offer or solicitation on our part with respect to
the purchase or sale of any securities. All trademarks,
service marks and trade names appearing in this report
are the property of their respective owners, and are
likewise used for identification purposes only.
This report is a service available
only to active Paid Premium Members.
You may opt-out of receiving report notifications
at any time. Questions or comments may be submitted
by writing to Premium Membership Services 665 S.E. 10 Street, Suite 201 Deerfield Beach, FL 33441-5634 or by calling 1-800-965-8307
or 954-785-1121.
|
|
|

