You are not logged in.
This means you
CAN ONLY VIEW reports that were published prior to Wednesday, March 26, 2025.
You
MUST UPGRADE YOUR MEMBERSHIP if you want to see any current reports.
AFTER MARKET UPDATE - WEDNESDAY, MARCH 5TH, 2014
Previous After Market Report Next After Market Report >>>
|
|
|
|
DOW |
-35.70 |
16,360.18 |
-0.22% |
|
Volume |
653,635,790 |
-22% |
|
Volume |
2,078,681,270 |
-9% |
|
NASDAQ |
+6.00 |
4,357.97 |
+0.14% |
|
Advancers |
1,458 |
47% |
|
Advancers |
1,260 |
47% |
|
S&P 500 |
-0.10 |
1,873.81 |
-0.01% |
|
Decliners |
1,541 |
49% |
|
Decliners |
1,323 |
49% |
|
Russell 2000 |
-2.74 |
1,205.91 |
-0.23% |
|
52 Wk Highs |
190 |
|
|
52 Wk Highs |
181 |
|
|
S&P 600 |
-1.54 |
679.57 |
-0.23% |
|
52 Wk Lows |
8 |
|
|
52 Wk Lows |
10 |
|
|
 |
Less Leadership on Mixed Session as Volume Totals Cooled
Kenneth J. Gruneisen - Passed the CAN SLIM® Master's Exam
On Wednesday the major averages finished mixed and little changed. Volume total were reported lighter on the NYSE and on the Nasdaq. Breadth was fairly even with a slightly negative bias on the NYSE and on the Nasdaq exchange. There were 79 high-ranked companies from the CANSLIM.net Leaders List that made new 52-week highs and appeared on the CANSLIM.net BreakOuts Page, down from the total of 111 stocks on the prior session. The list of stocks hitting new 52-week highs contracted yet still easily outnumbered new 52-week lows on the Nasdaq exchange and on the NYSE. There were gains for only 3 of the 11 high-ranked companies currently included on the Featured Stocks Page. The Market (M criteria) environment has been noted as a "Confirmed Uptrend". For any rally to be sustained it is critical for there to be healthy leadership, so it remains crucial for many stocks to continue hitting new 52-week highs.
Stocks took a breather following Tuesday's rally. Equities spent the day searching for direction as investors monitored the situation in Ukraine and assessed some disappointing economic data. ADP reported the weakest two-month employment growth since 2012 and a separate report showed service industries expanded at the slowest pace in four years. The Fed's Beige Book also garnered some attention as the majority of districts reported "modest to moderate" improvement in economic activity but bad weather hurt retail sales and manufacturing.
Overall, sectors were mixed. Financials and consumer discretionary were the best performing groups as Bank of America (BAC +3.17%) and Amazon.com (AMZN +2.33%) rose. Meanwhile, energy stocks suffered a setback as WTI crude fell for a second day and Exxon Mobil (XOM -2.82%) and Chevron (CVX -0.77%) declined. The utilities sector also lagged behind, led by NextEra Energy's (NEE -1.10%) retreat.
Treasury prices inched higher. The 10-year note gained 2/32 to yield 2.69%. The 30-year bond rose 9/32 to yield 3.63%.
The CANSLIM.net Featured Stocks Page shows the most action-worthy candidates and their latest notes and a Headline Link directs members to the latest detailed analysis with data-packed graphs annotated by a Certified expert along with links to additional resources. The Premium Member Homepage includes "dynamic archives" to all prior pay reports published. Watch for an announcement via email concerning the next WEBCAST.
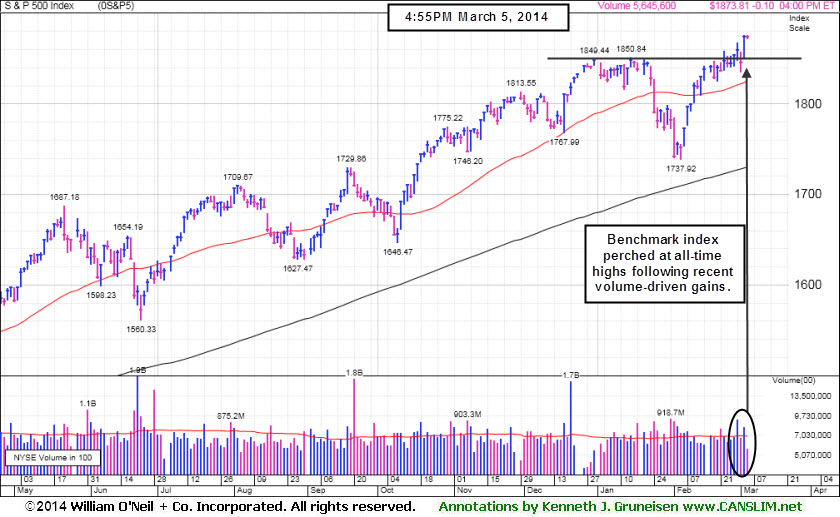
PICTURED: The S&P 500 Index is perched at all-time highs following recent volume-driven gains.
|
 Kenneth J. Gruneisen started out as a licensed stockbroker in August 1987, a couple of months prior to the historic stock market crash that took the Dow Jones Industrial Average down -22.6% in a single day. He has published daily fact-based fundamental and technical analysis on high-ranked stocks online for two decades. Through FACTBASEDINVESTING.COM, Kenneth provides educational articles, news, market commentary, and other information regarding proven investment systems that work in good times and bad.
Comments contained in the body of this report are technical opinions only and are not necessarily those of Gruneisen Growth Corp. The material herein has been obtained from sources believed to be reliable and accurate, however, its accuracy and completeness cannot be guaranteed. Our firm, employees, and customers may effect transactions, including transactions contrary to any recommendation herein, or have positions in the securities mentioned herein or options with respect thereto. Any recommendation contained in this report may not be suitable for all investors and it is not to be deemed an offer or solicitation on our part with respect to the purchase or sale of any securities. |
|
 |
Financial, Retail, & Tech Groups Rose; Energy-Related Groups Edged Lower
Kenneth J. Gruneisen - Passed the CAN SLIM® Master's Exam
The Bank Index ($BKX +0.73%) underpinned the major averages' advance while the Broker/Dealer Index ($XBD +0.13%) and Retail Index ($RLX +0.28%) each posted a smaller gain. The Networking Index ($NWX +0.78%) led the tech sector and the Semiconductor Index ($SOX +0.21%) edged higher while the Biotechnology Index ($BTK -0.01%) finished flat. The Gold & Silver Index ($XAU +1.45%) posted a solid gain, meanwhile weakness in energy-related shares dragged on the market slightly as the Oil Services Index ($OSX -0.45%) and the Integrated Oil Index ($XOI -0.35%) edged lower.
Charts courtesy www.stockcharts.com

PICTURED: The Gold & Silver Index ($XAU +1.45%) is consolidating after rebounding above its 50-day and 200-day moving average (DMA) lines.
| Oil Services |
$OSX |
279.25 |
-1.27 |
-0.45% |
-0.63% |
| Integrated Oil |
$XOI |
1,476.21 |
-5.24 |
-0.35% |
-1.79% |
| Semiconductor |
$SOX |
571.30 |
+1.17 |
+0.21% |
+6.78% |
| Networking |
$NWX |
351.37 |
+2.74 |
+0.78% |
+8.47% |
| Broker/Dealer |
$XBD |
163.17 |
+0.21 |
+0.13% |
+1.63% |
| Retail |
$RLX |
944.05 |
+2.59 |
+0.28% |
+0.45% |
| Gold & Silver |
$XAU |
101.95 |
+1.46 |
+1.45% |
+21.15% |
| Bank |
$BKX |
70.14 |
+0.51 |
+0.73% |
+1.27% |
| Biotech |
$BTK |
2,885.46 |
-0.15 |
-0.01% |
+23.82% |
|
|
|
 |
Consolidating Following Recent Breakout to New High Territory
Kenneth J. Gruneisen - Passed the CAN SLIM® Master's Exam
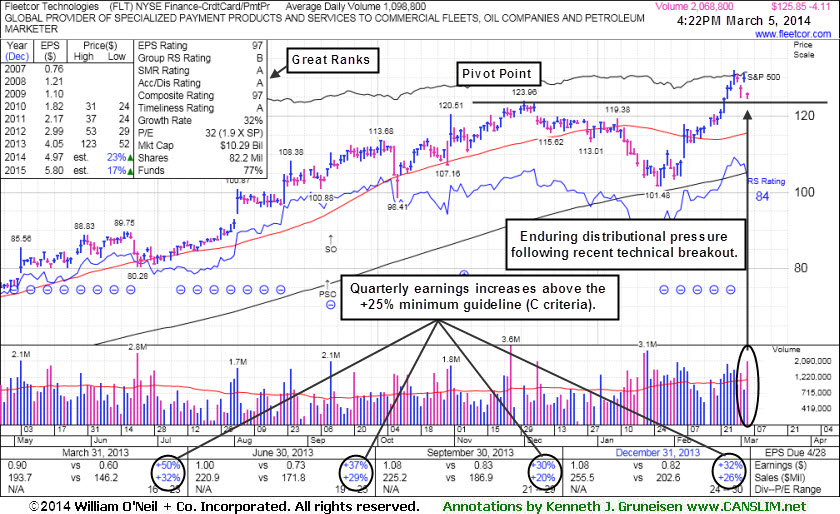
FleetCor Technologies, Inc. (FLT -$4.11% or -3.16% to $125.85) fell today on higher volume indicative of distributional pressure. Prior highs in the $123 area define initial support to watch. It was highlighted in yellow while pivot point cited is based on its 12/02/13 high plus 10 cents in the earlier mid-day report (read here). It is consolidating above prior highs following a recent spurt of volume-driven gains for new 52-week highs. Technically, it broke out last week with volume-driven gains. Odds are most favorable for investors who buy while a stock is rising, rather than buying stocks on pullbacks. Disciplined investors limit losses by selling any stock that falls more than -7% from their purchase price.
FLT last appeared in this FSU section on 12/17/13 with annotated daily and weekly graphs under the headline, "Enduring Distributional Pressure While Extended From Sound Base". After dropped from the Featured Stocks list on 1/15/14 it slumped near its 200-day moving average (DMA) line. Volume-driven gains helped it rebound above its 50-day moving average (DMA) line and since then it made gradual progress. Fundamentals remain strong with earnings +32% on +26% sales revenues for the Dec '13 continuing its strong earnings history satisfying the C criteria.
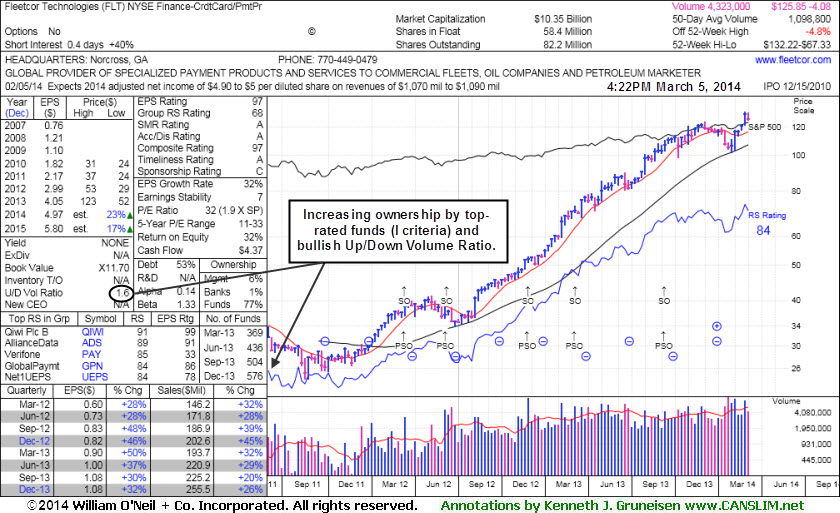
The company completed a Secondary Offering on 9/11/13. Prior Secondary Offerings on 3/14/12, 6/11/12, 11/29/12, and 3/08/13 were previously noted, "Such offerings often are a short-term hindrance to upward price progress yet typically result in broader institutional ownership interest."
The number of top-rated funds owning its shares rose from 193 in Mar '12 to 576 in Dec '13, a reassuring sign concerning the I criteria. The company hails from the Finance - Credit Card Payment Processing group which currently has a 68 Group Relative Strength Rating. Impressive strength and leadership from a couple of other firms in the same industry group is also considered a reassurance concerning the L criteria.
|
|
|
Color Codes Explained :
Y - Better candidates highlighted by our
staff of experts.
G - Previously featured
in past reports as yellow but may no longer be buyable under the
guidelines.
***Last / Change / Volume data in this table is the closing quote data***
Symbol/Exchange
Company Name
Industry Group |
PRICE |
CHANGE
(%Change) |
Day High |
Volume
(% DAV)
(% 50 day avg vol) |
52 Wk Hi
% From Hi |
Featured
Date |
Price
Featured |
Pivot Featured |
|
Max Buy |
EQM
-
NYSE
E Q T Midstream Partners
ENERGY - Oil and Gas Pipelines
|
$66.08
|
-0.69
-1.03% |
$66.98
|
77,632
69.31% of 50 DAV
50 DAV is 112,000
|
$67.80
-2.54%
|
12/12/2013
|
$53.17
|
PP = $56.51
|
|
MB = $59.34
|
Most Recent Note - 3/3/2014 5:44:55 PM
G - Stubbornly holding its ground since reporting earnings -2% on +22% sales revenues for the Dec '13 quarter, below the +25% minimum earnings guideline (C criteria), raising fundamental concerns. Its 50 DMA line defines near-term support where a violation may trigger a technical sell signal. See the latest FSU analysis for more details and new annotated graphs.
>>> FEATURED STOCK ARTICLE : Resilient Despite Fundamental Concerns - 3/3/2014
View all notes |
Set NEW NOTE alert |
CANSLIM.net Company Profile |
SEC
News |
Chart |
Request a new note
C
A N
S L
I M


|
FB
-
NASDAQ
Facebook Inc Cl A
INTERNET
|
$71.57
|
+2.77
4.03% |
$71.97
|
74,545,605
115.80% of 50 DAV
50 DAV is 64,377,000
|
$71.44
0.18%
|
12/12/2013
|
$51.40
|
PP = $54.93
|
|
MB = $57.68
|
 Most Recent Note - 3/5/2014 5:19:09 PM
G - Gapped up and hit another new all-time high with today's volume-driven gain. Extended from any sound base and its 50 DMA line ($61.13 now) defines near-term support to watch.
>>> FEATURED STOCK ARTICLE : High-Ranked Internet Group Leader is Extended From Base - 2/25/2014
View all notes |
Set NEW NOTE alert |
CANSLIM.net Company Profile |
SEC
News |
Chart |
Request a new note
C
A N
S L
I M
|
FLT
-
NYSE
Fleetcor Technologies
DIVERSIFIED SERVICES - Business/Management Services
|
$125.85
|
-4.11
-3.16% |
$126.25
|
2,124,423
193.48% of 50 DAV
50 DAV is 1,098,000
|
$132.22
-4.82%
|
3/5/2014
|
$125.40
|
PP = $124.06
|
|
MB = $130.26
|
Most Recent Note - 3/5/2014 5:17:07 PM
Y - Highlighted in yellow in the earlier mid-day report (read here) with pivot point cited based on its 12/02/13 high plus 10 cents. Consolidating above prior highs following a recent spurt of volume-driven gains for new 52-week highs, and technically, it broke out last week. After dropped from the Featured Stocks list on 1/15/14 it rebounded above its 50 DMA line and made gradual progress. Fundamentals remain strong with earnings +32% on +26% sales revenues for the Dec '13 continuing its strong earnings history satisfying the C criteria. See the latest FSU analysis for more details and new annotated graphs.
>>> FEATURED STOCK ARTICLE : Consolidating Following Recent Breakout to New High Territory - 3/5/2014
View all notes |
Set NEW NOTE alert |
CANSLIM.net Company Profile |
SEC
News |
Chart |
Request a new note
C
A N
S L
I M
|
GNRC
-
NYSE
Generac Hldgs Inc
Electrical-Power/Equipmt
|
$58.60
|
-0.38
-0.64% |
$59.17
|
529,101
55.52% of 50 DAV
50 DAV is 953,000
|
$59.15
-0.93%
|
2/14/2014
|
$56.50
|
PP = $57.39
|
|
MB = $60.26
|
Most Recent Note - 3/3/2014 5:39:16 PM
Y - Volume totals have been cooling while consolidating near previously stubborn resistance in the $57 area, while no resistance remains due to overhead supply. Volume should be at least +40% above average as a stock rallies above its pivot point to trigger a proper technical buy signal.
>>> FEATURED STOCK ARTICLE : Following Island Reversal Prior Highs May Act as Resistance - 2/14/2014
View all notes |
Set NEW NOTE alert |
CANSLIM.net Company Profile |
SEC
News |
Chart |
Request a new note
C
A N
S L
I M
|
KORS
-
NYSE
Michael Kors Hldgs Ltd
RETAIL - Apparel Stores
|
$98.99
|
+0.11
0.11% |
$99.66
|
1,557,153
39.51% of 50 DAV
50 DAV is 3,941,000
|
$101.04
-2.03%
|
2/4/2014
|
$90.92
|
PP = $84.68
|
|
MB = $88.91
|
Most Recent Note - 3/5/2014 5:23:42 PM
G - Holding its ground in a tight range near its 52-week high with volume totals cooling in recent weeks indicating that few investors have headed for the exit. Prior highs in the $84 area define the nearest chart support level.
>>> FEATURED STOCK ARTICLE : Extended From Sound Base and Wedging Higher - 2/19/2014
View all notes |
Set NEW NOTE alert |
CANSLIM.net Company Profile |
SEC
News |
Chart |
Request a new note
C
A N
S L
I M
|
Symbol/Exchange
Company Name
Industry Group |
PRICE |
CHANGE
(%Change) |
Day High |
Volume
(% DAV)
(% 50 day avg vol) |
52 Wk Hi
% From Hi |
Featured
Date |
Price
Featured |
Pivot Featured |
|
Max Buy |
LEAF
-
NYSE
Springleaf Holdings Inc
Finance-Consumer Loans
|
$27.69
|
-0.75
-2.64% |
$28.23
|
450,211
133.99% of 50 DAV
50 DAV is 336,000
|
$29.50
-6.14%
|
2/24/2014
|
$28.60
|
PP = $27.44
|
|
MB = $28.81
|
Most Recent Note - 3/5/2014 5:21:17 PM
Y - Gapped down today for a loss with above average volume yet ended in the middle of its intra-day range. Prior highs in the $27 area define initial support to watch following its recent technical breakout. Disciplined investors avoid chasing extended stocks more than +5% above prior highs and always limit losses by selling any stock that falls more than -7% from their purchase price. See the annotated daily graph below this note and details with a weekly graph in the latest FSU analysis.

>>> FEATURED STOCK ARTICLE : Breakout Backed by Four Times Average Volume - 2/24/2014
View all notes |
Set NEW NOTE alert |
CANSLIM.net Company Profile |
SEC
News |
Chart |
Request a new note
C
A N
S L
I M
|
PCLN
-
NASDAQ
Priceline.com Inc
INTERNET - Internet Software and Services
|
$1,370.43
|
+2.11
0.15% |
$1,371.23
|
476,844
62.09% of 50 DAV
50 DAV is 768,000
|
$1,375.41
-0.36%
|
12/18/2013
|
$1,156.20
|
PP = $1,198.85
|
|
MB = $1,258.79
|
Most Recent Note - 3/3/2014 2:47:31 PM
G - Holding its ground near its 52-week high today with volume totals cooling after an impressive streak of gains. Rallied with no resistance due to overhead supply, and it is extended from any sound base.
>>> FEATURED STOCK ARTICLE : Extended From Prior Highs After 6th Straight Gain - 2/13/2014
View all notes |
Set NEW NOTE alert |
CANSLIM.net Company Profile |
SEC
News |
Chart |
Request a new note
C
A N
S L
I M
|
PSIX
-
NASDAQ
Power Solutions Intl Inc
Machinery-Gen Industrial
|
$74.30
|
-0.16
-0.21% |
$75.03
|
21,641
37.31% of 50 DAV
50 DAV is 58,000
|
$78.96
-5.90%
|
2/28/2014
|
$74.65
|
PP = $76.93
|
|
MB = $80.78
|
Most Recent Note - 2/28/2014 6:46:49 PM
Y - Highlighted in yellow with new pivot point cited based on its 2/21/14 high in the earlier mid-day report (read here). Reported earnings +26% on +17% sales revenues for the Dec '13 quarter, its 3rd consecutive quarter with earnings above the +25% minimum guideline (C criteria). Subsequent volume-driven gains above the pivot point may trigger a technical buy signal from a cup-with-handle base. See the latest FSU analysis for more details and a new annotated weekly graph.

>>> FEATURED STOCK ARTICLE : Earnings Solid and Forming a Cup-With-Handle - 2/28/2014
View all notes |
Set NEW NOTE alert |
CANSLIM.net Company Profile |
SEC
News |
Chart |
Request a new note
C
A N
S L
I M
|
SILC
-
NASDAQ
Silicom Ltd
COMPUTER HARDWARE - Networking andamp; Communication Dev
|
$73.00
|
+0.00
0.00% |
$73.37
|
60,224
77.21% of 50 DAV
50 DAV is 78,000
|
$73.44
-0.60%
|
12/23/2013
|
$44.62
|
PP = $46.25
|
|
MB = $48.56
|
Most Recent Note - 3/5/2014 5:25:56 PM
G - Held its ground today. Extended from any sound base after 11 consecutive weekly gains. Patient investors may watch for a new base or secondary buy point to possibly develop and be noted in the weeks ahead.
>>> FEATURED STOCK ARTICLE : Stubbornly Held Ground Following Breakaway Gap - 2/11/2014
View all notes |
Set NEW NOTE alert |
CANSLIM.net Company Profile |
SEC
News |
Chart |
Request a new note
C
A N
S L
I M
|
ULTI
-
NASDAQ
Ultimate Software Group
INTERNET - Internet Software and Services
|
$166.12
|
-2.10
-1.25% |
$167.69
|
108,363
52.60% of 50 DAV
50 DAV is 206,000
|
$171.96
-3.40%
|
1/27/2014
|
$153.75
|
PP = $162.98
|
|
MB = $171.13
|
Most Recent Note - 3/5/2014 5:24:56 PM
Y - Still hovering above its pivot point and below its "max buy" level. Found support above its 50 DMA line following a worrisome "negative reversal" on 2/05/14.
>>> FEATURED STOCK ARTICLE : Near 52--Week High Following Another Volume-Driven Gain - 3/4/2014
View all notes |
Set NEW NOTE alert |
CANSLIM.net Company Profile |
SEC
News |
Chart |
Request a new note
C
A N
S L
I M
|
Symbol/Exchange
Company Name
Industry Group |
PRICE |
CHANGE
(%Change) |
Day High |
Volume
(% DAV)
(% 50 day avg vol) |
52 Wk Hi
% From Hi |
Featured
Date |
Price
Featured |
Pivot Featured |
|
Max Buy |
VRX
-
NYSE
Valeant Pharmaceuticals
DRUGS - Drug Manufacturers - Other
|
$145.13
|
-1.10
-0.75% |
$146.82
|
1,241,288
82.31% of 50 DAV
50 DAV is 1,508,000
|
$153.10
-5.21%
|
9/11/2013
|
$100.26
|
PP = $105.50
|
|
MB = $110.78
|
Most Recent Note - 3/3/2014 1:08:07 PM
G - Reported +76% earnings on +109% sales revenues for the Dec '13 quarter. Pulling back from new all-time highs hit last week. Its 50 DMA line ($132) defines near-term support to watch.
>>> FEATURED STOCK ARTICLE : Strong Earnings Report; On Track for 9th Weekly Gain in 10 Weeks - 2/27/2014
View all notes |
Set NEW NOTE alert |
CANSLIM.net Company Profile |
SEC
News |
Chart |
Request a new note
C
A N
S L
I M
|
|
|
|
THESE ARE NOT BUY RECOMMENDATIONS!
Comments contained in the body of this report are technical
opinions only. The material herein has been obtained
from sources believed to be reliable and accurate, however,
its accuracy and completeness cannot be guaranteed.
This site is not an investment advisor, hence it does
not endorse or recommend any securities or other investments.
Any recommendation contained in this report may not
be suitable for all investors and it is not to be deemed
an offer or solicitation on our part with respect to
the purchase or sale of any securities. All trademarks,
service marks and trade names appearing in this report
are the property of their respective owners, and are
likewise used for identification purposes only.
This report is a service available
only to active Paid Premium Members.
You may opt-out of receiving report notifications
at any time. Questions or comments may be submitted
by writing to Premium Membership Services 665 S.E. 10 Street, Suite 201 Deerfield Beach, FL 33441-5634 or by calling 1-800-965-8307
or 954-785-1121.
|
|
|

