You are not logged in.
This means you
CAN ONLY VIEW reports that were published prior to Tuesday, April 1, 2025.
You
MUST UPGRADE YOUR MEMBERSHIP if you want to see any current reports.
AFTER MARKET UPDATE - THURSDAY, MARCH 6TH, 2014
Previous After Market Report Next After Market Report >>>
|
|
|
|
DOW |
+61.71 |
16,421.89 |
+0.38% |
|
Volume |
662,994,090 |
+1% |
|
Volume |
2,006,662,110 |
-3% |
|
NASDAQ |
-5.85 |
4,352.13 |
-0.13% |
|
Advancers |
1,714 |
55% |
|
Advancers |
1,365 |
51% |
|
S&P 500 |
+3.22 |
1,877.03 |
+0.17% |
|
Decliners |
1,314 |
42% |
|
Decliners |
1,256 |
47% |
|
Russell 2000 |
-1.36 |
1,204.54 |
-0.11% |
|
52 Wk Highs |
256 |
|
|
52 Wk Highs |
218 |
|
|
S&P 600 |
+1.13 |
680.70 |
+0.17% |
|
52 Wk Lows |
6 |
|
|
52 Wk Lows |
9 |
|
|
 |
Major Averages Ended Mixed as S&P 500 Hit Another Record High
Kenneth J. Gruneisen - Passed the CAN SLIM® Master's Exam
The major averages ended mixed again on Thursday. Volume totals were reported slightly higher on the NYSE and slightly lower on the Nasdaq exchange. Advancers narrowly outnumbered decliners on the NYSE and on the Nasdaq exchange. There were 85 high-ranked companies from the CANSLIM.net Leaders List that made new 52-week highs and appeared on the CANSLIM.net BreakOuts Page, up from the total of 79 stocks on the prior session. The list of stocks hitting new 52-week highs expanded and easily outnumbered new 52-week lows on the Nasdaq exchange and on the NYSE, and new 52-week lows were in the single digits on both major exchanges. There were gains for 4 of the 11 high-ranked companies currently included on the Featured Stocks Page. The Market (M criteria) environment has been noted as a "Confirmed Uptrend". For any rally to be sustained it is critical for there to be healthy leadership, so it remains crucial for many stocks to continue hitting new 52-week highs.
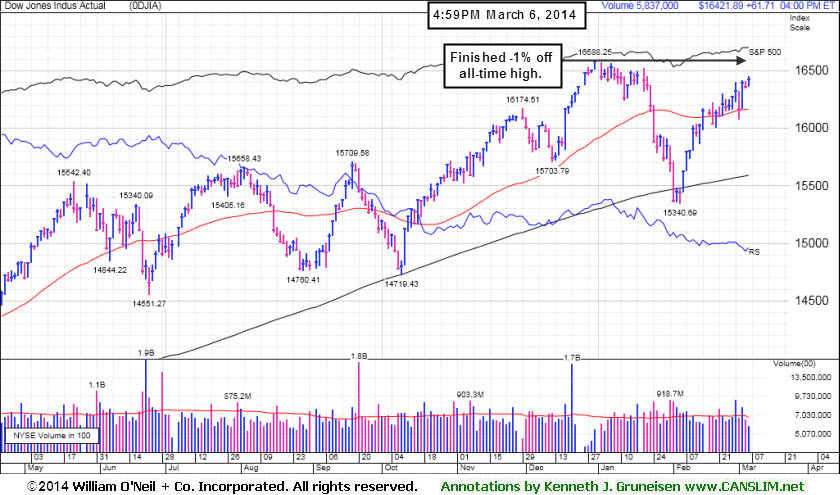
Stocks finished mostly higher on Thursday. The Dow gained 61 points to 16,421. The S&P 500 closed at a record high for the third time this week as it advanced 3 points to 1,877. The NASDAQ bucked the trend, falling 5 points to 4,352.
A larger than expected drop in jobless claims to a three-month low of 323,000 helped lift the market. Meanwhile, factory orders fell for a second month amid harsh winter weather.
Overall, seven of the 10 S&P 500 sectors finished higher. Financials and industrials paced the advance. Berkshire Hathaway (BRKB +1.87) rose and General Electric (GE +1.12%) increased for a third day. The more defensive utilities sector closed in negative territory including Exelon (EXC -1.55%). Health care also retreated. Biotechnology stocks weighed on the NASDAQ as Gilead Sciences (GILD -3.56) and Celgene (CELG -4.06%).
Now the focus turns to Friday's employment update. Non-farm payrolls are projected to increase by 149,000 in February and the unemployment is expected to remain at 6.6%.
Treasury prices declined. The 10-year note fell 9/32 to yield 2.74%. The 30-year bond lost 24/32 to yield 3.69%.
The CANSLIM.net Featured Stocks Page shows the most action-worthy candidates and their latest notes and a Headline Link directs members to the latest detailed analysis with data-packed graphs annotated by a Certified expert along with links to additional resources. The Premium Member Homepage includes "dynamic archives" to all prior pay reports published. Watch for an announcement via email concerning the next WEBCAST.
PICTURED: The Dow Jones Industrial Average is perched -1% off its all-time high hit 12/31/13.
|
 Kenneth J. Gruneisen started out as a licensed stockbroker in August 1987, a couple of months prior to the historic stock market crash that took the Dow Jones Industrial Average down -22.6% in a single day. He has published daily fact-based fundamental and technical analysis on high-ranked stocks online for two decades. Through FACTBASEDINVESTING.COM, Kenneth provides educational articles, news, market commentary, and other information regarding proven investment systems that work in good times and bad.
Comments contained in the body of this report are technical opinions only and are not necessarily those of Gruneisen Growth Corp. The material herein has been obtained from sources believed to be reliable and accurate, however, its accuracy and completeness cannot be guaranteed. Our firm, employees, and customers may effect transactions, including transactions contrary to any recommendation herein, or have positions in the securities mentioned herein or options with respect thereto. Any recommendation contained in this report may not be suitable for all investors and it is not to be deemed an offer or solicitation on our part with respect to the purchase or sale of any securities. |
|
 |
Financial and Commodity-Linked Groups Rose
Kenneth J. Gruneisen - Passed the CAN SLIM® Master's Exam
The tech sector was mixed as the Biotechnology Index ($BTK -2.50%) created a drag while the Networking Index ($NWX +0.01%) finished flat and the Semiconductor Index ($SOX +0.65%) posted a modest gain. The financial group had a positive bias as the Broker/Dealer Index ($XBD +0.21%) and the Bank Index ($BKX +0.77%) both rose, but the Retail Index ($RLX -0.51%) edged lower. Commodity-linked groups rose as the Oil Services Index ($OSX +1.15%), Integrated Oil Index ($XOI +0.67%), and the Gold & Silver Index ($XAU +1.18%) tallied gains.
Charts courtesy www.stockcharts.com
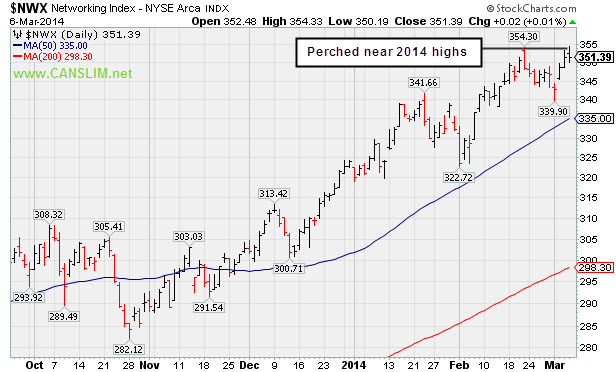
PICTURED: The Networking Index ($NWX +0.01%) is perched near its 2014 high.
| Oil Services |
$OSX |
282.46 |
+3.21 |
+1.15% |
+0.51% |
| Integrated Oil |
$XOI |
1,486.08 |
+9.87 |
+0.67% |
-1.13% |
| Semiconductor |
$SOX |
575.02 |
+3.72 |
+0.65% |
+7.47% |
| Networking |
$NWX |
351.39 |
+0.02 |
+0.01% |
+8.47% |
| Broker/Dealer |
$XBD |
163.52 |
+0.35 |
+0.21% |
+1.84% |
| Retail |
$RLX |
939.19 |
-4.86 |
-0.51% |
-0.06% |
| Gold & Silver |
$XAU |
103.15 |
+1.20 |
+1.18% |
+22.58% |
| Bank |
$BKX |
70.68 |
+0.54 |
+0.77% |
+2.05% |
| Biotech |
$BTK |
2,813.23 |
-72.23 |
-2.50% |
+20.72% |
|
|
|
 |
Very Extended From Prior Base After 11 Straight Weekly Gains
Kenneth J. Gruneisen - Passed the CAN SLIM® Master's Exam
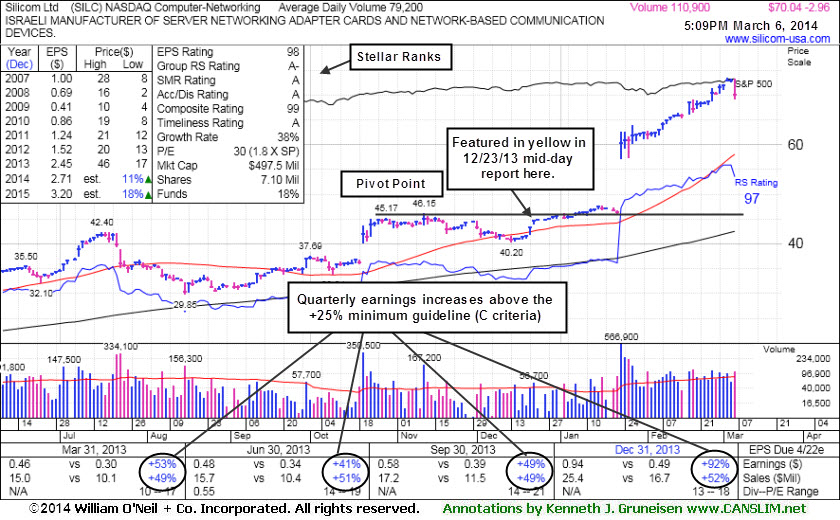
Silicom Ltd (SILC -$2.96 or -4.05% to $70.04) pulled back from all-time highs with today's loss on higher volume following a streak of 4 consecutive gains. It is extended from any sound base after 11 consecutive weekly gains. Patient investors may watch for a new base or secondary buy point to possibly develop and be noted in the weeks ahead. It made gradual progress since last shown in this FSU section on 2/11/14 under the headline, "Stubbornly Held Ground Following Breakaway Gap".
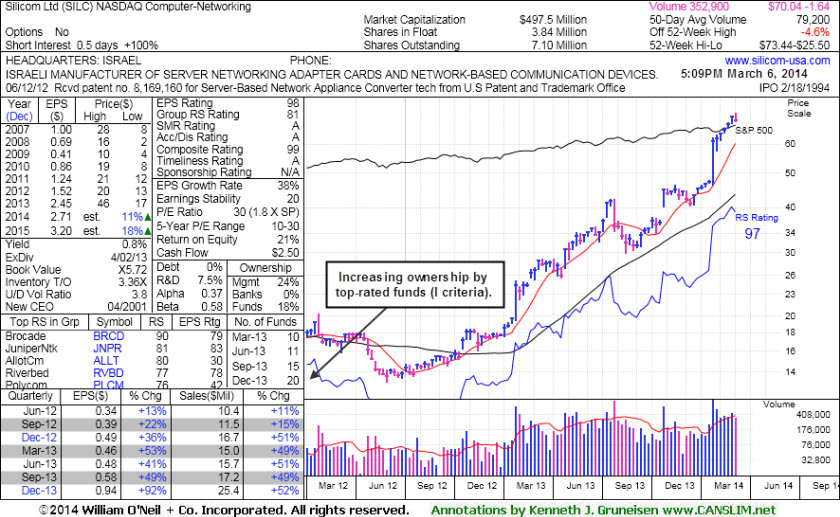
There was a considerable "breakaway gap" up on 1/23/14 after reporting earnings +92% on +52% sales for the Dec '13 quarter, beating consensus estimates and continuing its streak of strong quarterly earnings increases satisfying the C criteria. After a downturn in FY '08 and '09 earnings its annual earnings (A criteria) history has shown strong and steady growth. Its small supply (S criteria) of only 3.84 million shares in the public float can contribute to greater price volatility in the event of institutional buying or selling. The number of top-rated funds owning its shares rose from 7 in Dec '12 to 20 in Dec '13, a reassuring sign concerning the I criteria. Its current Up/Down Volume Ratio of 3.8 is also an unbiased indication its shares have been under accumulation over the past 50 days.
|
|
|
Color Codes Explained :
Y - Better candidates highlighted by our
staff of experts.
G - Previously featured
in past reports as yellow but may no longer be buyable under the
guidelines.
***Last / Change / Volume data in this table is the closing quote data***
Symbol/Exchange
Company Name
Industry Group |
PRICE |
CHANGE
(%Change) |
Day High |
Volume
(% DAV)
(% 50 day avg vol) |
52 Wk Hi
% From Hi |
Featured
Date |
Price
Featured |
Pivot Featured |
|
Max Buy |
EQM
-
NYSE
E Q T Midstream Partners
ENERGY - Oil and Gas Pipelines
|
$65.76
|
-0.32
-0.48% |
$66.15
|
73,927
66.60% of 50 DAV
50 DAV is 111,000
|
$67.80
-3.01%
|
12/12/2013
|
$53.17
|
PP = $56.51
|
|
MB = $59.34
|
Most Recent Note - 3/3/2014 5:44:55 PM
G - Stubbornly holding its ground since reporting earnings -2% on +22% sales revenues for the Dec '13 quarter, below the +25% minimum earnings guideline (C criteria), raising fundamental concerns. Its 50 DMA line defines near-term support where a violation may trigger a technical sell signal. See the latest FSU analysis for more details and new annotated graphs.
>>> FEATURED STOCK ARTICLE : Resilient Despite Fundamental Concerns - 3/3/2014
View all notes |
Set NEW NOTE alert |
CANSLIM.net Company Profile |
SEC
News |
Chart |
Request a new note
C
A N
S L
I M


|
FB
-
NASDAQ
Facebook Inc Cl A
INTERNET
|
$70.84
|
-0.73
-1.02% |
$71.89
|
46,012,452
71.81% of 50 DAV
50 DAV is 64,074,000
|
$71.97
-1.57%
|
12/12/2013
|
$51.40
|
PP = $54.93
|
|
MB = $57.68
|
Most Recent Note - 3/5/2014 5:19:09 PM
G - Gapped up and hit another new all-time high with today's volume-driven gain. Extended from any sound base and its 50 DMA line ($61.13 now) defines near-term support to watch.
>>> FEATURED STOCK ARTICLE : High-Ranked Internet Group Leader is Extended From Base - 2/25/2014
View all notes |
Set NEW NOTE alert |
CANSLIM.net Company Profile |
SEC
News |
Chart |
Request a new note
C
A N
S L
I M
|
FLT
-
NYSE
Fleetcor Technologies
DIVERSIFIED SERVICES - Business/Management Services
|
$126.53
|
+0.68
0.54% |
$127.90
|
1,251,755
110.77% of 50 DAV
50 DAV is 1,130,000
|
$132.22
-4.30%
|
3/5/2014
|
$125.40
|
PP = $124.06
|
|
MB = $130.26
|
Most Recent Note - 3/5/2014 5:17:07 PM
Y - Highlighted in yellow in the earlier mid-day report (read here) with pivot point cited based on its 12/02/13 high plus 10 cents. Consolidating above prior highs following a recent spurt of volume-driven gains for new 52-week highs, and technically, it broke out last week. After dropped from the Featured Stocks list on 1/15/14 it rebounded above its 50 DMA line and made gradual progress. Fundamentals remain strong with earnings +32% on +26% sales revenues for the Dec '13 continuing its strong earnings history satisfying the C criteria. See the latest FSU analysis for more details and new annotated graphs.
>>> FEATURED STOCK ARTICLE : Consolidating Following Recent Breakout to New High Territory - 3/5/2014
View all notes |
Set NEW NOTE alert |
CANSLIM.net Company Profile |
SEC
News |
Chart |
Request a new note
C
A N
S L
I M
|
GNRC
-
NYSE
Generac Hldgs Inc
Electrical-Power/Equipmt
|
$59.00
|
+0.40
0.68% |
$59.35
|
501,220
52.59% of 50 DAV
50 DAV is 953,000
|
$59.17
-0.29%
|
2/14/2014
|
$56.50
|
PP = $57.39
|
|
MB = $60.26
|
Most Recent Note - 3/3/2014 5:39:16 PM
Y - Volume totals have been cooling while consolidating near previously stubborn resistance in the $57 area, while no resistance remains due to overhead supply. Volume should be at least +40% above average as a stock rallies above its pivot point to trigger a proper technical buy signal.
>>> FEATURED STOCK ARTICLE : Following Island Reversal Prior Highs May Act as Resistance - 2/14/2014
View all notes |
Set NEW NOTE alert |
CANSLIM.net Company Profile |
SEC
News |
Chart |
Request a new note
C
A N
S L
I M
|
KORS
-
NYSE
Michael Kors Hldgs Ltd
RETAIL - Apparel Stores
|
$98.62
|
-0.37
-0.37% |
$99.46
|
1,279,940
32.54% of 50 DAV
50 DAV is 3,934,000
|
$101.04
-2.40%
|
2/4/2014
|
$90.92
|
PP = $84.68
|
|
MB = $88.91
|
Most Recent Note - 3/5/2014 5:23:42 PM
G - Holding its ground in a tight range near its 52-week high with volume totals cooling in recent weeks indicating that few investors have headed for the exit. Prior highs in the $84 area define the nearest chart support level.
>>> FEATURED STOCK ARTICLE : Extended From Sound Base and Wedging Higher - 2/19/2014
View all notes |
Set NEW NOTE alert |
CANSLIM.net Company Profile |
SEC
News |
Chart |
Request a new note
C
A N
S L
I M
|
Symbol/Exchange
Company Name
Industry Group |
PRICE |
CHANGE
(%Change) |
Day High |
Volume
(% DAV)
(% 50 day avg vol) |
52 Wk Hi
% From Hi |
Featured
Date |
Price
Featured |
Pivot Featured |
|
Max Buy |
LEAF
-
NYSE
Springleaf Holdings Inc
Finance-Consumer Loans
|
$27.82
|
+0.13
0.47% |
$28.00
|
349,990
103.24% of 50 DAV
50 DAV is 339,000
|
$29.50
-5.69%
|
2/24/2014
|
$28.60
|
PP = $27.44
|
|
MB = $28.81
|
Most Recent Note - 3/5/2014 5:21:17 PM
Y - Gapped down today for a loss with above average volume yet ended in the middle of its intra-day range. Prior highs in the $27 area define initial support to watch following its recent technical breakout. Disciplined investors avoid chasing extended stocks more than +5% above prior highs and always limit losses by selling any stock that falls more than -7% from their purchase price. See the annotated daily graph below this note and details with a weekly graph in the latest FSU analysis.

>>> FEATURED STOCK ARTICLE : Breakout Backed by Four Times Average Volume - 2/24/2014
View all notes |
Set NEW NOTE alert |
CANSLIM.net Company Profile |
SEC
News |
Chart |
Request a new note
C
A N
S L
I M
|
PCLN
-
NASDAQ
Priceline.com Inc
INTERNET - Internet Software and Services
|
$1,364.40
|
-6.03
-0.44% |
$1,378.96
|
484,450
63.33% of 50 DAV
50 DAV is 765,000
|
$1,375.41
-0.80%
|
12/18/2013
|
$1,156.20
|
PP = $1,198.85
|
|
MB = $1,258.79
|
Most Recent Note - 3/3/2014 2:47:31 PM
G - Holding its ground near its 52-week high today with volume totals cooling after an impressive streak of gains. Rallied with no resistance due to overhead supply, and it is extended from any sound base.
>>> FEATURED STOCK ARTICLE : Extended From Prior Highs After 6th Straight Gain - 2/13/2014
View all notes |
Set NEW NOTE alert |
CANSLIM.net Company Profile |
SEC
News |
Chart |
Request a new note
C
A N
S L
I M
|
PSIX
-
NASDAQ
Power Solutions Intl Inc
Machinery-Gen Industrial
|
$80.78
|
+6.48
8.72% |
$81.47
|
109,738
192.52% of 50 DAV
50 DAV is 57,000
|
$78.96
2.30%
|
2/28/2014
|
$74.65
|
PP = $76.93
|
|
MB = $80.78
|
 Most Recent Note - 3/6/2014 12:53:11 PM
Y - Hitting a new 52-week high with today's considerable volume-driven gain. Rising above the pivot point based on its 2/21/14 high highlighted in the 2/28/14 mid-day report (read here). Gains above the pivot point should be backed by a minimum of +40% above average volume to trigger a proper technical buy signal.

>>> FEATURED STOCK ARTICLE : Earnings Solid and Forming a Cup-With-Handle - 2/28/2014
View all notes |
Set NEW NOTE alert |
CANSLIM.net Company Profile |
SEC
News |
Chart |
Request a new note
C
A N
S L
I M
|
SILC
-
NASDAQ
Silicom Ltd
COMPUTER HARDWARE - Networking andamp; Communication Dev
|
$70.04
|
-2.96
-4.05% |
$73.31
|
110,987
140.49% of 50 DAV
50 DAV is 79,000
|
$73.44
-4.63%
|
12/23/2013
|
$44.62
|
PP = $46.25
|
|
MB = $48.56
|
Most Recent Note - 3/6/2014 3:27:40 PM
G - Pulling back from all-time highs with today's loss on higher volume. Extended from any sound base after 11 consecutive weekly gains. Patient investors may watch for a new base or secondary buy point to possibly develop and be noted in the weeks ahead.
>>> FEATURED STOCK ARTICLE : Very Extended From Prior Base After 11 Straight Weekly Gains - 3/6/2014
View all notes |
Set NEW NOTE alert |
CANSLIM.net Company Profile |
SEC
News |
Chart |
Request a new note
C
A N
S L
I M
|
ULTI
-
NASDAQ
Ultimate Software Group
INTERNET - Internet Software and Services
|
$162.95
|
-3.17
-1.91% |
$166.23
|
120,555
59.10% of 50 DAV
50 DAV is 204,000
|
$171.96
-5.24%
|
1/27/2014
|
$153.75
|
PP = $162.98
|
|
MB = $171.13
|
Most Recent Note - 3/5/2014 5:24:56 PM
Y - Still hovering above its pivot point and below its "max buy" level. Found support above its 50 DMA line following a worrisome "negative reversal" on 2/05/14.
>>> FEATURED STOCK ARTICLE : Near 52--Week High Following Another Volume-Driven Gain - 3/4/2014
View all notes |
Set NEW NOTE alert |
CANSLIM.net Company Profile |
SEC
News |
Chart |
Request a new note
C
A N
S L
I M
|
Symbol/Exchange
Company Name
Industry Group |
PRICE |
CHANGE
(%Change) |
Day High |
Volume
(% DAV)
(% 50 day avg vol) |
52 Wk Hi
% From Hi |
Featured
Date |
Price
Featured |
Pivot Featured |
|
Max Buy |
VRX
-
NYSE
Valeant Pharmaceuticals
DRUGS - Drug Manufacturers - Other
|
$138.55
|
-6.58
-4.53% |
$145.00
|
4,772,702
314.41% of 50 DAV
50 DAV is 1,518,000
|
$153.10
-9.50%
|
9/11/2013
|
$100.26
|
PP = $105.50
|
|
MB = $110.78
|
Most Recent Note - 3/6/2014 3:26:40 PM
G - Down considerably today for its largest one-day loss on very heavy volume, weak action considered to be a technical sell signal. Pulling back from new all-time highs hit last week. Slumping near its 50 DMA line ($134) which defines near-term support where a violation may raise more serious concerns and trigger a more worrisome technical sell signal.
>>> FEATURED STOCK ARTICLE : Strong Earnings Report; On Track for 9th Weekly Gain in 10 Weeks - 2/27/2014
View all notes |
Set NEW NOTE alert |
CANSLIM.net Company Profile |
SEC
News |
Chart |
Request a new note
C
A N
S L
I M
|
|
|
|
THESE ARE NOT BUY RECOMMENDATIONS!
Comments contained in the body of this report are technical
opinions only. The material herein has been obtained
from sources believed to be reliable and accurate, however,
its accuracy and completeness cannot be guaranteed.
This site is not an investment advisor, hence it does
not endorse or recommend any securities or other investments.
Any recommendation contained in this report may not
be suitable for all investors and it is not to be deemed
an offer or solicitation on our part with respect to
the purchase or sale of any securities. All trademarks,
service marks and trade names appearing in this report
are the property of their respective owners, and are
likewise used for identification purposes only.
This report is a service available
only to active Paid Premium Members.
You may opt-out of receiving report notifications
at any time. Questions or comments may be submitted
by writing to Premium Membership Services 665 S.E. 10 Street, Suite 201 Deerfield Beach, FL 33441-5634 or by calling 1-800-965-8307
or 954-785-1121.
|
|
|

