You are not logged in.
This means you
CAN ONLY VIEW reports that were published prior to Friday, April 11, 2025.
You
MUST UPGRADE YOUR MEMBERSHIP if you want to see any current reports.
AFTER MARKET UPDATE - FRIDAY, FEBRUARY 28TH, 2020
Previous After Market Report Next After Market Report >>>
|
|
|
|
DOW |
-357.28 |
25,409.36 |
-1.39% |
|
Volume |
2,458,606,890 |
+40% |
|
Volume |
5,305,391,900 |
+18% |
|
NASDAQ |
+0.89 |
8,567.37 |
+0.01% |
|
Advancers |
700 |
26% |
|
Advancers |
1,212 |
37% |
|
S&P 500 |
-24.54 |
2,954.22 |
-0.82% |
|
Decliners |
1,946 |
74% |
|
Decliners |
2,074 |
63% |
|
Russell 2000 |
-21.44 |
1,476.43 |
-1.43% |
|
52 Wk Highs |
8 |
|
|
52 Wk Highs |
57 |
|
|
S&P 600 |
-15.06 |
884.78 |
-1.67% |
|
52 Wk Lows |
938 |
|
|
52 Wk Lows |
732 |
|
|
 |
New 52-Week Lows Totals Swell as Major Indices Suffer
Kenneth J. Gruneisen - Passed the CAN SLIM® Master's Exam
The Dow fell 357 points, while the S&P 500 slid 0.8% and the Nasdaq Composite rallied to finish essentially unchanged. The Dow lost 12.4% for the week, capping a 10.1% February loss, its worst monthly performance since 2009. The S&P 500 fell 11.5% on the week and 8.4% in February. The Nasdaq outperformed on a relative basis, declining 10.5% this week and 6.4% in February. Breadth was clearly negative as decliners led advancers by almost a 3-1 margin on the NYSE and by 5-3 on the Nasdaq exchange. The reported volume totals were again higher than the prior session totals on the NYSE and on the Nasdaq exchange, indicative of increasing distributional pressure or selling from the institutional crowd. Leadership was thin as there were only 2 high-ranked companies from the Leaders List that hit a new 52-week high and were listed on the BreakOuts Page, down from the 139 on last Wednesday's session. New 52-week lows totals swelled to the highest levels seen since March of 2009 and easily outnumbered the small number of new 52-week highs on the NYSE and on the Nasdaq exchange. The major indices' (M criteria) have come under heavier pressure and earned the label of a "market correction". Disciplined investors know to watch for technical sell signals on a case-by-case basis and stand ready to reduce exposure especially if the market suffers more damaging losses. The Featured Stocks Page provides the most timely analysis on high-ranked leaders. Charts used courtesy of www.stockcharts.com
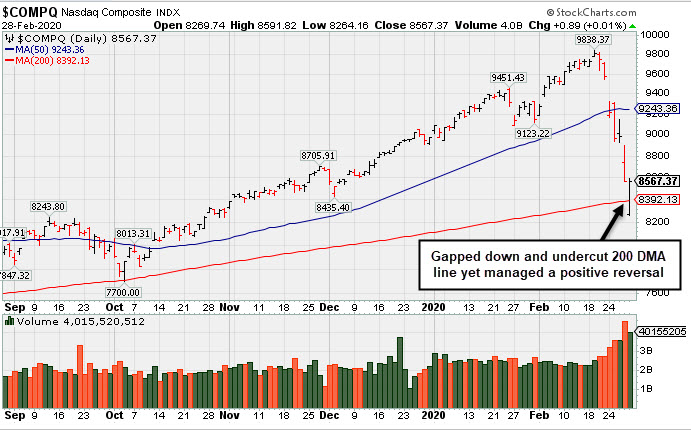
PICTURED: The Nasdaq Composite Index undercut its 200-day moving average (DMA) line yet managed a positive reversal on Friday's session. The tech-heavy index is -13.7% off its all-time high hit on 2/19/20 after damaging losses marked by heavier volume.
Stocks were mostly lower once again on Friday, capping the worst weekly performance for U.S. equities since the 2008 Financial Crisis. While today’s decline marked the seventh-consecutive losing session for the S&P 500, the major averages finished well above their mid-session lows.
A rise in coronavirus cases outside of China continued to dampen sentiment, raising concerns that the impact to global economic growth could extend beyond the first half of 2020. Speaking on the recent uncertainty, Federal Reserve Chair Jerome Powell reiterated that the U.S. economy remains on solid footing, but acknowledged that policymakers were prepared to “act as appropriate” to support the economy as they closely monitored the coronavirus outbreak. U.S. Treasuries extended this week’s record setting rally on Friday. The yield on the benchmark 10-year note slid 12 basis points to 1.16%, capping a 41 basis points weekly decline.
Eight of 11 S&P 500 sectors finished lower on the session with Technology, Communication Services, and Energy shares bucking the downtrend. The Utilities sector, which outperformed on a relative basis for most of the week, was the worst performing group on Friday, losing 3.3%. |
 Kenneth J. Gruneisen started out as a licensed stockbroker in August 1987, a couple of months prior to the historic stock market crash that took the Dow Jones Industrial Average down -22.6% in a single day. He has published daily fact-based fundamental and technical analysis on high-ranked stocks online for two decades. Through FACTBASEDINVESTING.COM, Kenneth provides educational articles, news, market commentary, and other information regarding proven investment systems that work in good times and bad.
Comments contained in the body of this report are technical opinions only and are not necessarily those of Gruneisen Growth Corp. The material herein has been obtained from sources believed to be reliable and accurate, however, its accuracy and completeness cannot be guaranteed. Our firm, employees, and customers may effect transactions, including transactions contrary to any recommendation herein, or have positions in the securities mentioned herein or options with respect thereto. Any recommendation contained in this report may not be suitable for all investors and it is not to be deemed an offer or solicitation on our part with respect to the purchase or sale of any securities. |
|
 |
Biotech, Semiconductor, and Energy-Linked Indexes Bounced
Kenneth J. Gruneisen - Passed the CAN SLIM® Master's Exam
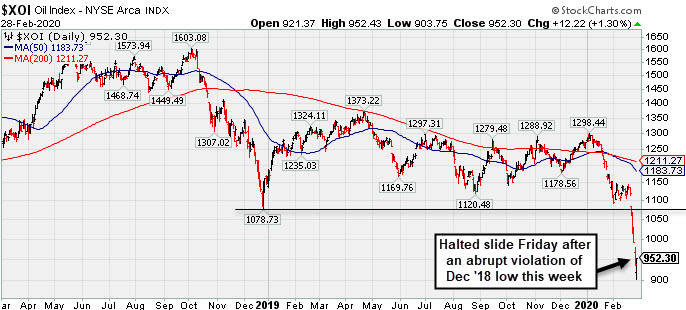
The Bank Index ($BKX -2.44%) and Broker/Dealer Index ($XBD -1.88%) both outpaced the Retail Index ($RLX -0.84%) to the downside. The tech sector was mixed as the Networking Index ($NWX -0.46%), meanwhile, the Biotech Index ($BTK +1.48%) and Semiconductor Index ($SOX +2.21%) both notched solid gains. Commodity-linked groups were mixed as the Oil Services Index ($OSX +2.63%) and Integrated Oil Index ($XOI +1.30%) both posted gains, meanwhile, the Gold & Silver Index ($XAU -5.69%) lost considerable ground for the 2nd day in a row.
PICTURED: The Integrated Oil Index ($XOI +1.30%) halted its slide on Friday after abruptly violating its Dec '18 low with damaging losses this week.
| Oil Services |
$OSX |
52.11 |
+1.34 |
+2.64% |
-33.44% |
| Integrated Oil |
$XOI |
952.30 |
+12.22 |
+1.30% |
-25.05% |
| Semiconductor |
$SOX |
1,705.54 |
+36.89 |
+2.21% |
-7.79% |
| Networking |
$NWX |
491.28 |
-2.26 |
-0.46% |
-15.79% |
| Broker/Dealer |
$XBD |
266.29 |
-5.10 |
-1.88% |
-8.30% |
| Retail |
$RLX |
2,366.23 |
-20.15 |
-0.84% |
-3.39% |
| Gold & Silver |
$XAU |
94.15 |
-5.68 |
-5.69% |
-11.94% |
| Bank |
$BKX |
91.62 |
-2.30 |
-2.45% |
-19.18% |
| Biotech |
$BTK |
4,889.69 |
+71.29 |
+1.48% |
-3.51% |
|
|
|
 |
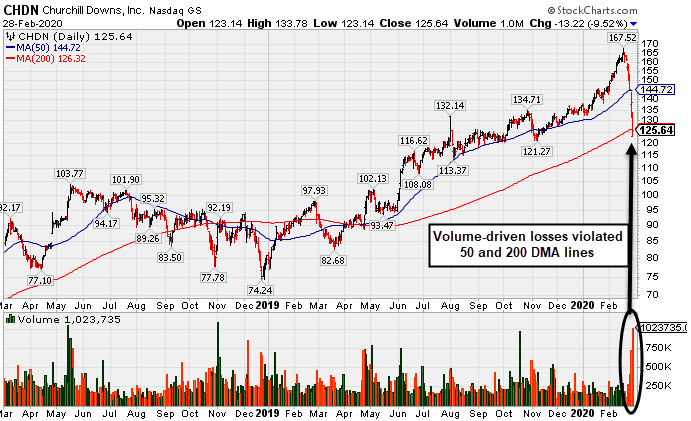
Steep Losses Violated Both 50-Day and 200-Day Moving Average
Kenneth J. Gruneisen - Passed the CAN SLIM® Master's Exam
Churchill Downs Inc (CHDN -$13.22 or -9.52% to $125.64) violated its 50-day and 200-day moving average (DMA) lines this week triggering technical sell signals, and there was heavier volume behind today's 7th consecutive loss. It will be dropped from the Featured Stocks list tonight. A rebound above the 50 DMA line ($144) is needed for its outlook to improve.
Weak action came after CHDN reported Dec '19 earnings +100% on +28% sales revenues, although that was a noted improvement after the Jun and Sep '19 quarterly earnings versus the year ago periods were both below the +25% minimum guideline (C criteria). Fundamental concerns have been noted, yet it still has an Earnings Per Share Rating of 95. Annual earnings (A criteria) growth has been strong since a downturn in FY '14.
The L criteria of the fact-based investment system guides investors toward buying leading stocks that are in leading industry groups. The Leisure - Gaming/Equipment industry group has a Group Relative Strength Rating of A.
The number of top-rated funds owning its shares rose from 333 in Jun '17 to 495 in Dec '19, a reassuring sign concerning the I criteria. Its current Up/Down Volume Ratio of 0.9 is an unbiased indication its shares have been under distributional pressure over the past 50 days. It has a small supply of 39.8 million shares (S criteria) outstanding following a 3:1 split effective 1/28/19, and this small supply can contribute to greater price volatility in the event of institutional buying or selling.
|
|
|
Color Codes Explained :
Y - Better candidates highlighted by our
staff of experts.
G - Previously featured
in past reports as yellow but may no longer be buyable under the
guidelines.
***Last / Change / Volume data in this table is the closing quote data***
Symbol/Exchange
Company Name
Industry Group |
PRICE |
CHANGE
(%Change) |
Day High |
Volume
(% DAV)
(% 50 day avg vol) |
52 Wk Hi
% From Hi |
Featured
Date |
Price
Featured |
Pivot Featured |
|
Max Buy |
 FTNT
-
NASDAQ
FTNT
-
NASDAQ
Fortinet Inc
Computer Sftwr-Security
|
$102.06
|
-0.58
-0.57% |
$104.07
|
3,565,004
282.26% of 50 DAV
50 DAV is 1,263,000
|
$121.82
-16.22%
|
12/9/2019
|
$103.85
|
PP = $106.10
|
|
MB = $111.41
|
Most Recent Note - 2/27/2020 5:21:30 PM
G - Suffered another damaging loss on higher volume today, slumping further after a gap down on 2/24/20 triggering technical sell signals. A rebound above the 50 DMA line ($113.86) is needed for its outlook to improve.Reported earnings +29% on +21% sales revenues for the Dec '19 quarter, continuing its strong earnings track record above the +25% minimum guideline (C criteria). See the latest FSU analysis for more details and an annotated graph.
>>> FEATURED STOCK ARTICLE : Volume Driven Losses Violated 50-Day Moving Average - 2/26/2020 |
View all notes |
Set NEW NOTE alert |
Company Profile |
SEC
News |
Chart |
Request a new note
C
A
S
I |
CHDN
-
NASDAQ
Churchill Downs Inc
LEISURE - Gaming Activities
|
$125.64
|
-13.22
-9.52% |
$133.78
|
1,023,746
480.63% of 50 DAV
50 DAV is 213,000
|
$167.53
-25.00%
|
10/8/2019
|
$129.77
|
PP = $132.83
|
|
MB = $139.47
|
 Most Recent Note - 2/28/2020 5:50:20 PM
It will be dropped from the Featured Stocks list tonight. Violated its 50 and 200 DMA line this week and had heavier volume behind today's 7th consecutive loss. A rebound above the 50 DMA line is needed for its outlook to improve. Reported Dec '19 earnings +100% on +28% sales revenues, and improvement after the Jun and Sep '19 quarterly earnings versus the year ago periods were both below the +25% minimum guideline (C criteria). See the latest FSU analysis for more details and a new annotated graph.
>>> FEATURED STOCK ARTICLE : Steep Losses Violated Both 50-Day and 200-Day Moving Average - 2/28/2020 |
View all notes |
Set NEW NOTE alert |
Company Profile |
SEC
News |
Chart |
Request a new note
C
A
S
I |
LULU
-
NASDAQ
Lululemon Athletica
MANUFACTURING - Textile Manufacturing
|
$217.41
|
-3.29
-1.49% |
$217.70
|
3,727,022
253.54% of 50 DAV
50 DAV is 1,470,000
|
$266.20
-18.33%
|
9/6/2019
|
$201.25
|
PP = $194.35
|
|
MB = $204.07
|
Most Recent Note - 2/27/2020 5:04:30 PM
G - Gapped down today and suffered a big loss on heavy volume violating its 50 DMA line ($240) and prior low ($231.84 on 1/27/20) triggering technical sell signals. Only a prompt rebound would help its outlook improve. Fundamentals remain strong.
>>> FEATURED STOCK ARTICLE : Perched at Record High After 4th Consecutive Gain on Light Volume - 2/20/2020 |
View all notes |
Set NEW NOTE alert |
Company Profile |
SEC
News |
Chart |
Request a new note
C
A
S
I |
SPLK
-
NASDAQ
Splunk Inc
Computer Sftwr-Database
|
$147.33
|
+0.46
0.31% |
$148.56
|
2,919,741
190.83% of 50 DAV
50 DAV is 1,530,000
|
$176.31
-16.44%
|
11/25/2019
|
$147.79
|
PP = $142.16
|
|
MB = $149.27
|
Most Recent Note - 2/27/2020 5:18:32 PM
G - Violated its 50 DMA line ($157.76) with a damaging volume-driven loss raising concerns and triggering a more worrisome technical sell signal. Only a prompt rebound would help its outlook improve.
>>> FEATURED STOCK ARTICLE : Perched at Record High After 7th Consecutive Gain - 2/19/2020 |
View all notes |
Set NEW NOTE alert |
Company Profile |
SEC
News |
Chart |
Request a new note
C
A
S
I |
PAYC
-
NYSE
Paycom Software Inc
COMPUTER SOFTWARE and SERVICES - Application Software
|
$282.65
|
+1.29
0.46% |
$283.60
|
1,460,460
155.37% of 50 DAV
50 DAV is 940,000
|
$342.00
-17.35%
|
11/20/2019
|
$252.97
|
PP = $259.81
|
|
MB = $272.80
|
Most Recent Note - 2/27/2020 5:06:29 PM
G - Slumped below its 50 DMA line ($292) with today's loss on average volume raising concerns and triggering a technical sell signal. Only a prompt rebound would help its outlook improve. Fundamentals remain strong after it reported earnings +41% on +29% for the Dec '19 quarter.
>>> FEATURED STOCK ARTICLE : Pulled Back Near 50-Day Average Following Strong Earnings Report - 2/11/2020 |
View all notes |
Set NEW NOTE alert |
Company Profile |
SEC
News |
Chart |
Request a new note
C
A
S
I |
Symbol/Exchange
Company Name
Industry Group |
PRICE |
CHANGE
(%Change) |
Day High |
Volume
(% DAV)
(% 50 day avg vol) |
52 Wk Hi
% From Hi |
Featured
Date |
Price
Featured |
Pivot Featured |
|
Max Buy |
BLD
-
NYSE
Topbuild Corp
Bldg-Constr Prds/Misc
|
$101.00
|
-5.36
-5.04% |
$104.38
|
764,001
243.31% of 50 DAV
50 DAV is 314,000
|
$125.66
-19.62%
|
12/9/2019
|
$109.71
|
PP = $113.84
|
|
MB = $119.53
|
Most Recent Note - 2/28/2020 5:52:49 PM
Slumped near its 200 DMA line with above average volume behind today's 6th consecutive loss. It will be dropped from the Featured Stocks list tonight. Only a prompt rebound above the 50 DMA line ($111) would help its outlook improve.
>>> FEATURED STOCK ARTICLE : 50-Day Moving Average Violation Has Hurt Outlook - 2/27/2020 |
View all notes |
Set NEW NOTE alert |
Company Profile |
SEC
News |
Chart |
Request a new note
C
A
S
I |
TEAM
-
NASDAQ
Atlassian Corp Plc Cl A
Comp Sftwr-Spec Enterprs
|
$144.96
|
+1.96
1.37% |
$145.00
|
2,217,535
139.73% of 50 DAV
50 DAV is 1,587,000
|
$156.12
-7.15%
|
1/24/2020
|
$144.66
|
PP = $140.49
|
|
MB = $147.51
|
Most Recent Note - 2/27/2020 5:16:30 PM
Y - Showing resilience and still consolidating above its 50 DMA line ($137) amid widespread market weakness (M criteria). Fundamentals remain strong.
>>> FEATURED STOCK ARTICLE : Atlassian Has Been Hovering Near its All-Time High - 2/12/2020 |
View all notes |
Set NEW NOTE alert |
Company Profile |
SEC
News |
Chart |
Request a new note
C
A
S
I |
STNE
-
NASDAQ
Stoneco Ltd Cl A
Finance-CrdtCard/PmtPr
|
$39.89
|
-1.96
-4.68% |
$42.33
|
3,991,865
217.42% of 50 DAV
50 DAV is 1,836,000
|
$45.72
-12.75%
|
1/22/2020
|
$43.94
|
PP = $45.72
|
|
MB = $48.01
|
Most Recent Note - 2/28/2020 5:56:23 PM
G - Color code is changed to green after a volume-driven loss today violated its 50 DMA line ($41.53) raising concerns. The worrisome market correction (M criteria) is also cause for concern, even if there are subsequent gains above the pivot point backed by at least +40% above average volume to trigger a technical buy signal.
>>> FEATURED STOCK ARTICLE : 50-Day Moving Average Line Violation Hurts Outlook - 2/10/2020 |
View all notes |
Set NEW NOTE alert |
Company Profile |
SEC
News |
Chart |
Request a new note
C
A
S
I |
DAVA
-
NYSE
Endava Plc Cl A Ads
Computer-Tech Services
|
$53.05
|
-2.07
-3.76% |
$54.45
|
264,612
222.36% of 50 DAV
50 DAV is 119,000
|
$56.76
-6.54%
|
2/13/2020
|
$53.71
|
PP = $49.86
|
|
MB = $52.35
|
Most Recent Note - 2/28/2020 12:40:56 PM
G - Perched near its all-time high hit this week, which makes it an outlier in a very weak market (M criteria). Prior highs in the $49 area define initial support to watch above its 50 DMA line ($48.44).
>>> FEATURED STOCK ARTICLE : Breakout Gain Backed By +462% Above Average Volme - 2/13/2020 |
View all notes |
Set NEW NOTE alert |
Company Profile |
SEC
News |
Chart |
Request a new note
C
A
S
I |
|
|
|
THESE ARE NOT BUY RECOMMENDATIONS!
Comments contained in the body of this report are technical
opinions only. The material herein has been obtained
from sources believed to be reliable and accurate, however,
its accuracy and completeness cannot be guaranteed.
This site is not an investment advisor, hence it does
not endorse or recommend any securities or other investments.
Any recommendation contained in this report may not
be suitable for all investors and it is not to be deemed
an offer or solicitation on our part with respect to
the purchase or sale of any securities. All trademarks,
service marks and trade names appearing in this report
are the property of their respective owners, and are
likewise used for identification purposes only.
This report is a service available
only to active Paid Premium Members.
You may opt-out of receiving report notifications
at any time. Questions or comments may be submitted
by writing to Premium Membership Services 665 S.E. 10 Street, Suite 201 Deerfield Beach, FL 33441-5634 or by calling 1-800-965-8307
or 954-785-1121.
|
|
|